

1 June 2015 | Society, Organizations and the BrainFrontiers in Human Neuroscience
Frontiers Copyright Statement
© Copyright 2007-2015 Frontiers
Media SA. All rights reserved.
All content included on this site,
such as text, graphics, logos, button
icons, images, video/audio clips,
downloads, data compilations and
software, is the property of or is
licensed to Frontiers Media SA
(“Frontiers”) or its licensees and/or
subcontractors. The copyright in the
text of individual articles is the property
of their respective authors, subject to
a license granted to Frontiers.
The compilation of articles constituting
this e-book, wherever published,
as well as the compilation of all other
content on this site, is the exclusive
property of Frontiers. For the
conditions for downloading and
copying of e-books from Frontiers’
website, please see the Terms for
Website Use. If purchasing Frontiers
e-books from other websites
or sources, the conditions of the
website concerned apply.
Images and graphics not forming part
of user-contributed materials may
not be downloaded or copied
without permission.
Individual articles may be downloaded
and reproduced in accordance
with the principles of the CC-BY
licence subject to any copyright or
other notices. They may not be
re-sold as an e-book.
As author or other contributor you
grant a CC-BY licence to others to
reproduce your articles, including any
graphics and third-party materials
supplied by you, in accordance with
the Conditions for Website Use and
subject to any copyright notices which
you include in connection with your
articles and materials.
All copyright, and all rights therein,
are protected by national and
international copyright laws.
The above represents a summary
only. For the full conditions see the
Conditions for Authors and the
Conditions for Website Use.
ISSN 1664-8714
ISBN 978-2-88919-580-0
DOI 10.3389/978-2-88919-580-0
About Frontiers
Frontiers is more than just an open-access publisher of scholarly articles: it is a pioneering
approach to the world of academia, radically improving the way scholarly research
is managed. The grand vision of Frontiers is a world where all people have an equal
opportunity to seek, share and generate knowledge. Frontiers provides immediate and
permanent online open access to all its publications, but this alone is not enough to
realize our grand goals.
Frontiers Journal Series
The Frontiers Journal Series is a multi-tier and interdisciplinary set of open-access, online
journals, promising a paradigm shift from the current review, selection and dissemination
processes in academic publishing. All Frontiers journals are driven by researchers for
researchers; therefore, they constitute a service to the scholarly community. At the same
time, the Frontiers Journal Series operates on a revolutionary invention, the tiered publishing
system, initially addressing specific communities of scholars, and gradually climbing up to
broader public understanding, thus serving the interests of the lay society, too.
Dedication to Quality
Each Frontiers article is a landmark of the highest quality, thanks to genuinely collaborative
interactions between authors and review editors, who include some of the world’s best
academicians. Research must be certified by peers before entering a stream of knowledge
that may eventually reach the public - and shape society; therefore, Frontiers only applies
the most rigorous and unbiased reviews.
Frontiers revolutionizes research publishing by freely delivering the most outstanding
research, evaluated with no bias from both the academic and social point of view.
By applying the most advanced information technologies, Frontiers is catapulting scholarly
publishing into a new generation.
What are Frontiers Research Topics?
Frontiers Research Topics are very popular trademarks of the Frontiers Journals Series:
they are collections of at least ten articles, all centered on a particular subject. With their
unique mix of varied contributions from Original Research to Review Articles, Frontiers
Research Topics unify the most influential researchers, the latest key findings and historical
advances in a hot research area! Find out more on how to host your own Frontiers
Research Topic or contribute to one as an author by contacting the Frontiers Editorial
Office: researchtopics@frontiersin.org

2 June 2015 | Society, Organizations and the BrainFrontiers in Human Neuroscience
This e-book brings together scholars in both the neurosciences and organizational sciences
who have adopted various approaches to study the cognitive mechanisms mediating the
social behavior that we see within organizations. Such an approach has been termed by
ourselves, and others, as ‘organisational cognitive neuroscience’. In recent years there has
been a veritable increase in studies that have explored the cognitive mechanisms driving such
behaviours, and much progress has been made in understanding the neural underpinnings of
processes such as financial exchange, risk awareness and even leadership. However, while these
studies are informative and add to our understanding of human cognition they fall short of
providing evidence-based recommendations for practice. Specifically, we address the broader
issue of how the neuroscientific study of such core social behaviors can be used to improve
the very way that we work. To address these gaps in our understanding the chapters in this
book serve as a platform that allows scholars in both the neurosciences and the organizational
sciences to highlight the work that spans across these two fields.
The consolidation of these two fields also serves to highlight the utility of a unified and
singular organizational cognitive neuroscience. This is a fundamentally important outcome of
the book as the application of neuroscience to address economically relevant behaviours has
seen a variety of fields evolve in their own right, such as neuromarketing, neuroeconomics
and so forth. The use of neuro-scientific technologies,in particular fMRI, has indeed led
to a bewildering and somewhat suffocating proliferation of new approaches, however, the
speed of such developments demands that we must proceed carefully with such ventures or
risk some fundamental mistakes. The book that you now hold will consolidates these new
neuroscience based approaches and in doing so highlight the importance of this approach
in helping us to understand human social behaviour in general. Taken together the chapters
provide a framework for scholars within the neurosciences who wish to explore the further
the opportunities that the study of organisational behaviour may provide.
Citation: Senior, C., Lee, N., Braeutigam, S., eds. (2015). Society, Organizations and the Brain:
Building Towards a Unified Cognitive Neuroscience Perspective. Lausanne: Frontiers Media.
doi: 10.3389/978-2-88919-580-0
SOCIETY, ORGANIZATIONS AND THE BRAIN:
BUILDING TOWARDS A UNIFIED COGNITIVE
NEUROSCIENCE PERSPECTIVE
Topic Editors:
Carl Senior, Aston University, UK
Nick Lee, Loughbourgh University, UK
Sven Braeutigam, Oxford University, UK

3 June 2015 | Society, Organizations and the BrainFrontiers in Human Neuroscience
Table of Contents
05 Society, organizations and the brain: building toward a unified cognitive
neuroscience perspective
Carl Senior, Nick Lee and Sven Braeutigam
09 The relationship between self-report of depression and media usage
Martin Block, Daniel B. Stern, Kalyan Raman, Sang Lee, Jim Carey, Ashlee A.
Humphreys, Frank Mulhern, Bobby Calder, Don Schultz, Charles N. Rudick, Anne J.
Blood and Hans C. Breiter
19 Antagonistic neural networks underlying differentiated leadership roles
Richard E. Boyatzis, Kylie Rochford and Anthony I. Jack
34 Redefining neuromarketing as an integrated science of influence
Hans C. Breiter, Martin Block, Anne J. Blood, Bobby Calder, Laura Chamberlain, Nick
Lee, Sherri Livengood, Frank J. Mulhern, Kalyan Raman, Don Schultz, Daniel B.
Stern, Vijay Viswanathan and Fengqing (Zoe) Zhang
41 Age-related striatal BOLD changes without changes in behavioral loss aversion
Vijay Viswanathan, Sang Lee, Jodi M. Gilman, Byoung Woo Kim, Nick Lee, Laura
Chamberlain, Sherri L. Livengood, Kalyan Raman, Myung Joo Lee, Jake Kuster,
Daniel B. Stern, Bobby Calder, Frank J. Mulhern, Anne J. Blood and Hans C. Breiter
53 On the interpretation of synchronization in EEG hyperscanning studies: a
cautionary note
Adrian P. Burgess
70 Operationalizing interdisciplinary research—a model of co-production in
organizational cognitive neuroscience
Michael J. R. Butler
73 Dehumanization in organizational settings: some scientific and ethical
considerations
Kalina Christoff
78 Cognitive requirements of competing neuro-behavioral decision systems: some
implications of temporal horizon for managerial behavior in organizations
Gordon R. Foxall
95 The marketing firm and consumer choice: implications of bilateral contingency
for levels of analysis in organizational neuroscience
Gordon R. Foxall
109 Near-infrared spectroscopy (NIRS) as a new tool for neuroeconomic research
Isabella M. Kopton and Peter Kenning
122 Ideology in organizational cognitive neuroscience studies and other misleading
claims
Dirk Lindebaum

4 June 2015 | Society, Organizations and the BrainFrontiers in Human Neuroscience
125 The evolution of leader–follower reciprocity: the theory of service-for-prestige
Michael E. Price and Mark Van Vugt
142 Recommendations for sex/gender neuroimaging research: key principles and
implications for research design, analysis, and interpretation
Gina Rippon, Rebecca Jordan-Young, Anelis Kaiser and Cordelia Fine
155 Using evolutionary theory to enhance the brain imaging paradigm
Gad Saad and Gil Greengross
158 A sociogenomic perspective on neuroscience in organizational behavior
Seth M. Spain and P. D. Harms
173 A face for all seasons: searching for context-specific leadership traits and
discovering a general preference for perceived health
Brian R. Spisak, Nancy M. Blaker, Carmen E. Lefevre, Fhionna R. Moore and Kleis
F. B. Krebbers
182 A case for neuroscience in mathematics education
Ana Susac and Sven Braeutigam
185 The role of attachment styles in regulating the effects of dopamine on the
behavior of salespersons
Willem Verbeke, Richard P. Bagozzi and Wouter E. van den Berg
198 A comment on the service-for-prestige theory of leadership
Christopher R. von Rueden
200 Interdisciplinary research is the key
David A. Waldman
203 Consumer neuroscience to inform consumers—physiological methods to
identify attitude formation related to over-consumption and environmental
damage
Peter Walla, Monika Koller and Julia L. Meier

EDITORIAL
published: 19 May 2015
doi: 10.3389/fnhum.2015.00289
Frontiers in Human Neuroscience | www.frontiersin.org May 2015 | Volume 9 | Article 289
Edited and reviewed by:
Srikantan S. Nagarajan,
University of California, San Francisco,
USA
*Correspondence:
Carl Senior,
c.senior@aston.ac.uk;
Nick Lee,
n.lee@lboro.ac.uk;
Sven Braeutigam,
sven.braeutigam@psych.ox.ac.uk
Received: 25 March 2015
Accepted: 04 May 2015
Published: 19 May 2015
Citation:
Senior C, Lee N and Braeutigam S
(2015) Society, organizations and the
brain: building toward a unified
cognitive neuroscience perspective.
Front. Hum. Neurosci. 9:289.
doi: 10.3389/fnhum.2015.00289
Society, organizations and the brain:
building toward a unified cognitive
neuroscience perspective
Carl Senior
1
*
, Nick Lee
2
*
and Sven Braeutigam
3
*
1
School of Life & Health Sciences, Aston University, Birmingham, UK,
2
School of Business and Economics, Loughborough
University, Loughborough, UK,
3
Oxford Centre for Human Brain Activity, Oxford University, Oxford, UK
Keywords: organizational cognitive neuroscience, functional brain imaging, neuromarketing, neuroeconomics
The Oxford English Dictionary contains the following entry for the word “postal” as:
• adjective relating to or carried out by post.
– PHRASES go postal US informal go mad, especially from stress. With reference to cases in
which postal employees have run amok and shot colleagues.
Even a superficial knowledge of recent events may lead to the conclusion that the contemporary
organization is perhaps not an easy thing to manage in a way that guarantees both economic
and social prosperity. As such, it seems to be part of the modern human condition to be at least
somewhat unhappy, stressed, or otherwise negatively impacted by either organizational life itself,
or the impact of organizations on today’s society. Fortunately, however, worst-case scenarios—as
implied by the OED above—are very rare.
It does not come as a surprise then, that researchers have expended considerable efforts on
exploring and understanding the formation, management, and ethical sustentation of organizations
of all kinds and sizes, from bleeding-edge venture enterprises operating in break-ne ck markets to
perhaps non-competitive, non-profit charities. Drawing from an interest in the negative effects
workplaces can have on individuals, some of us published a clarion call, raising questions about
how a better understanding of our biological systems could inform an understanding of the social
behavior that we manifest within organizations (Butler and Senior, 2007a,b). The critical question
here is how the organization and the individual interact and influence each other, given that it that
organizations are designed as they are by t he very same species which will work in them, and equally
important how cognitive neuroscience in particular can help to unravel such mechanisms.
Scholars have indeed begun to explore the neuroscience of organizational behavior. These efforts
go under the names of Organizational Neuroscience and Organizational Cognitive Neuroscience,
terms that refer to cross-disciplinary perspectives on organizational research, which take as their
foci of study the cognitive mechanisms that drive human behaviors in response to organizational
manifestations (Senior et al., 2008, 2011; Becker et al., 2011; Lee et al., 2012a). Such approaches seem
to have some merit in the study of the effects of organizational life on human beings, and also on
how one can mitigate the more deleterious effects that appear inherent to such contexts. However,
even with such rich empirical intercourse there remains an opportunity to examine further the
current state of the art research endeavors that span the biological and organizational domains to
inform our understanding of the type of social behavior that most of us will carry out most days for
most of our lives.
The articles contained within this research topic do just that, and go beyond merely explicating
further the possible mechanisms that drive “social behavior that occurs within organizational
manifestations” (Senior et al., 2011, p. 2) but ensure that such an understanding actually informs
5
|

Senior et al. Building toward a unified cognitive neuroscience
our knowledge of a socially rele vant and species specific social
behavior. In the call for papers we chose not to restrict the
nature of articles, but to ensure that all submissions could inform
our wider understanding social behavior in this applied context
(Waldman, 2013). The resulting submissions can be loosely
grouped into four main clusters–(a) general management, (b)
leadership, (c) neuromarketing science, and (d) papers that have
made specific recommendations for subsequent work.
To fully realize the potential for the impact of these articles,
it is important to first reflect upon the industrial revolution and
how it showed that complex products could most profitably be
made by breaking them up into small spe cialized, repetitive t asks.
As far back as the early 20th Century, with the emergence of
“scientific management” (e.g., Taylor, 1911), and the principles of
Fordism, the place of humans in this workflow was also treated
as a mechanistic process, to be designed in such a way as to
maximize efficiency and minimize defects. In such a context,
one could be forgiven for wondering whether working in such
organizations was what humans were ideally suited to. Even so, it
is undeniable that humans are the only species to have organized
itself into abstract organizations (i.e., not solely related to survival
or socialization), suggesting that perhaps something about this
ability does confer a collective advantage, if not an individual
one. In such a context, one would be forgiven for fearing that
the application of cognitive neuroscientific technology to helping
us understand more about our behaviors within the workplace
may drive the onset of what might become a neo-scientific
management; one that sees the data from workers as merely a
mechanism to maximize efficiency and minimize defects. Yet the
articles contained in this research topic show that this is far from
the case and, rather than driving biological reductionism, the
articles collectively demonstrate the significant impact that such
approaches can bring to helping us understand human behavior.
In a novel approach to addressing a significant question, Block
et al. (2014) carried out a large-scale interrogation of an existing
database on media behavior and found a significant relationship
between media usage e.g., Internet, television and other social
media, and self-reports of depression. Christoff (2014) takes
exploration of the relationship between organizational settings
and mental-health a stage further, and argues that a discourse
exploring the role emotions play in organizational decision-
making is needed. In light of the fact that in modern
organizations, so many of us place such heavy emphasis on such
media outlets when enacting our working roles, considering the
possible effect that they may have on mental health ensures that
we consider the welfare of the individual workers of paramount
importance (see also Senior and Lee, 2013 for further discussion
here).
Taken together, the work by Spain and Harms (2014) and
Verbeke et al. (2014), converges on a greater understanding of
individual behavior within an organization at a genetic level.
This socio-economic approach is t hen examined further with the
submission by Foxall (2014a), who suggests a model for effective
managerial behavior; that is, the function of competitive neural
systems. The notion of dual systems operating in competition to
drive effective managerial behavior was examined further with
work by Boyatzis et al. (2014) who carried out an fMRI study
identifying ant
agonistic neural systems responsible for different
types of leadership behaviors.
Such work continues to inform our understanding of how
social cognitive neuros cience (Ochsner and Lieberman, 2001) can
adv
ance organizational research—a project essentially started by
our e arlier work (e.g., Lee et al., 2012a). In particular, and possibly
as the result of serendipitous collaboration, neuroscientific
measuring tools such as functional magnetic resonance imaging
(fMRI) and magnetoencephalography (MEG) have been applied
to a number of organizational research questions (e.g., McClure
et al., 2004; Braeutigam, 2005; Deppe et al., 2005). Such
approaches have given the world terms as “neuroeconomics”
(Braeutigam, 2005) and “neuromarketing” (Breiter et al., 2015b),
and have inspired some considerable controversy in the scientific
press (e.g., Nature Neuroscience July 2004). Such debate is
healthy and as is shown by Butler (2014), Lindebaum (2014),
and Waldman (2013) helps to drive consolidation of theory and
clarification of approaches.
This, then, is the foundation of Organizational Cognitive
Neuroscience (OCN), which as an approach brings together
diversity in research approaches that use neuroscientific theories
and methods to examine organizational research issues (Senior
et al., 2011; Lee et al., 2012a). Indeed, the benefits of an OCN
approach are exemplified by Foxall (2014b),Walla et al. (2014)
and Breiter et al. (2015a), who each describe how the study of
exchanges within a market scenario can provide insig hts more
general human behavior, which in turn would lead to a more
“integrated science of influence” (Breiter et al., 2015b p. 1). These
scholars highlight both theoretical and methodological advances
within mainstream cognitive neurosciences and the implications
for a greater understanding of human behavior when market
exchanges are specifically investigated. Such methodological
advances are explored further with work by Kopton and Kenning
(2014) and Burgess (2013) who, among other things, develop
novel statistical approaches for the analysis of hyper scanning
data—which looks likely to be a crucial technique in exploring
the sort of interactions so central to organizational life.
That said, such work clearly shows that theoretical
advancement is not dependent on simply grafting advanced
measurement tools (such as fMRI) on to existing theories, as
implied by many early uses terms such as “neuromarketing”
(and here we recognize that Breiter et al. (2015b) clearly define a
more scientifically-rigorous useage of neuromarketing). Instead,
the OCN approach explicitly recognizes that it is the interaction
between cognitive neuroscience and organizational research as
distinct fields of research which is critical—incorporating not
just new methods, but also new theoretical explanations. In such
a way, the field can lead to advances in both its parent disciplines
(Lee et al., 2012b).
We have previously conceptualized OCN as an approach that
considers human behavior made in response to organizational
manifestations (e.g., products, advertisements) as a set of
theoretical layers, e ach building upon the last to add more
context-specific theory (Lee et al., 2012b). At the most abstract
level, the behavior of individuals and groups at the intersection
between t he organization and the human is considered. Yet
such behavior is a subset of human social behavior in general.
Frontiers in Human Neuroscience | www.frontiersin.org 2 May 2015 | Volume 9 | Article 289
6
|

Senior et al. Building toward a unified cognitive neuroscience
Therefore it is an additional layer of theory that can be added
upon social psychology. In turn, social psychology is founded
on theories of cognitive psychology, which also impact directly
on many of our responses to organizational manifestations such
as advertisements and products. At an even more basic level,
are the lower-level brain systems and structures that drive such
cognitions, analysis here could be termed the neural level of
analysis. To facilitate investigations across the various layers
of analysis that are diagnostic of the organizational cognitive
neuroscience approach, Rippon et al. (2014) provide a set of
recommendations that could be adopted when studying the
effects of gender on particular task.
The organizational, social, and neural levels that are described
above have been the focus of existing OCN theory (e.g., Lee
and Chamberlain, 2007). Yet, at a more fundamental level one
can also describe the adaptive forces t hat have shaped our brain
physiology in an evolutionary advantageous manner (Saad and
Greengross, 2014). Knowledge of the evolutionary adaptations
that may mediate our behavior at the social and ultimately
organizational level is essential to complete the explanation
of why we behave in the way we do, and also critical in
understanding the potential negative (and positive) influence of
organizational life on human beings.
To move back to the example of “scientific management”
previously alluded to; an understanding of whether the ability
to focus on repetitive small tasks may have conferred an
evolutionary advantage in the past (which therefore would have
led to a predilection for this ability in humans) may then
lead to greater understanding of whether scientific management
principles are likely to be beneficial to employees. Importantly,
this is quite apart from the logical principles of the approach,
which may indeed suggest that it may be the most efficient
manner with which to produce a complex product with
minimum defe cts. Indeed, the key social processes (wit hin
organizations) that humans have a predilection toward are
discussed subsequently.
Such an idea has been developed further with t he work
by Saad and Greengross (2014), who go so far as to say
that an understanding of evolutionary theory is of paramount
importance when using cognitive neuroscientific technology to
explore organizationally-relevant behaviors. However, it is with
the work by Spisak et al. (2014) and Price and Van Vugt (2014)
where the importance of studying adaptive behaviors and the role
that they may play in facilitating effective organizational is made
crystal clear (See also von Rueden, 2014). Developing this further,
Susac and Braeutigam (2014) describe how an understanding
of the neural substrates underpinning mathematical cognition
may in fact facilitate the ability for mathematical re asoning—
which itself has implic ations for the subsequent design of effective
education.
Here it is clear t hat it is not possible to fully understand a
given organizationally-relevant behavior by ignoring the various
interweaved layers of theory introduced above, Focusing on the
neural level—without taking into account the more fundamental
evolutionary level, or e ven the more abstract organizational
and social levels—is likely to result in important explanatory
contextual factors being overlooked. OCN explicitly recognizes
the symbiotic relationship between the layers of theory and in
doing so develops more rigorous testable hypotheses, and ties this
to advances in research methods that can more accurately test
these hypotheses. The studies noted above develop existing OCN
theory (e.g., Butler and Senior, 2007a) to show in more depth the
evolutionary processes that may impact on our organizationally-
relevant actions. The focus here is on how the neural and
evolutionary levels interact, and the question of whether such
adaptations actually can influence our behavior within, and our
response to, organizations and their manifestations.
As noted above, organizations that are designed around
the social processes that humans have a predilection for are
likely to operate more efficiently. Yet we should not consider
the application of neuroscience to understanding organizational
behavior as a means merely to make such organizations more
efficient. In spite of the working environment being constantly
in flux, the central concept of organizational behavior has and
will always remain the same. Most of us are likely to spend a
major proportion of our lives in a work-related environment.
One may argue thus that organizational cognitive neuroscience
is an approach by which to understand the cognitive signature of
our own species-specific social behavior.
We would like to dedicate this research topic to the many
reviewers who considered the submitted papers in such a timely
fashion–without them this collection would not have happened.
References
Becker, W. J., Cropanzano, R., and Sanfey, A. G. (2011). Organizational
neuroscience: taking organizational theory inside the neural black box.
J. Manag. 37, 933–961. doi: 10.1177/0149 2 0 6 3 1 1 3 9 8 9 5 5
Block, M., Stern, D. B., Raman, K., Lee, S., Carey, J., Humphreys, A. A., et al.
(2014). The relationship between self-report of depression and media usage.
Front. Hum. Neurosci. 8:712. doi: 10.3 3 8 9 /fnhum.2 0 1 4 .0 0 7 1 2
Boyatzis, R. E., Rochford, K., and Jack, A. I. (2014). Antagonistic neural networks
underlying differentiated leadership roles. Front. Hum. Neurosci. 8:114. doi:
10.3389/fnhum.2014.00114
Braeutigam, S. (2005). Neuroeconomics – from neural systems to economic
behaviour. Brain Res. Bull. 67, 355–360.doi: 10.10 1 6 /j .brainresbull.2005.
06.009
Breiter, H. C., Block, M., Blood, A. J., Calder, B., Chamberlain, L., Lee, N., et al.
(2015b). R edefining neuromarketing as an integrated science of influence.
Front. Hum. Neurosci. 8:1073. doi: 10 .3 3 8 9 /fnhum.2 0 1 4 .0 1 0 7 3
Breiter, H. C., Viswanathan, V., Lee, S., Gilman, J. M., Kim, B. W., Lee, N., et al.
(2015a). Age-related striatal BOLD changes without changes in behavioral loss
aversion. Front. Hum. Neurosci. 9:176. doi: 10.3389 /fnhum.2 0 1 5 .0 0 1 7 6
Burgess, A. P. (2013). On the interpretation of synchronization in EEG
hyperscanning studies: a cautionary note. Front. Hum. Neurosci. 7:881. doi:
10.3389/fnhum.2013.00881
Butler, M. J. R. (2014). Operationalizing interdisciplinary research—a model of
co-production in organizational cognitive neuroscience. Front. Hum. Neurosci.
7:720. doi: 10.3389/fnhum.2013.00720
Butler, M. J. R., and Senior, C. (2007a). Towards an organizational cognitive
neuroscience. Ann. N.Y. Acad. Sci. 111 8 , 1–17. doi: 10.1196/annals.1412.009
Frontiers in Human Neuroscience | www.frontiersin.org 3 May 2015 | Volume 9 | Article 289
7
|

Senior et al. Building toward a unified cognitive neuroscience
Butler, M. J. R., and Senior, C. (2007b). Research possibilities for organizational
cognitive neuroscience. Ann. N.Y. Acad. Sci. 1118, 206–210. doi:
10.1196/annals.1412.010
Christoff, K. (2014). Dehumanization in organizational settings: some
scientific and ethical considerations. Front. Hum. Neurosci. 8:748. doi:
10.3389/fnhum.2014.00748
Deppe, M., Schwindt, W., Kugel, H., Plassman, H., and Kenning, P. (2 0 0 5 ).
Non-linear responses within the medial prefrontal cortex reveal when specific
implicit information influences economic decision making. J. Neuroimaging 15,
171–182. doi: 10.1177/1051228405275074
Foxall, G. R. (2014a). Cognitive requirements of competing neuro-
behavioral decision systems: some implications of temporal horizon for
managerial behavior in organizations. Front. Hum. Neurosci. 8:184. doi:
10.3389/fnhum.2014.00184
Foxall, G. R. (2014b). The marketing firm and consumer choice: implications
of bilateral contingency for levels of analysis in organizational neuroscience.
Front. Hum. Neurosci. 8:472. doi: 10.3 3 8 9 /fnhum.2 0 1 4 .0 0 4 7 2
Kopton, I. M., and Kenning, P. (2014). Near-infrared spectroscopy (NIRS) as
a new tool for neuroeconomic research. Front. Hum. Neurosci. 8:549. doi:
10.3389/fnhum.2014.00549
Lee, N., Senior, C., and Butler, M. J. R. (2012a). The domain of organisational
cognitive neuroscience: Theoretical and empirical challenges. J. Manag. 38,
921–931. doi: 10.1177/0149206312439471
Lee, N., Senior, C., and Butler, M. J. R. (2012b). Leadership research and
cognitive neuroscience: the state of this union. Leadersh. Q. 23, 213–218. doi:
10.1016/j.leaqua.2011.08.001
Lee, N., and Chamberlain, L. (2007). Neuroimaging and psychophysiological
measurement in organizational research: an agenda for organizational cognitive
neuroscience. Ann. N.Y. Acad. Sci. 111 8 , 18–43.doi: 10.1196/annals.1412.003
Lindebaum, D. (2014). Ideology in organizational cognitive neuroscience
studies and other misleading claims. Front. Hum. Neurosci. 7:834. doi:
10.3389/fnhum.2013.00834
McClure, S. M., Li, J., Tomlin, D., Cypert, K. S., Montague, L. M., and Montague,
P. R. (2004). Neural correlates of behavioral preference for culturally familiar
drinks. Neuron44, 379–387. doi: 10.1016/j.neuron.2004.09.019
Ochsner, K. N., and Lieberman, M. D. (2001). The emergence of social cognitive
neuroscience. Am. Psychol. 56, 717–734. doi: 10.1037/0 0 0 3 - 0 6 6 X.5 6 .9 .7 1 7
Price, M. E., and Van Vugt, M. (2014). The evolution of leader–follower
reciprocity: the theory of service-for-prestige. Front. Hum. Neurosci. 8:363. doi:
10.3389/fnhum.2014.00363
Rippon, G., Jordan-Young, R., Kaiser, A., and Fine, C. (2014). Recommendations
for sex/gender neuroimaging research: key principles and implications for
research design, analysis, and interpretation. Front. Hum. Neurosci. 8:650. doi:
10.3389/fnhum.2014.00650
Saad, G., and Greengross, G. (2014). Using evolutionary theory to
enhance the brain imaging paradigm. Front. Hum. Neurosci. 8:452. doi:
10.3389/fnhum.2014.00452
Senior, C., and Lee, N. (2013). The state of the art in organisational cognitive
neuroscience: the therapeutic gap and possible implications for clinical practice.
Front. Hum. Neurosci. 7:808. doi: 10.3 3 8 9 /fnhum.2 0 1 3 .0 0 8 0 8
Senior, C., Butler, M. J. R., and Lee, N. (2008). Fear and loathing in the work place.
Am. J. Bioeth. 8, 20–21. doi: 10.1080/152651608021 8 0 0 8 3
Senior, C., Lee, N., and Butler, M. J. R. (2011). Organizational cognitive
neuroscience. Org. Sci. 22, 804–815. doi: 10.1287/orsc.1100.0532
Spain, S. M., and Harms, P. D. (201 4 ). A sociogenomic perspective on
neuroscience in organizational behavior. Front. Hum. Neurosci. 8:84. doi:
10.3389/fnhum.2014.00084
Spisak, B. R., Blaker, N. M., Lefevre, C. E., Moore, F. R., and Krebbers, K. F. B.
(2014). A face for all seasons: searching for context-specific leadership traits and
discovering a general preference for perceived health. Front. Hum. Neurosci.
8:792. doi: 10.3389/fnhum.2014.00792
Susac, A., and Braeutigam, S. (2014). A case for neuroscience in mathematics
education. Front. Hum. Neurosci. 8:314. doi: 10.3389/fnhum.2014.00314
Taylor, F. W. (1911). The Principles of Scientific Management. New York, NY:
Harper & Row.
Verbeke, W., Bagozzi, R . P., and van den Berg, W. E. (2014). The role of
attachment styles in regulating the effects of dopamine on the behavior
of salespersons. Front. Hum. Neurosci. 8:32. doi: 10 .3 3 8 9 /fnhum.2 0 1 4 .
00032
von Rueden, C. R. (2014). A comment on the service-for-prestige theory of
leadership. Front. Hum. Neurosci. 8:412. doi: 10.3389/fnhum.2014.00412
Waldman, D. A. (20 1 3 ). Interdisciplinary research is the key. Front. Hum.
Neurosci. 7:562. doi: 10.3389/fnhum.2013 .0 0 5 6 2
Walla, P., Koller, M., and Meier, J. L. (2014). Consumer neuroscience to inform
consumers—physiological methods to identify attitude formation related to
over-consumption and environmental damage. Front. Hum. Neurosci. 8:304.
doi: 10.3389/fnhum.2014.003 0 4
Conflict of Interest Statement: The authors declare that the research was
conducted in the absence of any commercial or financial relationships that could
be construed as a potential conflict of interest.
Copyright © 2015 Senior, Lee and Braeutigam. This is an open-access ar ticle
distributed under the terms of the Creative Commons Attribution License (CC BY).
The use, distribution or reproduction in other forums is permitted, provided the
original author(s) or licensor are credited and that the original publication in this
journal is cited, in accordance with accepted academic practice. No use, distribution
or reproduction is permitted which does not comply with these terms.
Frontiers in Human Neuroscience | www.frontiersin.org 4 May 2015 | Volume 9 | Article 289
8
|

ORIGINAL RESEARCH ARTICLE
published: 12 September 2014
doi: 10.3389/fnhum.2014.00712
The relationship between self-report of depression and
media usage
Martin Block
1,2
*
†
,DanielB.Stern
2,3†
, Kalyan Raman
1,2‡
, Sang Lee
2,4‡
,JimCarey
1,2‡
,
Ashlee A. Humphreys
1,2‡
, Frank Mulhern
1,2‡
, Bobby Calder
2,5‡
, Don Schultz
1,2‡
, Charles N. Rudick
2,6†
,
Anne J. Blood
2,4,7†
and Hans C. Breiter
2,3,4,7†
1
Medill Integrated Marketing Communications, Northwestern University, Evanston, IL, USA
2
Applied Neuromarketing Consortium, Medill, Kellogg, and Feinberg Schools, Northwestern University, Evanston, IL, USA
3
Department of Psychiatry and Behavioral Science, Warren Wright Adolescent Center, Northwestern University Feinberg School of Medicine, Chicago, IL, USA
4
Laboratory of Neuroimaging and Genetics, Department of Psychiatry, Massachusetts General Hospital, Boston, MA, USA
5
Department of Marketing, Kellogg School of Management, Northwestern University, Evanston, IL, USA
6
Department of Urology, Northwestern University Feinberg School of Medicine, Chicago, IL, USA
7
Mood and Motor Control Laboratory, Department of Psychiatry, Massachusetts General Hospital, Boston, MA, USA
Edited by:
Sven Braeutigam, University of
Oxford, UK
Reviewed by:
Christian Lambert, St. George’s
University of London, UK
Jessica Clare Scaife, Oxford
Univeristy, UK
*Correspondence:
Martin Block, Northwestern
University, Medill Integrated
Marketing Communications, MTC
3-123, 1845 Sheridan Road,
Evanston, IL 60208, USA
e-mail: mp-block@northwestern.edu
†,‡
Authors made equal contribu-
tions, corresponding to First (
†)or
Second (
‡) authorship.
Depression is a debilitating condition that adversely affects many aspects of a person’s life
and general health. Earlier work has supported the idea that there may be a relationship
between the use of certain media and depression. In this study, we tested if self-report of
depression (SRD), which is not a clinically based diagnosis, was associated with increased
internet, television, and social media usage by using data collected in the Media Behavior
and Influence Study (MBIS) database (N = 19,776 subjects). We further assessed the
relationship of demographic variables to this association. These analyses found that SRD
rates were in the range of published rates of clinically diagnosed major depression. It
found that those who tended to use more media also tended to be more depressed,
and that segmentation of SRD subjects was weighted toward internet and television
usage, which was not the case with non-SRD subjects, who were segmented along
social media use. This study found that those who have suffered either economic or
physical life setbacks are orders of magnitude more likely to be depressed, even without
disproportionately high levels of media use. However, among those that have suffered
major life setbacks, high media users—particularly television watchers—were even more
likely to report experiencing depression, which suggests that these effects were not just
due to individuals having more time for media consumption. These findings provide an
example of how Big Data can be used for medical and mental health research, helping
to elucidate issues not traditionally tested in the fields of psychiatry or experimental
psychology.
Keywords: depression, big data, marketing communications, media use
INTRODUCTION
Depression is known to affect many kinds of human behavior,
and is quite common. As of 2005, the lifetime prevalence of
major depressive disorder in the US population was reported to be
16.5% (Kessler et al., 2005a), with 6.7% prevalence in a 12-month
period, 30.4% of which were severe (or 2.0% of the U.S. popula-
tion) (Kessler et al., 2005b). Given the prevalence of depression,
there is interest from a neuromarketing perspective in how it
may be related to patterns of media consumption. Such issues
are of fundamental concern for mechanisms of behavior change
research and psychology (e.g., Morgenstern et al., 2013).
There is a developing literature e valuating the relationship
between v arious types of media use and psychiatric conditions.
For instance, one study found a high positive correlation between
internet addiction and depression among university students
(Orsal et al., 2012). Another study found that adults with major
depressive disorder spent excessive amounts of leisure time on
the computer, while those with dysthymia, panic disorder, and
agoraphobia spent more time watching television than the con-
trol group or those with other disorders (de Wit et al., 2011).
However, results have not always been consistent, particularly in
thedomainofsocialmediause.Arecentpaperfailedtofind
any association between social network use and depression in
older adolescents (Jelenchick et al., 2013), while other studies have
found positive associations between Facebook use and depression
in high school students (Pantic et al., 2012), and Facebook use
and a lack of subjective well-being in young adults (Kross et al.,
2013). Given the heterogeneity across previous studies, and the
rapid evolution of media formats over the past decade, we used a
large consumer database (>19,000 subjects) to assess the relation-
ship between self-reported depression (SRD) and media usage,
taking into account demographic information which may impact
the incidence of SRD such as employment status and disability.
We used SRD since major depression cannot be diagnosed with
Frontiers in Human Neuroscience www.frontiersin.org September 2014 | Volume 8 | Article 712
|
HUMAN NEUROSCIENCE
9

Block et al. The relationship between self-report of depression and media usage
big data surveys, and compared the rate of SRD to published
incidence data on the diagnosis of major depression.
This study differed from previous studies in the following
ways. (1) The sample size of the dataset was substantially larger
than any previous study e v aluating the relationship between
media use and depression. (2) We evaluated the link between
depression and multiple domains of media use, whereas most
previous studies have focused primarily on single domains. For
example, recent work with a smaller database has suggested there
is an increase in digital media usage in “depressed” adolescents
(Primack et al., 2009), but this study did not investigate its rela-
tionship to different subcomponents of media, such as social
media, internet, and television.
Our analysis started with descriptive and bivariate statisti-
cal analyses. These were followed by omnibus approaches to
assess general effects given the number of variables describing
media usage: (a) Chi-squared Automatic Interaction Detection or
CHAID tree analysis (Kass, 1980; Biggs et al., 1991)(aformof
recursive partitioning; Zhang and Singer, 1999) and (b) discrim-
inant analysis.
MATERIALS AND METHODS
DATA ACQUISITION
The dataset was derived from the Media Behavior and Influence
Study (MBIS), a syndicated online study of American adult (i.e.,
>18 years of age) consumers, conducted twice yearly since 2002
by BIGinsight of Columbus, Ohio. The current wave of 19,776
participants was completed in December, 2012. Using a dou-
ble opt-in methodology, each MBIS study was balanced to meet
demographic criteria established by the US census. MBIS data
has been used by a variety of well-known, commercial market-
ing organizations. Variables of interest included depression by
gender, age, employment status, marital status, race and ethnic-
ity, income, education, measures of isolation, and internet, TV
and social media use. These variables were selected because they
have been variables of interest in previous depression studies,
andhavebeenshowntohavepredictivevalue(e.g.,Catalano and
Dooley, 1977; Wilkowska-Chmielewska et al., 2013). Media usage
for internet, television, and social media are based on yes/no
responses to several day-parts of variable hour durations for
a typical weekday (see Supplementary Materials). These blocks
of time were shorter for typical waking hours and longer for
overnight and weekend periods. Block length was used to weight
media usage probability dur ing the calculation of total hours of
consumption (i.e., divided by the number of hours in each block
of time). Average hour exposure probabilities were calculated for
a 24 h period, and minutes per day were estimated by multi-
plying the result by 1440. Internet, TV, and social media usage
were hence composite variables created as probabilities of num-
ber of minutes daily usage, derived from data indicating w hether
or not subjects used the respective services in seven discrete
variable-hour blocks.
DATA ANALYSIS
Three types of analysis were performed with this data. First,
we performed a descriptive statistical analysis, inclusive of cor-
relations between depression and media consumption variables
to facilitate interpretation of the subsequent analyses. Second,
weusedtheresultstoinformatypeofrecursivepartitioning
(Morgan and Sonquist, 1963; Friedman, 1977; Breiman et al.,
1984; Gordon and Olshen, 1984; Quinlan, 1986; Mingers, 1989),
namely CHAID tree analysis (Kass, 1980; Biggs et al., 1991).
Third, we performed a multivariate discriminate analysis. Given
the descriptive statistical analyses were standard, these are not fur-
ther discussed herein. In all analyses below excepting the CHAID
analysis, fewer than 50 total comparisons were made; to correct
for multiple comparisons we used a Bonferroni correction for 50
comparisons, requiring a p < 0.001 to be considered a significant
result.
CHAID tree analysis
We performed two recursive partitioning analyses, one focused
on SRD and the second on a variable not of interest, namely non-
SRD, to act as a control for SRD results. Our working hypothesis
was that the control analysis of non-SRD subjects would not repli-
cate or provide an opponent (i.e., completely non-overlapping)
set of nodes to the analysis of SRD subjects.
Construction of statistical CHAID trees (SPSS tree) evaluated
the interaction among a number of predictor variables of SRD,
and separately non-SRD. Typically, such schemes are defined in
terms of demographic variables such as age and gender; however
we have also included occupation, education, marital status and
media use. Splitting criteria included minimum parent node size
of 100 and child node size of 50, and a p-value threshold of 0.05.
These splitting criteria were used for both CHAID analyses.
Discriminant analyses
Discriminant analysis was used to conduct a multivariate analy-
sis of variance for the hy pothesis that people who self-reported
having depression would differ significantly from non-SRD sub-
jects on a linear combination of eleven variables: income, internet
usage, TV usage, social media usage, education, age, living in top
10 metropolitan area (MSA), gender, having children, employ-
ment status, and disability. The discriminant analysis was run
using SPSS defaults, resulting in the canonical linear discriminant
analysis. Depression was the binary dependent variable entered
in the “group” dialog. The discriminating variables were entered
together (i.e., not stepwise) in the variables subcommand. The
discriminating variables income, internet usage, TV usage, social
media usage, and education, all took on continuous values in the
range from 0 to 1. “Living in top 10 MSA,” gender, employment
status and disability were binary categorical variables while hav-
ing children was ordinal. Overall, the data were complete with no
missing values (i.e., every subject had every data point).
RESULTS
DESCRIPTIVE AND CORRELATION ANALYSES
Geographic and temporal patterns
The MBIS study shows little to no geographic pattern for SRD
(Figure 1).
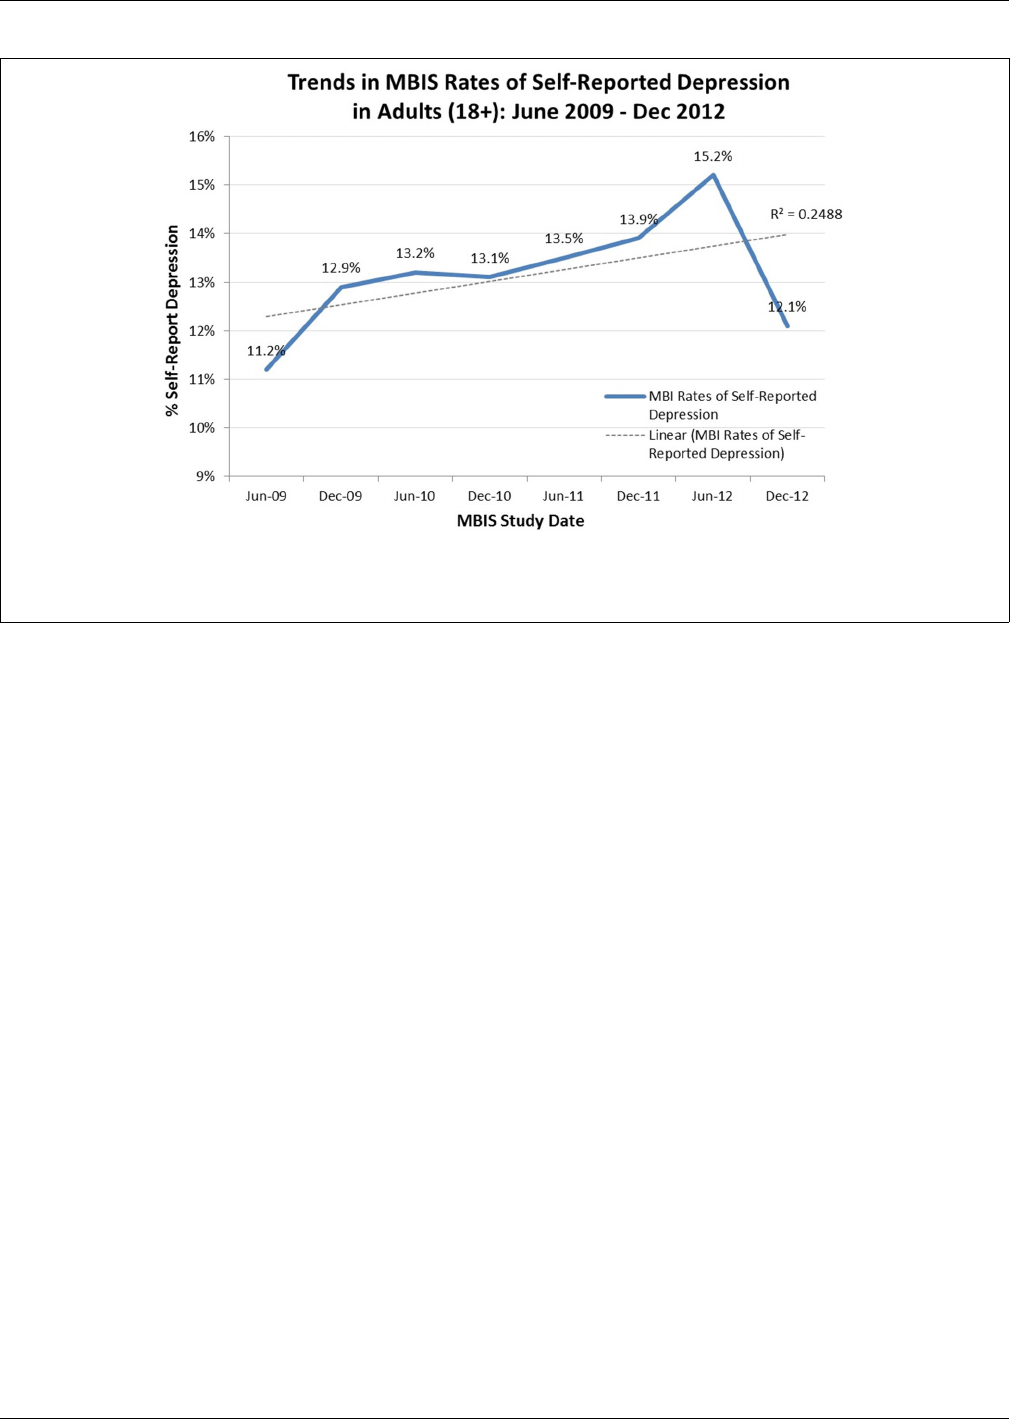
The data does show that SRD among all adults in the USA (18
and over) has grown from 11.2% in 2009 to 12.1% in December,
2012, with a linear trend (r
2
= 0.246) (Figure 2). It is interest-
ing that the r ate rises to 15.2% in June 2012 (similar to rates in
Frontiers in Human Neuroscience www.frontiersin.org September 2014 | Volume 8 | Article 712
|
10

Block et al. The relationship between self-report of depression and media usage
FIGURE 1 | Rates of Self-Reported Depression by State, December
2012. This infographic characterizes rates of self-reported depression by
state, with darker states showing greater rates of depression. The image
demonstrates few patterns in depression by geography, with perhaps the
exception that state with large metropolitan areas tend to show somewhat
less depression.
the 2005 MBIS data where the depressive rate was reported to be
14.9%), then drops to 12.1% in December 2012, which is con-
sistent with a previous study that used the emotive content of
tweets to show a similar annual pattern of decreased depression
over Christmas (Dodds et al., 2011).
Depression demographics
Gender. RatesofSRDinthecurrentstudywavewerenearlyiden-
tical by gender as shown in Tab le 1, with males slightly lower at
11.8%, compared to females at 12.3%.
Age and marital status. Bivariate analysis suggested an inverse
linear association of SRD with age, which is consistent with pre-
viously reported studies (Henderson et al., 1998). Individuals who
were married were also different than those who were unmar-
ried as shown in Ta ble 1, with married respondents representing
a large portion of the sample (42.5%), and reporting a lower
SRD rate of 9.5%. The highest rate of SRD was from those in
same sex unions, at 22.2%. Those living with an unmarried part-
ner, divorced or separated, or single (never married) reported
rates between 14.1% and 15.5%, while those that were widowed
reported rates (12.4%) nearly the same as the overall average.
Race and ethnicity. Tab le 1 showed lower rates among Hispanics
(10.9%), and lower yet among African-Americans (8.7%) and
Asians (7.9%) as compared to Multi-ethnic individuals and
Caucasians. SRD was highest among Caucasians (13.6%), who
represented more than half (58.4%) of the sample studied.
Income and education. Both income and education (Ta b le 1),
also demonstrated a strong inverse linear association with SRD,
similar to age (statistics not provided given omnibus analyses to
follow). Non-high school graduates self-reported a 21.7% depres-
sion rate compared to those with post college study or degree at
8.8%. The overall average income was $62,800, with those report-
ing depression indicating an average of $49,000. Occupation
levels showed similar effects, as shown in Tab le 1, with those dis-
abled (unable to work) reporting a 42.7% depression rate. Other
high reporting categories included the unemployed at 18.8%,
and students at 13.0%. The lowest category was professional and
management at 8.2%.
Health and lifestyle characteristics. SRD was also related to
the reporting of other health conditions as shown in Tabl e 1 .
Generally, those reporting depression were likely to say they
had other health-related conditions, such as anxiety (54.8%).
Other conditions more prevalent in SRC subjects included:
back pain (42.7%), overweight (37.6%), acid reflux (30.5%),
headaches/migraines (29.6%), insomnia/difficulty sleeping
(27.5%) (Tabl e 1 ).
Isolation. Residents of states with large urban areas and those
living in the top 10 metropolitan statistical areas (MSAs), have
lower rates of SRD. The top 10 MSAs include Los Angeles, New
York, Chicago, San Francisco, Philadelphia, Washington, Boston,
Detroit, Phoenix and Houston. This suggests that residents of
rural areas tend to report higher rates of depression.
Media use. Overall there were low but significant positive lin-
ear correlations between SRD and media consumption. In these
descriptive analyses, the three most consumed media were televi-
sion, on average 129 min per day per adult (18+), the internet,
on average 143 min per day, and social media, on average 83 min
perday.Thebivariateassociation(r)betweenSRDandtelevision
consumption was 0.089, surfing the internet was 0.089 and social
media was 0.063 (all p < 0.001).
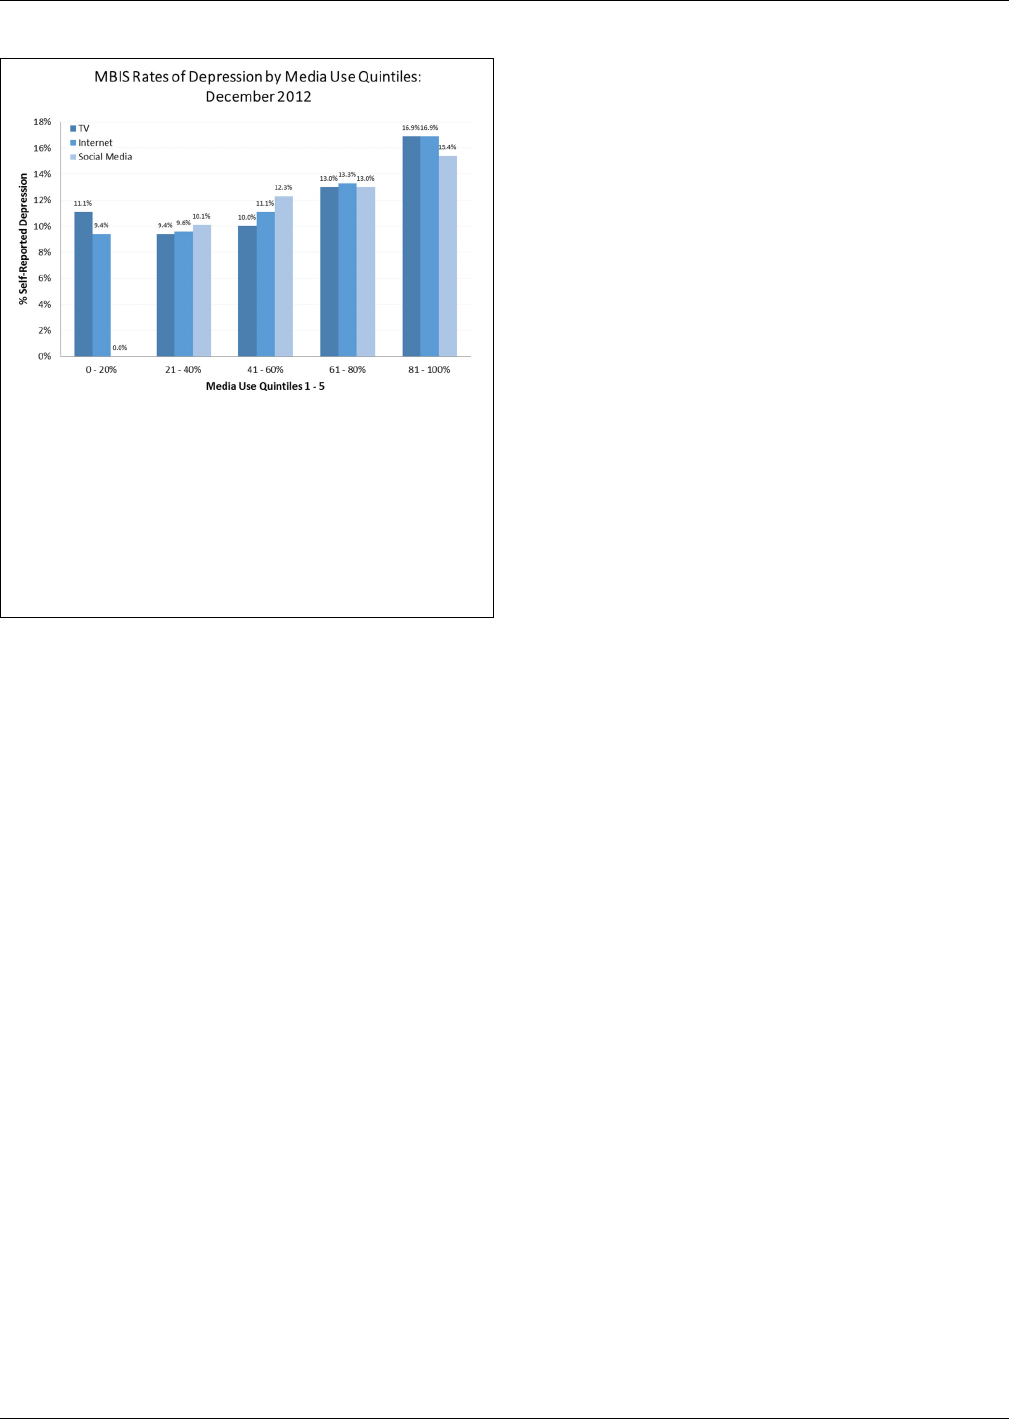
Media usage quintiles, a method commonly used in the media
industry, were created using the composite media usage variables
described above, and showed higher rates of depression among
the most active users of media. Figure 3 shows that for the h igh-
est 20% of telev ision users (quintile 5, 289 min per day) the SRD
rate was 16.9%. The SRD rate among the highest internet users
(327 min per day) was also 16.9%. SRD was slightly lower among
the highest social media users (279 min per day) at 15.4%. The
patterns among all three media categories were the same: higher
consumption of any form of media was associated with higher
rates of reported depression.
It should be noted that there was some co-linearity between the
three media categories. The correlation of television and internet
consumption was moderate at 0.495, slightly higher for inter-
net and social media at 0.510, but lower for television and social
media at 0.247. All of these correlations were significant (p <
0.001), raising the possibility of simultaneous consumption.
CHAID TREE ANALYSIS
The analyses reported above were limited to bivariate correla-
tions. To better understand how multiple variables for media
consumption and other demographics/activities related to SRD,
a multivariate segmentation scheme was employed based on
recursive partitioning (Morgan and Sonquist, 1963; Friedman,
1977; Breiman et al., 1984; Gordon and Olshen, 1984; Quinlan,
1986; Mingers, 1989). The first CHAID tree (Kass, 1980; Biggs
et al., 1991)(Figure 4) shows the interaction among the predictor
Frontiers in Human Neuroscience www.frontiersin.org September 2014 | Volume 8 | Article 712
|
11
Block et al. The relationship between self-report of depression and media usage
FIGURE 2 | Trends in MBIS Rates of Self-Reported Depression in
Adults (18+), June 2009–December 2012. This chart reports the rate
of self-reported depression every 6 months, beginning in June 2009
and ending in December 2012, fitted with a linear trend line. All data
was collected the same way by BIGinsight of Ohio as part of the
MBIS study.
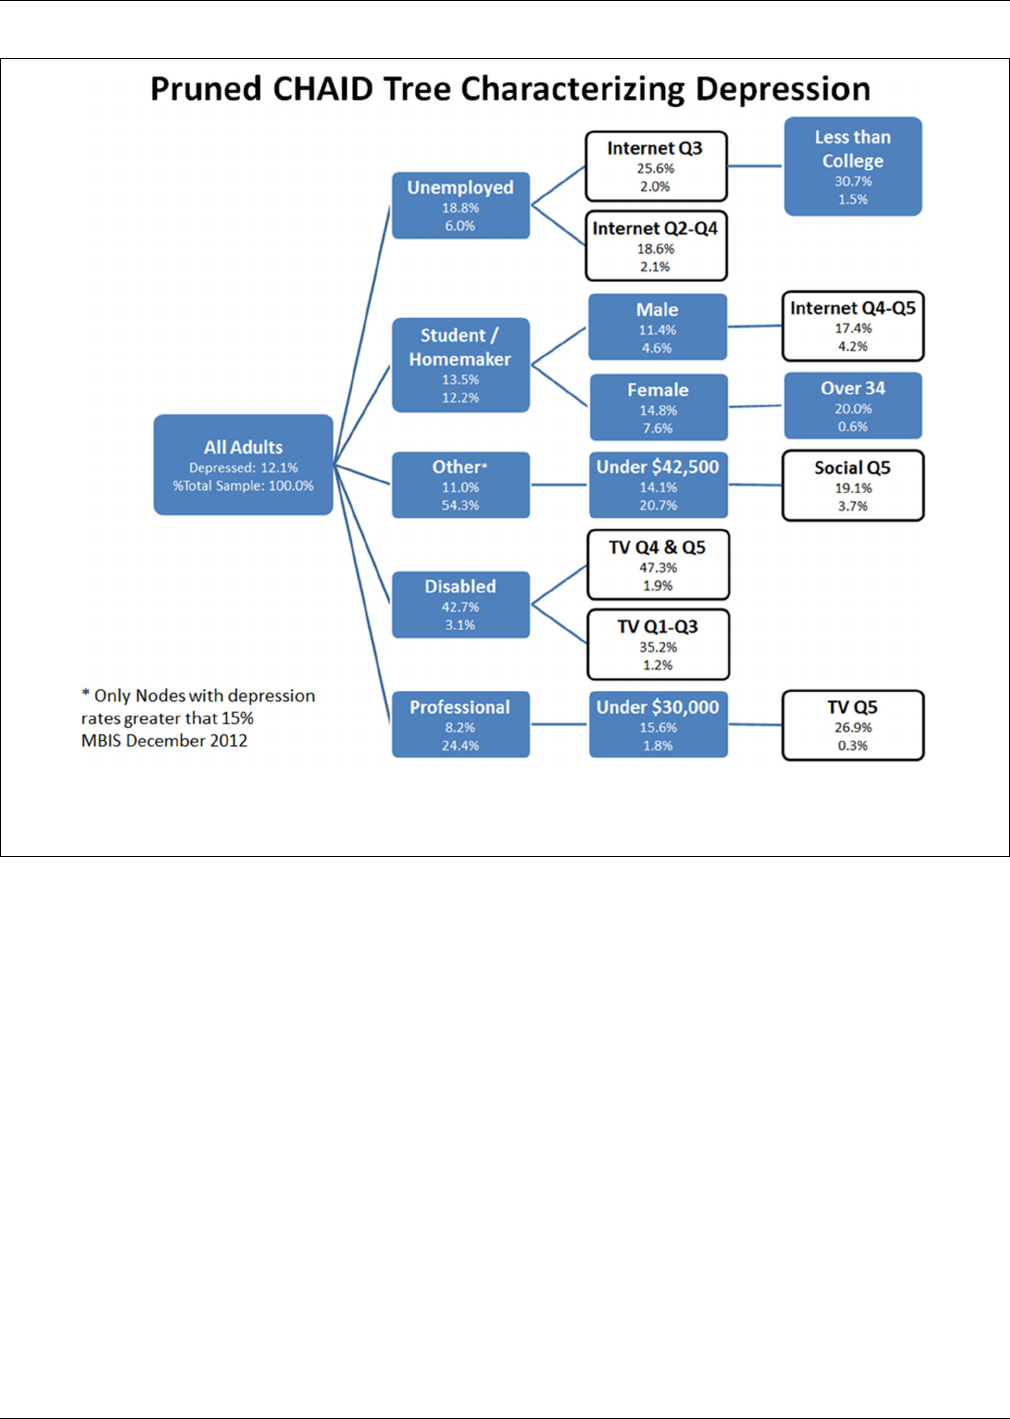
variables on the rate of SRD (the target variable). The second
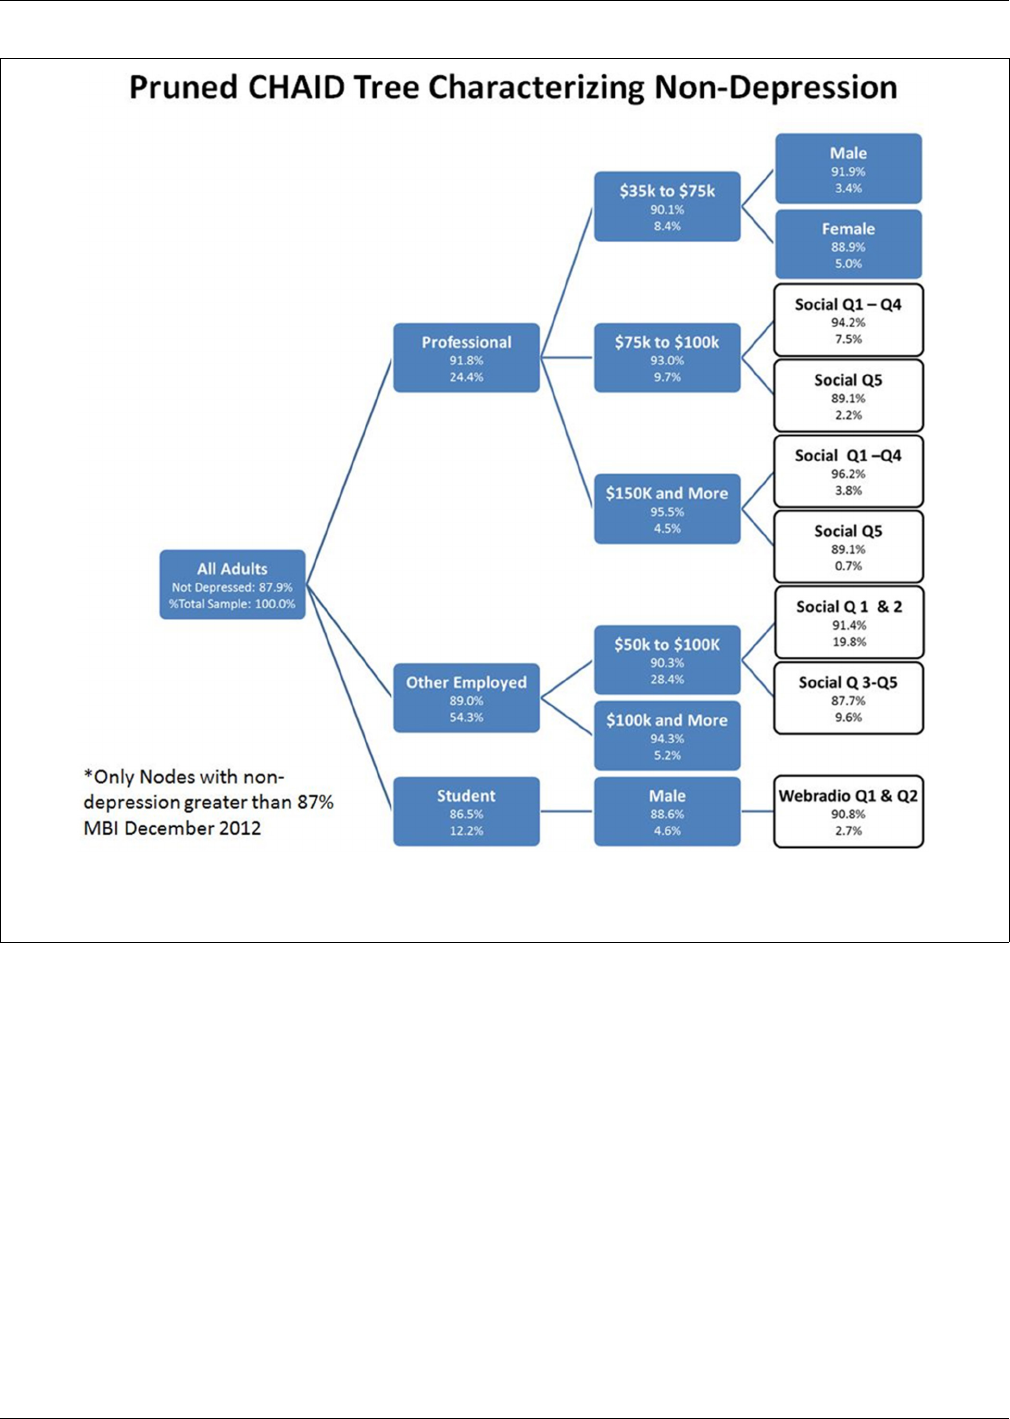
CHAID tree (Figure 5) shows the interaction among the predic-
tor variables and those who did not self-report being depressed.
The first analysis on depressed individuals generated 22 terminal
nodes, while the second on non-depressed subjects generated 21.
The trees (Figures 4, 5) were pruned to include only 8 and 10
terminal nodes where the depression rate was 15% or more and
the non-depression rate was 87% or higher, respectively. The tree
nodes showed the variable used to create the node, the depression
rate, and the percent of all adults that the node represented. In
Figure 4, those that were unemployed, for example, were 6.0% of
the sample and reported a depression rate of 18.8%. Note that
media-related nodes were shown in white and other variables
shown in blue/gray.
In the analysis of SRD subjects, the CHAID tree segments
(Figure 4) that were the basis for understanding the relation-
ship of depression to media and other variables were as follows.
In general, factors such as disability, unemployment and lower
incomes were associated with higher rates of SRD. Media con-
sumption tended to significantly leverage the rate attributable to
these characteristics. Six nodes of interest are briefly described.
The node with the highest depression rate (47.3%) was being dis-
abled(1)andinthetoptwoTVconsumptionquintiles.Thiswas
compared to being disabled and in the bottom three TV quin-
tiles w ith a somewhat lower depression rate (35.2%). The next
highest depression node (30.7%) consisted of (2) those who were
unemployed, in the top internet quintile, and had less than a col-
lege education. Those in a professional or managerial occupation
that made $30,000 or less, and were in the highest TV quintile
(3), reported a depression rate of 26.9%. (4) Female students or
homemakers older than 34, reported a 20.0% depression rate.
(5) Those in other occupations, including workers, sales, military
and retired, that make less than $42,500 and were in the high-
est social media quintile, reported a depression rate of 19.1%.
(6) Male students or homemakers in the highest two internet
quintiles reported a depression rate of 17.4%.
In the analysis of non-depressed individuals (non-SRD), the
CHAID tree segments (Figure 5)thatbestexplainedtherelation-
ships between media use, demographic variables, and non-SRD,
described ten nodes. The node with the highest non-depression
rate (96.2%) was being professional (1) with a salary of $150,000
and more in the lowest social media quintiles. This was com-
pared to being professional (2) with a salary of $150,000 and
more in the highest social media quintile (89.1%). The next
highest non-depression node (3) consisted of those in other occu-
pations, including workers, sales, military and retired, making
$100,000 and more (94.3%). This was contrasted with (4) those in
other occupations making $50,000 to $100,000 and in the lowest
social media quintiles (91.4%), and (5) those in other occupa-
tions making $50,000 to $100,000 and in the highest social media
quintiles (87.7%). Those who were professional making $75,000
to $100,000 and in the lowest social media quintile had a non-
depression rate of 94.2% (6), whereas those who were professional
making $75,000 to $100,000 and in the highest social media quin-
tile had a non-depression rate of 89.1% (7). Professionals making
$35,000 to $75,000 and male gender (8) were higher (91.9%) than
those professionals making $35,000 to $75,000 and female gender
(9).Lastly,studentswhoweremaleinthelowestweb-radioquin-
tile (10) had a non-depression rate of 90.8%. In general, being a
student or employed with a high income were most closely associ-
ated with not being depressed, particularly when combined with
varying levels of social media use.
Frontiers in Human Neuroscience www.frontiersin.org September 2014 | Volume 8 | Article 712
|
12

Block et al. The relationship between self-report of depression and media usage
Table 1 | Depression by demographics, December 2012.
% All adults Adults with Index
depression
Age (average years)* 45.443.896.3
Male 48.311.897.5
Female 51.712.3 101.7
Income (000)* 62.849.078.0
Have children 29.130.2103.9
Live in top 10 MSA 24.710.082.6
Married 42.59.578.5
Living with unmarried partner 7.215.5128.1
Divorced or separated 10.215.4128.3
Widowed 3.012.4102.5
Single, never married 25.714.1116.5
Same sex union 0.522.2183.5
Have not graduated high
school
1.521.7179.3
Graduated high school 16.813.1108.3
Technical school or vocational
training
5.71
3.
8114.0
1–3 years of college (did not
graduate)
20.215.1124.8
Associates or professional
degree
8.913.2109.1
Bachelor’s degree 22.59.477.7
Post college study or degree 13.58.872.7
Business Owner 4.211.796.7
Professional/managerial 25.58.267.8
Salesperson 3.611.595.0
Factory worker/laborer/driver 3.39.679.3
Clerical or service worker 9.511.998.3
Homemaker 3.614.7121.5
Student, high school or
college
8.413.0107.4
Military 0.711.695.9
Retired 13.710.88
9.
3
Unemployed 5.518.8155.4
Disabled (unable to work) 2.042.7 352.9
Obsessive-compulsive
disorder (OCD)
2.19.8 458.1
Anxiety 12.954.8 425.8
Dyslexia 0.82.6 334.5
Fibromyalgia 2.37.4 327.5
Insomnia/difficulty sleeping 8.427.5 325.8
Restless leg syndrome(RLS) 4.111.6 279.8
Irritable Bowel Syndrome
(IBS)/crohn’s disease
2.46.3 262.6
Chronic bronchitis/COPD 2.97.3 252.5
Sleep apnea 6.616.4 248.2
Heartburn/indigestion 9.922.7 230.3
Headaches/migraines 14.029.6211.5
Back pain 21.542.71
9
8.4
Acid reflux 15.830.5192.9
Heart disease 3.25.9185.9
Hearing impairment 4.38.0184.6
(Continued)
Table 1 | Continued
% All adults Adults with Index
depression
Overweight 21.237.6177.1
Arthritis 15.527.3176.4
Asthma 9.717.0174.8
Vision impairment 15.024.8165.2
Enlarged prostate/Benign
Prostatic Hyperplasia (BPH)
2.23.6162.6
Diabetes 9.315.0162.1
Osteoporosis 2.54.1161.6
High cholesterol 18.829.3155.9
Black 18.08.771.9
Asian 3.07.965.3
Multi 0.816.9139.7
Native 0.415.5128.1
White 58.413.6112.4
Other 0.59.981.8
Hispanic 18.91
0.
990.1
The three columns of numeric values represent (i) the percentage of all adults
in the survey with the given attribute (excepting income and age, which lists
the survey mean), (ii) the percentage of subjects having the given attribute that
self-reported depression, and (iii) the index of the given attribute as it relates to
depression, which is calculated as the percentage of those depressed, divided
by the total number depressed multiplied by 100. Rows on the left of the table
are clustered around demographics, relationship status, education, and work
identification. Rows on the right are clustered by illnesses separate from depres-
sion, and with race/ethnicity (Note: These do not follow NIH definitions of race
and ethnicity).
It is important to note that the CHAID analysis with non-
SRD did not replicate the analysis with SRD. Furthermore, there
was a segmentation observed between these analyses which was
distinct, in that the types of media use that segmented the SRD
subjects was not the same as that which segmented the non-SRD
subjects. The terminal nodes of the two analyses were different
along dimensions of occupation, income, and media use.
DISCRIMINANT ANALYSIS
The results of the discriminant analysis revealed that, other
than disability and income, the three single best predictors of
depression in this model were increased use of television, the
internet, and social media (Tabl e 2 ). The overall Chi-squared
test of the discriminant model was significant (Wilk’s λ = 0.945,
Chi-square = 922.117, df = 9, Canonical correlation = 0.235,
p < 0.001). The st ructure matrix demonstrated the weights of the
discriminating variables, an indication of their importance for
predicting depression: being disabled (0.760), income (−0.519),
internet consumption (0.399), television consumption (0.368),
social media use (0.278), level of education ( −0.255), being
unemployed (0.223), age (−0.170), top 10 MSA (−0.142), female
gender (0.062), and having children (0.010).
DISCUSSION
The primary finding of this study is that those who tend to
use more media in general, also tend to have more self-reports
Frontiers in Human Neuroscience www.frontiersin.org September 2014 | Volume 8 | Article 712
|
13
Block et al. The relationship between self-report of depression and media usage
FIGURE 3 | MBIS Rates of Depression by Media Use Quintiles,
December 2012. This chart demonstrates the percent of subjects with
depression in each media quintile. Quintiles were determined by ordering
subjects based on estimated minutes of a given media consumed; the first
1/5 used the least of a given media and comprised the 0–20% quintile, the
second fifth used more than the first 1/5 (but less than the third 1/5) and
comprised the 21–40% quintile, and so on. Quintiles were computed for
each type of media use of interest and graphed side by side. The graph
depicts a clear trend associating increased media usage with increased
rates of depression.
of depression. We found a current incidence of SRD at 12.1%
which is slightly less than reports of lifetime clinical depression
and more than the 12 month incidence of diagnoses of major
depression. However, the picture is far more nuanced than sim-
ple description of descriptive statistics and bivariate correlations
between media use and depression. For instance, the CHAID tree
analysis with SRD subjects (along with the discriminant anal-
ysis) shows that those who have suffered either economic or
physical life setbacks are orders of magnitude more likely to be
depressed, even without disproportionately high levels of media
use (37.2%). However, among those that have suffered major life
setbacks, hig h media users—particularly television watchers—
were even more likely to report experiencing depression (47.3%
in the highest two quintiles, as compared with 35.2% in the
lower three quintiles), which suggests that these effects were not
just due to individuals having more time for media consump-
tion. These effects were not observed with the control analysis
in non-SRD subjects. That the economically disadvantaged are
significantly more likely to experience depression is well sup-
ported by research in social psychology, which suggests that
lower-income groups feel a sense of disempowerment (Henry,
2005; Stephens et al., 2007). The lack of financial and temporal
resources they experience can lead to feelings of a lack of control
over one’s life and an inability to act efficaciously in the world,
which is thought to be a basic human need. Support ing this inter-
pretation, the CHAID analysis of the non-SRD subjects showed
that high earners that use less social media tend to be significantly
less depressed.
Life challenges may not be the only experiences related to
depression. As noted with our descriptive statistical analysis, per-
sistent environmental factors such as isolation can also contribute
to the prevalence of a psychological experience. Generally, isola-
tion is a known correlate of depression symptomology, and our
data suggest that residents of rural areas tend to report higher
rates of depression. Within the context of isolation, one can dis-
tinguish between physical and non-physical isolation; and within
non-physical isolation one can look at social and emotional iso-
lation. These various subclasses of isolation find ample support
in the literature. Weiss (1973) first distinguished the two types of
non-physical isolation—social and emotional—which have sub-
sequently been empirically shown as distinct (DiTommaso and
Spinner, 1997). Although conceptually distinct, the various typ es
of isolation interact. Physical isolation has been shown to affect
social and emotional isolation, especially for the elderly (Dugan
and Kivett, 1994) and adolescents (Brage et al., 1993). We mea-
sured social isolation through the proxy of living alone and
physical isolation through the proxy of place of residence, find-
ing that both correlate to rates of self-reported depression. For
instance, those living in more populated cities (top 10 MSAs) tend
to report lower rates of depression.
In addition to the current state of depression, the data we
analyzed reveals that SRD has been in a state of flux over the
past decade. At the beginning of this time frame, the rates we
observed were low compared to 2005 MBIS data where the
depressive r ate was reported to be 14.9%; a figure consistent with
a co-occurring 2005 study wherein a lifetime prevalence rate of
16.5% for major depressive disorder was reported (Kessler et al.,
2005a,b). Interestingly, the 2005 MBIS data and the Kessler et al.
(2005a,b) data show remarkable concordance despite differences
in inclusion criteria (exclusion of non-English speakers in the
Kessler et al., 2005a,b studies), the use of a structured clinical
interview vs. self-report data, and overall subject demographics.
This flux in reported incidence of depression over the past decade
is further supported by the MBIS data showing self-reported
depression has been on the rise in adults (18+) over the last 4
years in the United States.
It is worth considering the demographics of individuals (e.g.,
gender) reporting SRD in the context of a flux in depression rates
over time. As recently as 5 years ago, females were more likely to
report being depressed (i.e., SRD). However, in the most recent
MBIS study, the data shows SRD to be similarly associated with
both genders, with males reporting only a slightly lower rate of
depression. This is different than the rates reported by Primack
et al. (2009) where females were shown to be significantly more
likely to be depressed, as was also observed in the December 2005
MBIS data. In comparison to prior big data reports, there appears
to be a narrowing in the gap of reported depression in females and
males, which could potentially reflect a change in the likelihood of
genders to self-report. One factor that has remained constant was
that depression is inversely related to age, with those younger than
24 reporting the highest rate, and older mar ried persons reporting
the lowest.
There are several important limitations to this study that are
worth mentioning. First, the data used was self-reported depres-
sion, which does not necessarily reflect whether the subject has
ever received a clinical diagnosis of depression. The subjective
phenotypes of those who have a clinical diagnosis of major
depression versus those that self-report depression could skew
Frontiers in Human Neuroscience www.frontiersin.org September 2014 | Volume 8 | Article 712
|
14
Block et al. The relationship between self-report of depression and media usage
FIGURE 4 | Pruned CHAID Tree Characterizing SRD, December 2012. The
pruned CHAID tree shows groups of subjects wherein rates of depression
were greater than 15%. These nodes represent only a subset of all nodes
generated by the CHAID tree. Of particular interest for this paper are nodes
that are white (instead of blue); these nodes have been highlighted because
they are partially defined by the presence of a media use quintile.
the data in a number of different ways. For instance, it has been
observed that those who have been diagnosed with depression are
sometimes reticent to share their diagnosis. Alternatively, there is
a multiplicity of reasons to think that subjects without depression
may report being depressed. The balance of these considerations
leaves uncertainty in the true sample parameters, although the
percentage of subjects with SRD in this study was quite similar
to rates of depression found in previous studies.
Second, the variables computed for amount of television,
internet, and social media use are not direct measures. These
variables are composite variables computed from self-reports
of whether or not subjects used those various media during
discrete variable-hour-length blocks. This can introduce inter-
subject variability along a number of dimensions. For instance,
some subjects may report “yes” for one of the intervals based
on an hour’s worth of use, while others may respond the same
based on several hours’ worth of use. The probabilities computed
represent just that, a probability of time spent using a given media
relative to other subjects.
Third, the analyses done cannot speak to a causal relation-
ship between media consumption and depression, or to any
directionality between the observed associations. We think the
likeliest explanation is that these two variables form a com-
plex bi-directional relationship with autocatalytic properties. An
alternative explanation is that depression and increased media
use are a byproduct of a third confounding factor. It should also
be noted that the direction of causality between depression and
media use could also vary across individuals (i.e., whether media
usage helps to ameliorate depression or whether it contributes
to it). Whatever the exact relationship between depression and
increased media use, it is clear that the two are closely associated.
Fourth, it is important to acknowledge the potential con-
founds of concurrent medical illness on assessing associations
with SRD. In the literature on major depression, hypotheses
have been raised that depression in association with a med-
ical illness does not necessarily reflect the same structural
and functional circuitry alterations seen in depression with
strong familial heritability (e.g., see Cloninger, 2002; Breiter
Frontiers in Human Neuroscience www.frontiersin.org September 2014 | Volume 8 | Article 712
|
15
Block et al. The relationship between self-report of depression and media usage
FIGURE 5 | Pruned CHAID Tree Characterizing Non-SRD, December 2012.
The pruned CHAID tree shows groups of subjects wherein rates of
non-depression were greater than 87%. These nodes represent only a subset
of all nodes generated by the CHAID tree. Of particular interest for this paper
are nodes that are white (instead of blue); these nodes have been highlighted
because they are partially defined by the presence of a media use quintile.
and Gasic, 2004; Breiter et al., 2006). There is a strong pos-
sibility of biological subtypes in depression (e.g., see Blood
et al., 2010), meaning depression comorbid with other ill-
nesses may reflect a directionality with media that is distinct
from other putative depressive subtypes. Depression in associ-
ation with another medical (e.g., se vere coronary artery dis-
ease) or psychiatric condition (e.g., OCD, generalized anxiet y,
or body image disorders) may have a complex directional rela-
tionship with these other conditions, and there is published
evidence that TV viewing itself is associated with anxiety and
body image issues (e.g., see Thompson and Heinberg, 2002;
de Wit et al., 2011), potentially leading to the self-reported
depression. These issues also relate to the potential for drug
and alcohol to confound effects with SRD; this data set did
not contain such information, so future work is needed to
assess the relationship of drug and alcohol effects on SRD and
media use.
This information can help to form hypotheses to test in future
studies of relevance to psychology. One such hypothesis could
relate to the directionality of the relationship between SRD and
media, to determine if any media use acts as feedback to exacer-
bate symptoms. Another hypothesis might attempt to relate the
relationship to existing social psychological constructs such as the
“empty self ” hypothesis. Cushman (1990) developed the “empty
self” hypothesis to describe those who feel depressed and may be
likely to engage in impulsive or excessive consumption behavior
in order to “fill up” a perceived deficiency in the self (see also
Ahuvia, 2005). In the context of media usage, the “empty self”
might be expected to show increased consumption of media asso-
ciated with increased SRD; such behavior might be indicative of
a subtype of major depression. A third possibility, is a hypothesis
that increased media use by SRD subjects acts as indicator of the
illness, much like a biomarker. Such hypotheses point to further
opportunities for use of big data with psychological research.
Frontiers in Human Neuroscience www.frontiersin.org September 2014 | Volume 8 | Article 712
|
16

Block et al. The relationship between self-report of depression and media usage
Table 2 | Structure matrix of discriminant analysis predicting
depression, December 2012.
Canonical correlation 0.235 Chi-square 922.117
Wilk’s lambda 0.945 significance <0.001
Disabled 0.760
Income −0.519
Internet usage 0.399
TV usage 0.368
Social media usage 0.278
Education −0.255
Unemployed 0.223
Age −0.170
Living in top 10 MSA −0.142
Female 0.062
Having children 0.010
This table reports the structure matrix of the discriminant analysis. The nine pre-
dictive variables used in the discriminant analysis are reported in the left column,
while a measure of that variable’s predictive importance in the discriminant func-
tion is listed on the right. A variable’s importance is determined by its magnitude,
while its relationship to depression is determined by its valence. Negative num-
bers describe an inverse relationship: for example, higher income is predictive
of less depression.
In summary, the data reveal that there is a consistent pat-
tern of results that link self-reported depression with increased
media use, even when taking into account other variables, such
as disability and unemployment. This media use was focused
more on internet use and TV exposure, for those making self-
reports of depression. The rate of SRD was between two standard
indices used in published reports of clinically diagnosed major
depression, namely the lifetime prevalence, and recent 12 month
incidence of major depression. These observations suggest the
current findings with big data may have relevance to the literature
focused on the clinical diagnosis of depression.
SUPPLEMENTARY MATERIAL
The Supplementary Material for this article can be found
online at: http://www.frontiersin.org/HumanNeuroscience/10.
3389/fnhum.2014.00712/abstract
REFERENCES
Ahuvia, A. C. (2005). Beyond the extended self: loved objects and consumers’
identity narratives. J. Consum. Res. 32, 171–184. doi: 10.1086/429607
Biggs, D., De Ville, B., and Suen, E. (1991). A method of choosing multi-way
partitions for classification and decision trees. J. Appl. Stat. 18, 49–62. doi:
10.1080/02664769100000005
Blood, A. J., Iosifescu, D. V., Makris, N., Perlis, R. H., Kennedy, D. N., Dougherty,
D. D., et al. (2010). Phenotype genotype project on addiction and mood
disorders. Microstructural abnormalities in subcortical reward circuitry of
subjects with major depressive disorder. PLoS ONE 5:e13945. doi: 10.1371/jour-
nal.pone.0013945
Brage, D., Meredith, W., and Woodward, J. (1993). Correlates of loneliness among
midwestern adolescents. Adolescence 28, 685–693.
Breiman, L., Friedman, J. H., Olshen, R. A., and Stone, C. J. (1984). Classification
and Regression Trees. The Wadsworth statistics/probability series. New York, NY:
Chapman and Hall/CRC.
Breiter, H. C., and Gasic, G. P. A. (2004). “General circuitry of reward/aversion and
its implications for neuropsychiatric illness,” in The Cognitive Neurosciences,ed
M. Gazzaniga (Cambridge, MA: MIT Press), 1043–1065.
Breiter, H. C., Gasic, G. P., and Makris, N. (2006). “Imaging the neural systems
for motivated behavior and their dysfunction in neuropsychiatric illness,” in
Complex Systems Science in Biomedicine, eds T. S. Deisboeck, and J. Y. Kresh
(New York, NY: Springer Verlag), 763–810. doi: 10.1007/978-0-387-33532-2_33
Catalano, R., and Dooley, C. D. (1977). Economic predictors of depressed mood
and stressful life events in a metropolitan community. J. Health Soc. Behav. 18,
292–307.
Cloninger, C. R. (2002). The discovery of susceptibility genes for mental disorders.
Proc. Natl. Acad. Sci. U.S.A. 99, 13365–13367. doi: 10.1073/pnas.222532599
Cushman, P. (1990). Why the self is empty. Toward a historically situated psychol-
ogy.AmPsychol.45, 599–611. doi: 10.1037/0003-066X.45.5.599
de Wit, L., van Straten, A., Lamers, F., Cuijpers, P., and Penninx, B. (2011).
Are sedentary television watching and computer use behaviors associated
with anxiety and depressive disorders? Psychiatry Res.186, 239–243. doi:
10.1016/j.psychres.2010.07.003
DiTommaso, E., and Spinner, B. (1997). Social and emotional loneliness: a reex-
amination of Weiss’ typology of loneliness. Pers. Individ. Dif. 22, 417–427. doi:
10.1016/S0191-8869(96)00204-8
Dodds, P. S., Harris, K. D., Kloumann, I. M., Bliss, C. A., and Danforth, C. M.
(2011). Temporal patterns of happiness and information in a global social
network: hedonometrics and twitter. PLoS ONE 6:e26752. doi: 10.1371/jour-
nal.pone.0026752
Dugan, E., and Kivett, V. R. (1994). The importance of emotional and social isola-
tion to loneliness among very old rural adults. Gerontologist 34, 340–346. doi:
10.1093/geront/34.3.340
Friedman, J. H. (1977). A recursive partitioning decision rule for nonparametric
classification. IEEE Trans. Comput. 26, 404–407. doi: 10.1109/TC.1977.1674849
Gordon, L., and Olshen, R. A. (1984). Almost surely consistent nonparamet-
ric regression from recursive partitioning schemes. J. Multivariate Anal.15,
147–163. doi: 10.1016/0047-259X(84)90022-8
Henderson, A. S., Jorm, A. F., Korten, A. E., Jacomb, P., Christensen, H., and
Rodgers, B. (1998). Symptoms of depression and anxiety during adult life:
evidence for a decline in prevalence with age. Psychol. Med. 28, 1321–1328.
Henry, P. C. (2005). Social class, market situation, and consumers’ metaphors of
(dis)empowerment. J. Consum. Res. 31, 766–778. doi: 10.1086/426610
Jelenchick, L. A., Eickhoff, J. C., and Moreno, M. A. (2013). “Facebook depression?”
social networking site use and depression in older adolescents. J. Adolesc. Health.
52, 128–130. doi: 10.1016/j.jadohealth.2012.05.008
Kass, G. V. (1980). An exploratory technique for investigating large quantities of
categorical data. Appl. Stat. 29, 119–127. doi: 10.2307/2986296
Kessler, R. C., Berglund, P., Demler, O., Jin, R., Merikangas, K. R., and Walters,
E. E. (2005a). Lifetime prevalence and age-of-onset distributions of DSM-IV
disorders in the National Comorbidity Survey Replication. Arch.Gen.Psychiatry
62, 593–602. doi: 10.1001/archpsyc.62.6.593
Kessler, R. C., Chiu, W. T., Demler, O., Merikangas, K. R., and Walters, E. E.
(2005b). Prevalence, severity, and comorbidity of 12-month DSM-IV disor-
ders
in the National Comorbidity Survey Replication. Arch. Gen. Psychiatry 62,
617–627. doi: 10.1001/archpsyc.62.6.617
Kross, E., Verduyn, P., Demiralp, E., Park, J., Lee, D. S., Lin, N., et al. (2013).
Facebook use predicts declines in subjective well-being in young adults. PLoS
ONE 8:e69841. doi: 10.1371/journal.pone.0069841
Mingers, J. (1989). An empirical comparison of pruning methods for decisiontree
induction. Mach. Learn. 4, 227–243. doi: 10.1023/A:1022604100933
Morgan, J. N., and Sonquist, J. A. (1963). Problems in the analysis of
survey data and a proposal. J. Am. Stat. Assoc. 58, 415–434. doi:
10.1080/01621459.1963.10500855
Morgenstern, J., Naqvi, N. H., Debellis, R., and Breiter, H. C. (2013). The contri-
butions of cognitive neuroscience and neuroimaging to understanding mecha-
nisms of behavior change in addiction. Psychol. Addict. Behav. 27, 336–350. doi:
10.1037/a0032435
Orsal, O., Orsal, O., Unsal, A., and Ozlap, S. (2012). Evaluation of internet addiction
and depression among university students. Procedia Soc. Behav. Sci. 82, 445–454.
doi: 10.1016/j.sbspro.2013.06.291
Pantic, I., Damjanovic, A., Todorovic, J., Topalovic, D., Bojovic-Jovic, D., Ristic,
S., et al. (2012). Association between online social networking and depression
in high school students: behavioral physiology viewpoint. Psychiatr. Danub. 24,
90–93.
Primack, B. A., Swanier, B., Georgiopoulos, A. M., Land, S. R., and Fine, M.
J. (2009). Association between media use in adolescence and depression in
Frontiers in Human Neuroscience www.frontiersin.org September 2014 | Volume 8 | Article 712
|
17

Block et al. The relationship between self-report of depression and media usage
young adulthood: a longitudinal study. Arch. Gen. Psychiatry 66, 181–188. doi:
10.1001/archgenpsychiatry.2008.532
Quinlan, J. R. (1986). Induction of decision trees. Mach. Learn. 1, 81–106. doi:
10.1007/BF00116251
Stephens, N. M., Markus, H. R., and Townsend, S. S. (2007). Choice as an act
of meaning: the case of social class. J.Pers.Soc.Psychol.93, 814–830. doi:
10.1037/0022-3514.93.5.814
Thompson, J. K. and Heinberg, L. J. (2002). The media’s influence on body image
disturbance and eating disorders: we’ve reviled them, now can we rehabilitate
them? J. Soc. Issues 55, 339–353. doi: 10.1111/0022-4537.00119
Weiss, E. B. (1973). Marketing to the New Society. Chicago, IL: Crain
Communications.
Wilkowska-Chmielewska, J., Szelenberger, W., and Wojnar, M. (2013).
Age-dependent symptomatology of depression in hospitalized patients
and its implications for DSM-5. J. Affect. Disord. 150, 142–145. doi:
10.1016/j.jad.2012.12.012
Zhang, H. P., and Singer, B. (1999). Recursive Partitioning in the Health Sciences.
New York, NY: Springer. doi: 10.1007/978-1-4757-3027-2
Conflict of Interest Statement: The authors declare that the research was con-
ducted in the absence of any commercial or financial relationships that could be
construed as a potential conflict of interest.
Received: 17 April 2014; accepted: 26 August 2014; published online: 12 September
2014.
Citation: Block M, Stern DB, Raman K, Lee S, Carey J, Humphreys AA, Mulhern F,
Calder B, Schultz D, Rudick CN, Blood AJ and Breiter HC (2014) The relationship
between self-report of depression and media usage. Front. Hum. Neurosci. 8:712. doi:
10.3389/fnhum.2014.00712
This article was submitted to the journal Frontiers in Human Neuroscience.
Copyright © 2014 Block, Stern, Raman, Lee, Carey, Humphreys, Mulhern, Calder,
Schultz, Rudick, Blood and Breiter. This is an open-access ar ticle distributed under the
terms of the Creative Commons Attribution License (CC BY). The use, distribution or
reproduction in other forums is permitted, provided the original author(s) or licensor
are credited and that the original publication in this journal is cited, in accordance with
accepted academic practice. No use, distribution or reproduction is per mitted which
does not comply with these terms.
Frontiers in Human Neuroscience www.frontiersin.org September 2014 | Volume 8 | Article 712
|
18

REVIEW ARTICLE
published: 04 March 2014
doi: 10.3389/fnhum.2014.00114
Antagonistic neural networks underlying differentiated
leadership roles
Richard E. Boyatzis
1,2
*, Kylie Rochford
2
and Anthony I. Jack
1
1
Department of Cognitive Science, Case Western Reserve University, Cleveland, OH, USA
2
Department of Organizational Behavior, Case Western Reserve University, Cleveland, OH, USA
Edited by:
Carl Senior, Aston University, UK
Reviewed by:
Carl Senior, Aston University, UK
Sven Braeutigam, Oxford Centre for
Human Brain Activity, University of
Oxford, UK
*Correspondence:
Richard E. Boyatzis, Department of
Organizational Behavior, Case
Western Reserve University, 10900
Euclid Avenue, Cleveland, OH 44106,
USA
e-mail: richard.boyatzis@case.edu
The emergence of two distinct leadership roles, the task leader and the socio-emotional
leader, has been documented in the leadership literature since the 1950s. Recent research
in neuroscience suggests that the division between task-oriented and socio-emotional-
oriented roles derives from a fundamental feature of our neurobiology: an antagonistic
relationship between two large-scale cortical networks – the t ask-positive network (TPN)
and the default mode network (DMN). Neural activity in TPN tends to inhibit activity in
the DMN, and vice versa. The TPN is important for problem solving, focusing of attention,
making decisions, and control of action. The DMN plays a central role in emotional self-
awareness, social cognition, and ethical decision making. It is also strongly linked to
creativity and openness to new ideas. Because activation of the TPN tends to suppress
activity in the DMN, an over-emphasis on task-oriented leadership may prove deleterious to
social and emotional aspects of leadership. Similarly, an overemphasis on the DMN would
result in difficulty focusing attention, making decisions, and solving known problems. In
this paper, we will review major streams of theory and research on leadership roles in the
context of recent findings from neuroscience and psychology. We conclude by suggesting
that emerging research challenges the assumption that role differentiation is both natural
and necessary, in particular when openness to new ideas, people, emotions, and ethical
concerns are important to success.
Keywords: leadership, roles, neural networks and behavior, DMN,TPN, anti-correlated networks, opposing domains
hypothesis
INTRODUCTION
The emergence of two distinct leadership roles, the task leader and
the socio-emotional leader, has been documented in the leadership
literature since the 1950s (Bales, 1958). The separation of these
roles has been seen as pragmatic in applications and is accepted
as a finding in behavioral research. However, in practical applica-
tions, it leaves an organization with a challenge that can detract
from leadership development, succession planning, and organi-
zational flexibility. In this article, we will show that the division
between these two types of leadership roles lies far deeper than has
traditionally been thought. Recent research in neuroscience sug-
gests that the division between task-oriented and socio-emotional
leadership roles derives from a fundamental feature of our neu-
robiology: an antagonistic relationship between two large-scale
cortical networks that is present in every individual.
Neural activity in the task-positive network (TPN) tends to
inhibit activity in the default mode network (DMN; Raichle et al.,
2001; Fransson, 2005; Raichle and Snyder, 2007; Buckner et al.,
2008), and vice versa (Uddin et al., 2009; Jack et al., 2012). The
TPN is activated during a broad range of non-social tasks (Fox
et al., 2005; Buckner et al., 2008; Uddin et al., 2009; Andrews-
Hanna, 2012), and is thought to be important for problem solving,
focusing of attention, making decisions, and control of action –
in other words for getting things done. However, activation of the
TPN also has a deleterious effect on other cognitive functions that
are essential to leadership: it suppresses activity in the DMN.
The DMN plays a central role in emotional self-awareness
(Ochsner et al., 2005; Schilbach et al., 2008), social cognition
(Schilbach et al., 2008; Jack et al., 2012; Mars et al., 2012), and
ethical decision making (Koenigs et al., 2007; Bzdok et al., 2012;
Jack et al., in press). It is also strongly linked to creativity and
insightful problem solving (Subramaniam et al., 2009; Takeuchi
et al., 2011). The antagonistic relationship between the TPN
and DMN creates a fundamental neural constraint on cogni-
tion that is highly relevant to the different roles and capabilities
that effective leaders must astutely juggle and deploy. An impor-
tant consequence of this constraint is that an over-emphasis on
task-oriented leadership can prove deleterious to an organiza-
tion: in particular when openness to new ideas, people, emotions,
and ethical concerns are important to success. On the other
hand, the over emphasis on relationship oriented leadership may
prove deleterious to focus and the execution of clearly defined
goals.
We are not the first to note the striking correspondence between
the functions of brain networks and leadership. In a recent book,
social neuroscientist Matthew Lieberman distinguishes between
the social brain and the business brain and doesnote the antagonis-
tic relationship between the TPN and the DMN (Lieberman, 2013,
p. 257). In this paper, we extend Lieberman’s preliminary work by
providing a more nuanced account of the antagonistic relationship
between the TPN and the DMN and their corresponding task and
relationship leadership roles. We then extend Lieberman’s work by
Frontiers in Human Neuroscience www.frontiersin.org March 2014
|
Volume 8
|
Article 114
|
19

Boyatzis et al. Leadership roles and opposing domains
theorizing strategies that will allow leaders to effectively navigate
this fundamental cognitive constraint.
OPPOSING NEURAL DOMAINS
When discussing the functional anatomy of the brain, it is
important to appreciate that the literature is less clear than is
often acknowledged. The cognitive characterization of the ten-
sion between the DMN and the TPN that guides this inquiry is
different in important respects from the view that is frequently
stated as accepted and uncontroversial (including in the context
of leadership, e.g., Waytz and Mason, 2013). Nonetheless, as we
will briefly review, the characterization we offer is better sup-
ported by the scientific evidence. A number of inconsistencies
in the literature facilitate misunderstanding and over-confidence:
first, anatomical labels are not always used consistently and some-
times fail to distinguish areas which careful evidence reveals have
quite distinct functional roles (Kubit and Jack, 2013). Second,
researchers working with different types of cognitive tasks often
form quite different views about the primary functional role
of a region or a set of regions (i.e., a network). In particular,
it is now well acknowledged that researchers have not always
been careful to critically evaluate the evidence supporting their
inferences about the functional role of brain areas, and some-
times fail to consider evidence about function that derives from
a broader view of the literature (Henson, 2006; Poldrack, 2011).
Third, networks can be defined according to a number of different
criteria.
The issue of how networks can be defined is important to clar-
ify for our purposes. Networks of regions are most often defined
(and g iven a label denoting a provisional functional role) either
because: (1) they are frequently found to be activated by a class
of cognitive tasks (Corbetta et al., 1998; Duncan and Owen, 2000;
Van Overwalle, 2009); or (2) the regions demonstrate strong posi-
tive resting state connectivity w ith each othe r – a finding which is
commonly interpreted as indicating a deg ree of functional coher-
ence amongst the regions in the network (Fox et al., 2005; Cohen
et al., 2008; Vincent et al., 2008; Van Dijk et al., 2010; Yeo et al.,
2011). These two criteria are thought to be complementary and
broadly consistent with each other, although they do not always
yield identical results (Laird et al., 2013).
A third quite different principle that can be used to define a
network is through the tendency of a set of regions to be deac-
tivated (i.e., less active than when the participant is at rest) by
a class of cognitive tasks (Shulman et al., 1997b). This is how
the DMN was originally defined (Raichle et al., 2001). Regions
involved in the DMN have also be defined: (a) on the basis of pos-
itive resting connectivity between regions in the network, and (b)
on the basis of negative correlation (“anti-correlation”) with other
regions as revealed by resting functional connectivity. These three
ways of defining the DMN (deactivation, positive correlation, and
anti-correlation) are broadly consistent and regarded as comple-
mentary (Fox et al., 2005; Raichle and Snyder, 2007; Buckner et al.,
2008; Uddin et al., 2009; Andrews-Hanna, 2012).
The definition we take as primary for both the DMN and the
TPN is their anti-correlation. This follows the original definition
of these networks (Fox et al., 2005). An illustration of the two
networks, defined in this way, can be seen in Figure 1. Figure 1
also illustrates a recent state-of-the-art division of the entire cor-
tex into seven networks based on functional coupling between
regions, i.e., positive resting connectivity (Yeo et al., 2011). The
mapping between Yeo et al.’s (2011) positive connectivity maps
and the anti-correlated networks is illustrated in greater detail in
Figures 2 and 3, for the DMN and TPN, respectively. This reveals
the need for some revision of early characterizations of the anti-
correlated networks. The broad characterization of the DMN has
remained quite stable, and is reasonably consistent using positive
and negative correlation criteria (Figure 2). However, this is not
the case for the TPN (Figure 3). It was originally thought (Fox
et al., 2005) that the DMN was anti-correlated primarily with the
dorsal attention network (Corbetta et al., 1998). However, sub-
sequent work using more data-driven methods (Fox et al., 2005;
Chang and Glover, 2009; Chai et al., 2012; Jack et al., 2012) has
revealed that the TPN overlaps par ts of both the dorsal atten-
tion network and the fronto-parietal control network (Vincent
et al., 2008
). Figur
e 3 also illust
rates clear overlap between the
TPN and the resting state network which Yeo et al. (2011) identify
with the ventral attention network (Fox et al., 2006). The ven-
tral attention network is recruited during a var iety of demanding
attention tasks, however, its precise functional characterization
is still subject to debate. It has been characterized as involved
primarily in the reorienting of attention, however, more recent
analysis suggests that the network as identified by Yeo et al. (2011)
can be better characterized as being involved in detecting and
responding to task-relevant stimuli (Kubit and Jack, 2013). Hence,
particularly for the TPN, it is important to note there is inconsis-
tency between the criteria for defining networks. It appears that
DMN is in tension with a set of regions (i.e., the TPN) that lie
within a number of different cortical networks that can be dis-
tinguished and defined by distinct profiles of positive functional
coupling.
THE DEFAULT MODE NETWORK
Until quite recently, the function of the DMN was regarded as
largely mysterious. In a comprehensive review, Buckner et al.
(2008) noted that “a unique challenge for understanding the func-
tions of the brain’s default network is that the system is most
active in passive settings and during tasks that direct attention
away from external stimuli.” While these and other researchers
acknowledged the difficulty in definitively identifying a function
for the DMN, nonetheless a consensus view began to emerge: that
the tension between the TPN and DMN could be best explained by
a distinction between two kinds of attention, namely externally vs.
internally directed cognitive processing. T his view was encouraged
by some influential early work (Gusnard et al., 2001), by the mis-
taken view that the DMN was anti-correlated with regions whose
primary function was external attention (Fox et al., 2005), and by
the paucity of evidence that any externally oriented task could pro-
duce activation of the DMN above resting le vels (but see Iacoboni
et al., 2004).
It is clear that the DMN is reliably engaged by some tasks that
involve attention to internal stimuli. Notable examples include:
autobiographical recall and prospection (imagining future events;
Buckner and Carroll, 2007; Spreng et al., 2009; Spreng and Grady,
2010), self-related processing (Mitchell et al., 2006), and emotion
Frontiers in Human Neuroscience www.frontiersin.org March 2014
|
Volume 8
|
Article 114
|
20
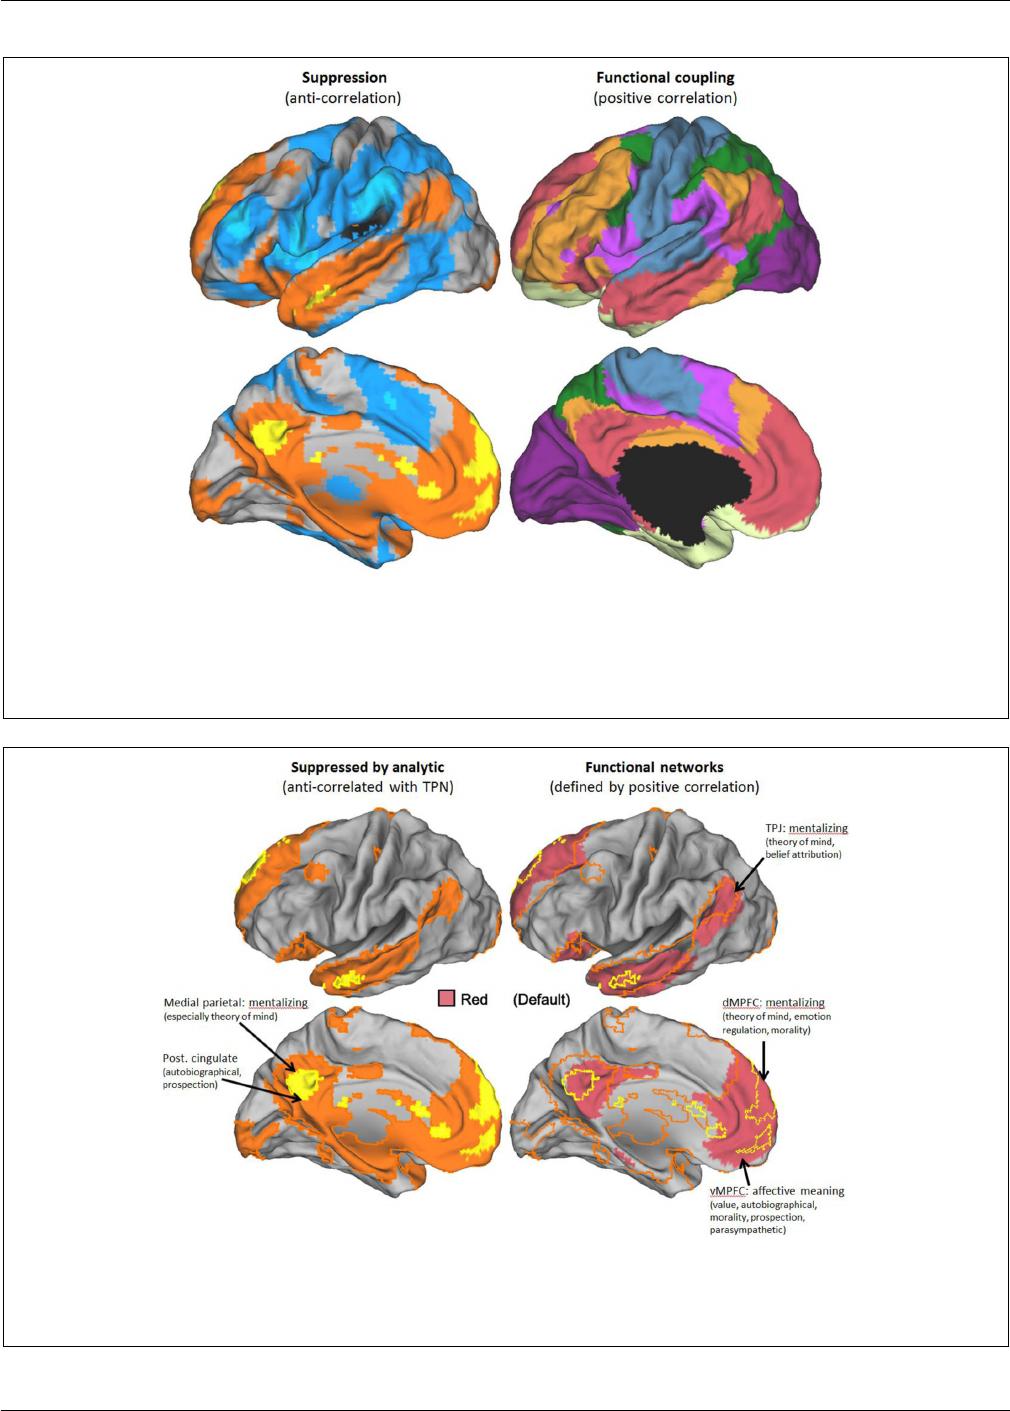
Boyatzis et al. Leadership roles and opposing domains
FIGURE 1
|
Different criteria for defining brain networks. Functional
networks shown on the left hemisphere of the PALS atlas (top – lateral
view above, bottom – medial view). Left panels show anti-correlated
networks derived from resting state data. The TPN is shown in blue, the
DMN in orange/yellow. Darker colors correspond to anti-correlated
networks using a global (whole brain) regressor, brighter colors without a
global regressor (i.e., most strongly anticorrelated areas). Maps derived
from data and methods described in Jack et al. (2012). Right panels show
the seven network stable solution derived by Yeo et al. (2011) on the basis
of positive correlations in resting state data. Area shown in black
corresponds to a cross-section through sub-cortical structures, not
mapped by Yeo et al. (2011).
FIGURE 2
|
The default mode network (DMN). Strong overlap in the DMN
representation based on anti-correlations and positive correlations in resting
state data. Left panels show just the DMN derived from anti-correlations in
orange/yellow. Right panels show networks derived by Yeo et al. (2011) with
substantial overlap. Borders of anti-correlated regions are carried over from
the left panels. Key to Yeo et al. (2011) networks is shown in the middle of the
figure. Labels denote best current understanding of the primary functions of
key parts of the DMN.
Frontiers in Human Neuroscience www.frontiersin.org March 2014
|
Volume 8
|
Article 114
|
21
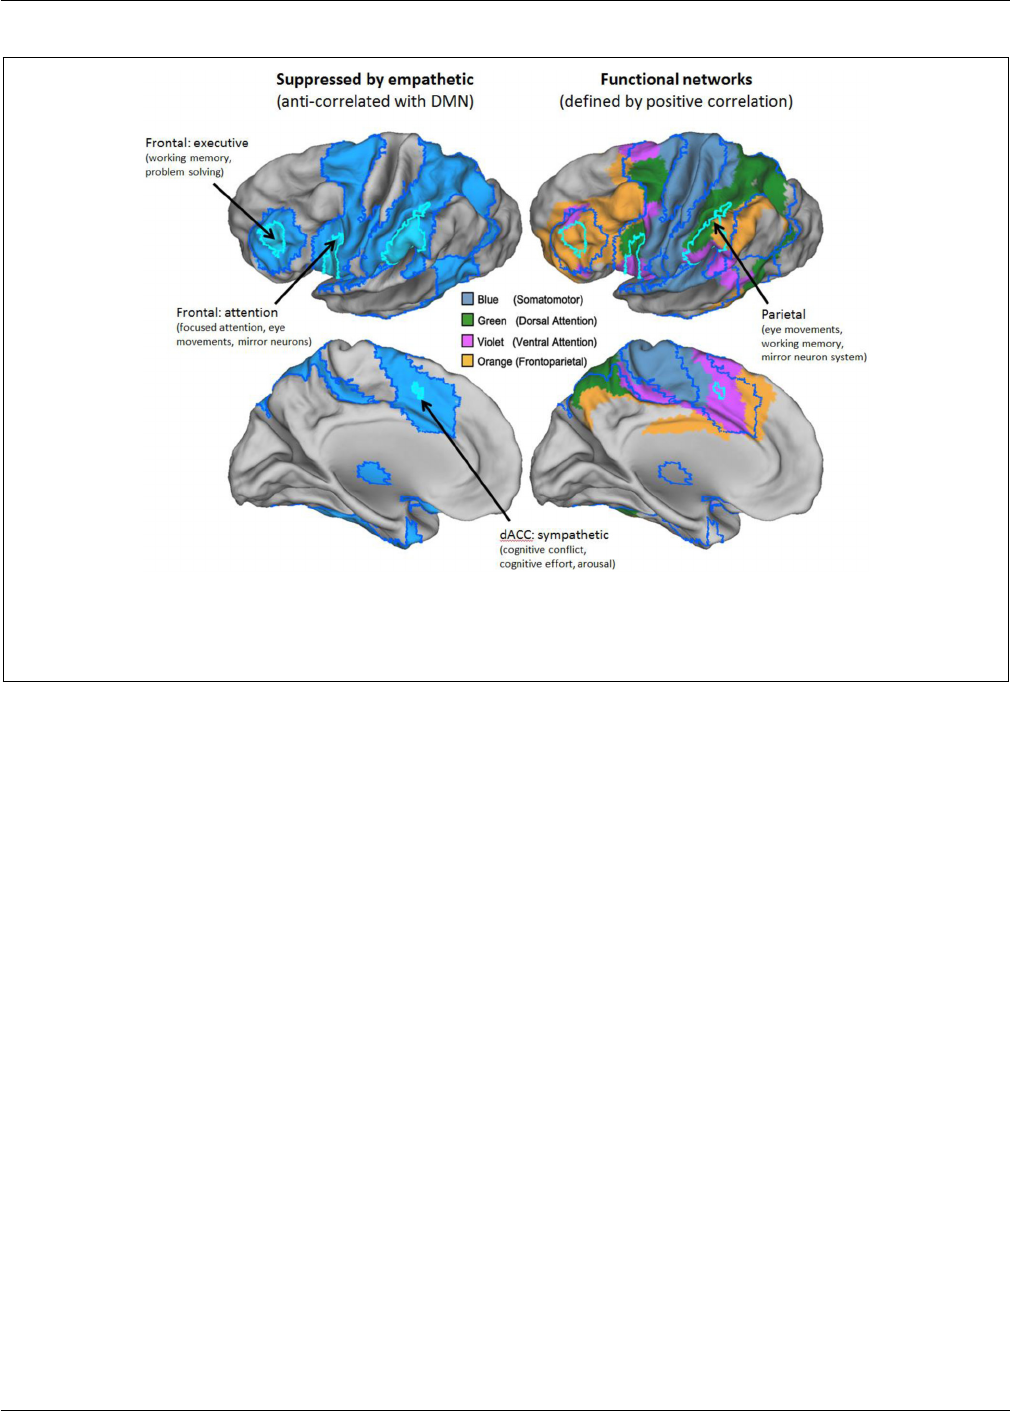
Boyatzis et al. Leadership roles and opposing domains
FIGURE 3
|
The task-positive network (TPN). The TPN represent ation based
on anti-correlations corresponds to multiple networks defined by positive
correlations. Left panels show just the TPN derived from anti-correlations in
blue. Right panels show networks derived by Yeo et al. (2011) with subst antial
overlap. Borders of anti-correlated regions are carried over from the left
panels. Key to Yeo et al. (2011) networks is shown in the middle of the figure.
Labels denote best current understanding of the primary functions of key
parts of the TPN.
self-regulation (Ochsner et al., 2005). However, the characteriza-
tion of the DMN as being primarily involved in internal processing
glosses over other highly reliable findings which associate DMN
activation with externally oriented tasks. These types of externally
oriented tasks fall into two broad categories, which correspond to
a fractionation of the DMN which can be observed both through
meta-analysis of activation findings (Andrews-Hanna et al., 2010)
and by resting connectivity analysis (Uddin et al., 2009). More
dorsal parts of the midline structures of the DMN, medial parietal
and dorsal medial prefrontal cortex (dmPFC) are reliably associ-
ated with thinking about the mental states of others, including
both their emotional and cognitive (e.g., belief) states (Amodio
and Frith, 2006; Schilbach et al., 2008; Van Overwalle, 2009).
In contrast, ventral medial prefrontal cortex (vmPFC) is associ-
ated with representing the value of external objects (Grabenhorst
and Rolls, 2011). Moral decision making tasks, which are again
predominantly external in focus, are associated with activity in
both dorsal and ventral parts of the DMN (Greene et al., 2004;
Bzdok et al., 2012; Koenigs et al., 2012; Jack, in press). Since these
findings appear to be inconsistent with the commonly held view
that the tension between the TPN and DMN reflects a tension
between external and internal attention, we will temporarily set
aside that view and return to it in a later section. Instead, the
characterization of the DMN we offer here will be guided by
a broad view of tasks that are positively associated with DMN
engagement.
The DMN may be seen as having two primary circuits. The
first is the dorsal portions of the midline structures and the right
temporo-parietal junction (rTPJ), which are most clearly asso-
ciated w ith mentalizing, that is, thinking about our own and
other’s mental states (Ochsner et al., 2005; Amodio and Frith,
2006; Schilbach et al., 2008; Van Overwalle, 2009). It is impor-
tant to note that the anatomy of this mentalizing circuit is distinct
from other regions that make distinct contributions to social
cognition. These include: a set of regions primarily involved in
perceptual processing of social stimuli such as faces and bodies
(Wiggett et al., 2009) and the mirror neuron network, which is
involved in both executing and observing actions, and thought to
underlie our ability to mimic the actions of others. In contrast,
the mentalizing system is thought to be involved not in emo-
tional contagion, but in the cognitive representation of emotion
(Lindquist et al., 2012).
The second of the primary DMN circuits is the more ven-
tral portions of the midline structures, which are associated w ith
self-related processing, autobiographical memory and prospec-
tion, cognitive representation of emotion, representation of
value/reward, emotion self-regulation, and autonomic process-
ing. We endorse the characterization of these processes offered
byarecentreview(Roy et al., 2012), which concludes: “The
vmPFC is not necessary for affective responses per se, but is
critical when affective responses are shaped by conceptual infor-
mation about specific outcomes. The vmPFC thus functions as
a hub that links concepts with brainstem systems capable of
coordinating organism-wide emotional behavior, a process we
describe in terms of the generation of affective meaning.” The
severe consequence of poor function in this circuit has long
Frontiers in Human Neuroscience www.frontiersin.org March 2014
|
Volume 8
|
Article 114
|
22

Boyatzis et al. Leadership roles and opposing domains
been known through the highly influential work of Damasio
(1994) looking at patients with vmPFC damage. These patients
exhibit severely impaired social, moral, and decision making
behavior, cannot hold down a job, and tend to be shunned
by family members, even though they often have high IQs
(Anderson et al., 1999). More recent work with moral decision
making tasks indicates that they also tend to favor a course of
action, which appears to promote the best over all outcome, even
when that involves denying individual rights and directly harming
others. In other words, they are more utilitarian in their thinking
(Koenigs et al., 2007).
With regard to leadership roles, the DMN is the basis for rela-
tional roles in which the leader makes sense of their own and
other people’s emotions and helps to construct a sense of purpose
or vision for the group. Given that both subsystems of the DMN
are typically deactivated by tasks that activate the TPN, it is trou-
bling to imagine the potential consequences of placing too strong
an emphasis on adopting leadership roles that recruit the TPN.
THE TASK-POSITIVE NETWORK
The broadly defined functions of the TPN are agreed in the lit-
erature, although some debate persists about the best way to
characterize the function of the finer grained functionally cou-
pled networks which it overlaps (Kubit and Jack, 2013). The
TPN is activated, and the DMN deactivated, by wide variety
of non-social tasks including those involving focused attention,
working memory, language, logical reasoning, mathematical rea-
soning, and causal/mechanical reasoning (Shulman et al., 1997a,b;
Duncan and Owen, 2000; Fox et al., 2005; Owen et al., 2005; Van
Overwalle, 2011). While the TPN includes some regions of the
brain associated with social processes such as the mirror neu-
ron network, it is distinct from the mentalizing network of the
DMN both in its location and in the types of tasks that activate
it (Van Overwalle and Baetens, 2009; Van Overwalle, 2011; Jack
et al., 2012). The TPN includes parts of the dorsal attention sys-
tem (Fox et al., 2005), the fronto-parietal control network (Vincent
et al., 2008), and the ventral attention network (Fox et al., 2006;
Kubit and Jack, 2013). Using more relaxed criteria, it can also
be seen to overlap the somatomotor network (Figure 3). These
networks are broadly associated with focus on, and execution of,
well-defined tasks that are non-social in nature. Jack (in press)
defines the TPN as “analytical–empirical–critical reasoning, such
as mechanical reasoning.” Given our current understanding of
the TPN, leadership roles associated with this network are those
focused on financial planning, metrics, forecasting, problem solv-
ing, as well as strategic social engagement for the purpose of task
achievement.
THE OPPOSING DOMAINS HYPOTHESIS
As discussed, it is generally accepted in the cognitive neuroscience
literature that the DMN and the TPN are anti-correlated (Greicius
et al., 2003; Fox e t al., 2005; Fransson, 2005; Golland et al., 2007;
Tian et al., 2007; Buckner et al., 2008; Jack et al., 2013b). It is also
broadly agreed that a variety of cognitively demanding non-social
tasks tend to activate the TPN and deactivate the DMN. There has
been less agreement about how best to cognitively characterize the
tension between these networks.
The opposing domains hypothesis predicts that activation of
the DMN or the TPN is a result of the type of thinking a per-
son engages in to order to complete a given task, regardless of
whether the task is externally or internally oriented (e.g., relates
to perceived stimuli vs. to information recalled from memory).
Personality factors play a role in the deployment of these net-
works, particularly for tasks where the most productive strategy is
unclear or ambiguous. Nonetheless, it is thought that all neurotyp-
ical individuals are capable of flexibly deploying these networks,
hence tasks which have a clear affordance for one type of pro-
cessing over the other will tend to engage the relevant network.
When a person engages in a cognitively demanding non-social
task, they will tend to define their role as having an analytic focus.
In this circumstance, both the opposing domains hypothesis and
other accounts predict the TPN will tend to be activated and the
DMN deactivated. When a person engages in a task that involves
mentalizing and/or thinking about affective meaning, and as a
result, defines their role as social and/or relational, the oppos-
ing domains hypothesis predicts the DMN will be activated and
the TPN deactivated. This prediction, which entails that an indi-
vidual’s analytic abilities are suppressed when they are empath-
ically engaged with people, is unique to the opposing domains
account.
Jack et al. (2012) used functional magnetic resonance imaging
(fMRI) to record brain activity when participants were engaged
in social vs. mechanical/analytic tasks. The social tasks required
participants to answer questions about the beliefs and attitudes of
the characters in emotionally and morally laden text passages or
video clips. The mechanical tasks required participants to com-
plete science puzzles, presented either as written passages, or as
video clips taken from the Video Encyclopedia of Physics. A rest
condition was included, in which participants were only asked to
stare at a fixation point, for the purpose of establishing a resting
baseline against which both activations and deactivations could be
observed.
The findings showed that the neural activation during the
social tasks, specifically the activation of the rTPJ, medial pari-
etal/posterior cingulate and the medial prefrontal cortex, was
accompanied by the deactivation of the neural networks respon-
sible for mechanical reasoning, specifically, the superior frontal
sulcus, lateral prefrontal cortex, and the intraparietal sulcus. Con-
trols were put in place for task and perceptual demands to rule out
the alternate hypothesis that the TPN vs. DMN dichotomy can be
best accounted for by internal vs. external attention.
Jack et al. (2012) conclude that the anti-correlation between
the TPN and DMN “reflects a powerful human tendency to dif-
ferentiate between conscious persons and inanimate objects in
both our attitudes and modes of interaction” (p. 396). Further
work (Jack et al., 2013b) looking at humanizing vs. objectifying
(where people tend to be viewed as objects) narratives about peo-
ple provides additional support for the view that these networks
are not driven by the surface characteristics of the stimuli, but
rather reflect flexible cognitive stances which can be deployed
depending on the attitudes and role adopted by the individual.
The implications of these findings for leadership and organiza-
tional behavior are vast. The dualit y of task and relationship;
inanimate and animate; and social and non-social can be found in
Frontiers in Human Neuroscience www.frontiersin.org March 2014
|
Volume 8
|
Article 114
|
23

Boyatzis et al. Leadership roles and opposing domains
the personalit y, motivation, group dynamics, socialization, con-
flict, trust, decision making, mindfulness, and moral reasoning
literatures.
A further wrinkle to this account is important to note. While
it is very well documented that the TPN and DMN tend to be
antagonistic, both at rest and during the performance of tasks, the
dichotomy between these networks is not absolute. They can be
simultaneously activated and work in cooperation with each other
(Fornito et al., 2012; Meyer et al., 2012). Both theory and observa-
tion indicates that this occurs when participants are engaged in a
type of social reasoning that is highly instrumental, and lacking in
genuine empathy. For instance, this pattern is seen more in indi-
viduals who are prone to Machiavellian thinking (Bagozzi et al.,
2013). It is also the neural signature that is seen when people are
animalistically dehumanized, rather than objectified (Jack et al.,
2013b).
This recruitment of the TPN during social cognition is likely
due to a person thinking critically, strategically, or mechanically
about people. Hence, it does not appear to be the case that we
can be both genuinely empathetic and analytic at the same time.
Instead, our view is that when these networks work co-operatively
with each other (Fornito et al., 2012), they realize a different type
of cognitive processing from either genuine empathy or pure ana-
lytic reasoning. When we engage the analytic network alongside
the DMN, this corresponds to a mode of social interaction that
is alienating to others. This is reflected in everyday language.
When we say that people are being “manipulative” or “calculat-
ing,” the metaphor may make sense because they are using TPN
brain regions involved in fine motor control and/or mathemat-
ical reasoning to operate on social representations (Meyer et al.,
2012). Although this cognitive mode involves a sense of social
or emotional distance, it is clearly useful to think “strategically”
or “politically” in this way on o ccasion. This is reflected in the
observation that strategic social reasoning plays a crucial role in
leadership research. For example, Boyatzis and Goleman (2007)
make the distinction between emotional intelligence (EI) and
social intelligence (SI). EI is defined as the ability of a person
to recognize, understand, and use emotional information about
oneself or others (Boyatzis, 2006). We expect these competencies
will tend to recruit both the DMN and the TPN in tandem. By con-
trast, SI competencies are non-task focused, for example, acting
with compassion, and would therefore primarily recruit the DMN
(Boyatzis and Goleman, 2007). Interestingly, Boyatzis et al. (2006)
predicted that SI competencies are linked to the parasympathetic
nervous system, while focusing on tasks and instrumental use of
EI is linked to the sympathetic nervous system. This would suggest
that EI competencieswould relate tothe TPN.Research is currently
underway to explore what overlap exists between the divisions of
the autonomic nervous system and the TPN and DMN. While the
evidence is far from conclusive, early findings based on recent
meta-analyses (see, for example, Beissner et al., 2013) indicate
that the TPN is more closely linked to the sympathetic ner-
vous system while the DMN is closer to the parasympathetic
nervous system. The labels in Figures 2 and 3 indicate regions
which show the closest correspondence between the DMN and
TPN and regions implicated in autonomic nervous function
(Eisenberger and Cole, 2012).
OPPOSING ROLES OF LEADERSHIP
LEADERSHIP ROLES
A role is a constellation of behavior and expectations enacted in a
social situation. Mead (1934) claimed that roles were embedded in
the situation and therefore were constantly emerging and evolving.
As a sociologist and helping to formulate the interactionist theory
of roles, Mead (1934) emphasized the expectations of others in
the forming and reforming of roles. In this way, roles are distinct
from style. Leadership style describes a dispositional comportment
of a person as a leader that can vary by situation and demand.
Leadership style contributes to role enactment as Biddle (1986)
explained from a functionalist theory of roles.
In leadership, a role provides a guide to one’s behavior and
helps new role occupants become socialized into how they could
or should act in a way consistent with the norms and culture of
an organization. A leadership role of a person emerges in response
to the expectations of others around the leader, especially the fol-
lowers, and the leader’s own style/s, competencies, and values
(Boyatzis, 1982). This process of role emergence as a result of the
interaction between expectations and behavior has been explained
by cognitive role theory (LeMay, 1999).
There appears to be two distinct components of the enactment
of leadership roles that parallel the distinction between the TPN
and the DMN: task achievement and relationship development.
We will place the evolution of this duality of leadership roles in
historical context.
FROM TAYLOR TO BASS APPROACHES TO LEADERSHIP ROLES
The centrality of tasks to a leader’s role was evident in Cowley’s
(1928) definition of a leader: “an individual who is moving in a
particular direction and who succeeds in inducing others to follow
him...A leader then, is a person who is going somewhere, who has
a motive, who has a program.” (p. 145–146). In short, without a
task, leaders do not exist.
Fredrick Taylor’s scientific management movement empha-
sized the task aspect of leadership. Followers were viewed as
“machines” to be used efficiently by the leader. In other words,
by treating humans as inanimate objects subject to analyti-
cal analysis, the role of a leader in the scientific management
era was largely reliant on recruitment of the TPN rather than
the DMN (Jack et al., 2013b) and therefore discouraged the
leader from fostering more meaningful social–emotional con-
nections with followers. The introduction of the “human” side
of leadership in the late 1930s gave rise to a multitude of
leadership frameworks that reflected the scientific management
(task) – human relations (relationship) duality. These frameworks
include the autocratic (task)-democratic (relationship) contin-
uum (Tannenbaum and Schmidt, 1958), the Ohio State Leader-
ship Studies on structure (task) and relationship (Shartle, 1950;
Fleishman, 1953; Halpin and Winer, 1957), and the Michigan
Leadership Studies (Katz et al., 1950) of a production orientation
and an employee orientation.
ATTEMPTING TO INTEGRATE TASK AND RELATIONSHIP ROLES FROM
THE 1950s TO THE 1970s
When symbolic interaction theory transferred from social to orga-
nizational psychology, leadership theory changed to require both
Frontiers in Human Neuroscience www.frontiersin.org March 2014
|
Volume 8
|
Article 114
|
24

Boyatzis et al. Leadership roles and opposing domains
relationship building and task attainment. This development par-
allels the duality of the neural opposing domains: relational
leadership competencies are facilitated by the DMN, while the
task competencies are facilitated by the TPN. Bales (1958) was
instrumental in this theoretical shift in the leadership literature
with his claim that a task-oriented group requires two types of
leaders to maximize effectiveness; one leader to attend to the
task functions of the group (inst rumental leader) and another
to attend to the emotional needs of the group (expressive leader).
The suggestion that two leaders are required in a group stood
in stark contrast to the idea that all leadership roles could be
carried out by one individual. Given that we now know that
the neural networks underlying these two roles are antagonis-
tic, having two leaders in a group presents what initially appears
to be a reasonable strategy for relieving the task–relationship
tension.
By the 1960s, a consensus began to form that building relation-
ships with followers was a fundamental component of leadership
and a critical ingredient in task achievement. Leadership theorists
become interested in developing strategies that would enable lead-
ers to integrate these two fundamental leadership roles. The early
Ohio State Leadership Studies (Fleishman, 1953) confirmed the
conceptual distinction between task-oriented and relationship-
oriented leadership and developed a measurement tool for each.
Following from this work, task-oriented leadership has been iden-
tified as being concerned with production (Blake and Mouton,
1964), goal achievement (Cartwright and Zander, 1960; Bowers
and Seashore, 1966), labor allocation, enforcement of sanctions
(McGregor, 1960), and creating a context and structure for fol-
lowers (Shartle, 1950; Fleishman, 1953; Halpin and Winer, 1957).
At the individual level, task-oriented leaders were said to have a
high need for achievement (McClelland, 1961; Wofford, 1970), to
be achievement oriented (Indvik, 1986), and to be cold and aloof
to signal their preference for psychological distance from follow-
ers (Blau and Scott, 1962). Interestingly, these descriptions are not
only consistent with the role of the TPN discussed earlier, but also
allude to the suppression of the DMN – in particular, they fit well
with our observation that the socially distancing effect of dehu-
manizing is associated with a shift from DMN to TPN engagement
(Jack et al., 2013b).
Conversely, relationship-oriented leaders were described as
being focused on follower well-being (Hemphill, 1950), con-
cerned with developing and maintaining relationships (Hersey
and Blanchard, 1969), to be more democratic as opposed to
autocratic (Bass, 1990), and as placing value on friendships,
open communication, and mutual trust. These psychological fea-
tures fit a profile of DMN activation and TPN deactivation –
the neural signature associated with thinking about the expe-
riences of others (Jack et al., 2012) and humanizing (Jack et al.,
2013b). Individuals who are humanized experience positive emo-
tions, whereas those who are dehumanized experience negative
emotions (Bastian and Haslam, 2011). Correspondingly, research
has shown that relationship-oriented leaders are associated with
higher job satisfaction and lower turnover in organizations (Bass,
1990; Yukl, 2006).
Yukl (1999) provides the most recent taxonomy of task and rela-
tion oriented leader roles. He also distinguished a third dimension
in his taxonomy, labeled “change orientation” which includes a
mix of task and relationship oriented roles. However, in critiquing
other’s work, Yukl (1999, 2008) notes the limitations of the task–
relationships distinction, specifically, the inconsistent empirical
results and the lack of evidence that it is indeed possible to be
high in both task and relationship competencies and that being
so is related to leadership effectiveness (Yukl, 1999). Research con-
ducted since adds support toYukl’s critique; specifically, Kaiserand
Kaplan (unpublished, as cited in Bass and Bass, 2008 ) found that
in a sample of managers from a consulting firm, 46% were highly
task oriented, 19% were highly relationship oriented, and only 6%
showed flexibility between the two dimensions. The remaining
29% were low in both task and relationship orientation.
The distinction between task-oriented roles vs. relationship-
oriented roles presented in Yukl’s taxonomy appears to closely
parallel the distinction made between social and mechanical tasks
used to test the opposing domains hypothesis (Jack et al., 2012).
Specifically, the task-oriented tasks are, by and large, mechanical
and analytical in nature and would therefore activate the leader’s
TPN, while the relationship oriented tasks are generally social in
nature and would therefore activate the leader’s DMN.
The anti-correlation between these two networks suggests that
when a leader is focused on a task-oriented role, their ability
and desire to attend to the relationship needs of their followers
is diminished. This is not to say that leaders do not have the ability
to be both highly analytical and to build effective relationships. In
the absence of any task, it is known that the human brain naturally
cycles between activation of the TPN and activation of the DMN,
activating each several times in a period of a minute (Fox et al.,
2005). Hence, it is clearly possible to switch between networks and
possibly roles.
However, the evidence from neuroscience does suggest that
leaders
cannot sim
ultaneously attend to these distinct roles, hence
conflicts are likely to arise if leaders get “stuck” in one role,
which decreases their ability to switch between the two networks,
resulting in the prolonged suppression of one of the networks
and associated roles. This trade-off has been noted by a num-
ber of scholars. Most recently Yukl (2008) notes that “efforts to
improve one performance determinant may have an adverse effect
on another performance determinant...when leaders are preoccu-
pied with responding to external threats (task), there is less time for
people-oriented concerns such as being supportive and developing
member skills” (pp. 711–714). The opposing domains hypothesis
provides an alternative explanation for why this trade-off occurs.
Rather than, or at least in addition to, a simple lack of time
and overall cognitive resources, the opposing domains hypoth-
esis suggests that the suppression of the opposing neural network
further exacerbates the “adverse effect on another performance
determinant.”
The antagonistic relationship between the TPN and DMN
may also help us to understand why the type of role a leader
adopts moderates the relationship between leadership role (task
vs. relationship), task performance and leadership effectiveness
respectively. Specifically, Burke (1965) found that a group’s
performance of a coding task was completed more effectively
under a production-oriented (task) leader while the shared
decision-making (task) was carried out more effectively under a
Frontiers in Human Neuroscience www.frontiersin.org March 2014
|
Volume 8
|
Article 114
|
25

Boyatzis et al. Leadership roles and opposing domains
relationship-oriented leader. The opposing domains hypothesis
offers two explanations for this finding – the first related to the
ability of the followers to perform the task, the second related to
the leadership role that the followers’ perceived to be effective.
First, followers performed more effectively on the analyti-
cal task when the leadership role matched the neural network
activated as a result of the analytical nature of the task (the
TPN). When a relationship-oriented leadership role was used,
the leader’s behavior and focus on relationships may have acti-
vated the DMN in followers, which we now know to be associated
with lapses in attention and performance errors (McKiernan et al.,
2003; Mason et al., 2007; Fassbender et al., 2009; Pyka et al., 2009),
hence the lower performance on the analytical task. Conversely,
the shared decision task, which required interpersonal interaction
and therefore would have activated the DMN, was performed more
effectively under a relationship oriented leader. A relationship-
oriented leader in this task would have allowed for the follower’s
DMN to be dominant, which is the network required to perform
this task effectively. A task-oriented leader would have activated
the follower’s TPN, which would suppress the DMN resulting in
a reduction of human and ethical insight (Jack et al., 2013b, in
press) and consequently lower task performance.
Second, when completing the coding tasks the followers were
predominately engaging their TPN, hence the task-oriented lead-
ership role may have been perceived by followers to be more
effective because it was more psychologically resonant. Similarly
the relationship-oriented leadership role may have been preferred
by followers engaged in the moral decision task because of the
resonant emphasis on DMN engagement for both the task and the
leadership role.
Further evidence of the interaction between task type and
follower preference for a task vs. relationship-oriented leader is
offered by Weed et al. (1976). This study found that the only type
of task that was a significant moderator between leadership role
and task performance was the difficult–ambiguous task. While this
study was focused on the difficulty and ambiguity of the task rather
than the mechanical or social nature of the task, the authors note
that the difficult–ambiguous task was the only task that involved
ethical/moral problems and therefore “the significant finding s on
this task may be partially attributable to the types of skills required
to deal with these problems” (p. 65).
Finally, Hersey and Blanchard (1969) developed the Tri-
Dimensional Leadership Model that sought to link task and
relationship oriented leadership roles to follower perceptions of
leadership effectiveness. The Tri-Dimensional Leadership Model
suggests that leaders who are highly task oriented will be per-
ceived as “effective” because they know what they want and are
able to impose this to accomplish a task without causing resent-
ment. A highly task-oriented leader will be perceived as ineffective
when followers’ perceive the leader has no confidence in others, is
unpleasant, or only shows interest in short-run output. In other
words, a highly task-oriented leader will only be seen as effec-
tive if they are aware of, and attend to, relationships – rather
than dehumanizing their followers – while accomplishing the
task.
Similarly, a leader with a high relationship-orientation will be
seen as effective by followers when they perceive the leader has
implicit trust in them and is primarily concerned with develop-
ing their talents – behaviors associated with humanizing and the
DMN. They will be seen as ineffective when followers perceive
the leader to be passive and showing little care about the task at
hand – behaviors associated sustained activity of the DMN that
suppresses the TPN (Mason et al., 2007; Jack et al., 2012). These
findings extend the hypotheses derived from the Burke (1965)
study with the suggestion that regardless of a leader’s preferred
role (task-oriented or relationship oriented), the leader must be
able to switch fluidly between the opposing neural networks (the
TPN and the DMN) in order to be perceived as effective by their
followers. Given this, it seems that rather than identifying the
individual difference variables and situational variables that are
associated with each st yle in isolation, it may be more important
to identify variables that correspond to the ability of a leader to
switch between the TPN and the DMN in order to maximize leader
effectiveness.
DEALING WITH THE DIALECTICAL TENSION
The previous section has shown that the distinction between task
and relationship roles is evident throughout the leadership liter-
ature. In this section, we explore potential strategies to resolve,
or at least minimize the consequences of the tension that leaders
face in developing their roles to attend to task requirements and
attending to relationships as a result of the antagonism between
the TPN and the DMN.
NEURAL DISPOSITION: MATCHING THE LEADER TO THE SITUATION
As with hormonal disposition, there is some evidence to suggest
that humans have a natural disposition toward either analytical–
mechanical reasoning and therefore the TPN or social–relational
reasoning and therefore the DMN (Jack et al., 2012). While neural
disposition is a relatively nascent area, hormonal dispositions are
well documented in the literature (see Insel, 1997; Schulkin, 1999).
For example, people with higher unconscious power motives are
known to have higher resting levels of epinephrine secretion, while
people with a higher unconscious Need for Achievement appear
to have higher resting levels of vasopressin secretion (Boyatzis and
Sala, 2004; Boyatzis et al., 2006). At the behav ioral level, neural
and hormonal dispositions may underlie certain personality char-
acteristics, learning styles, and perhaps preferred leadership roles
(Boyatzis and Sala, 2004).
Considering the opposing domains model, one way to address
the tension between the task and relationship leadership roles
could be to match a leader’s predisposition toward either task
or relationship to the type of task they perceive as their primary
role and responsibility. In many ways, Bales’ (1958) suggestion of
the need for two leaders was an attempt to do this. The utility of
matching a leader’s natural inclination toward either a task or rela-
tionship role to the situation has found some empirical support
in the literature. For example, Slatter (1955) found that when task
demands are high, being liked does not contribute to leadership
effectiveness and social or relational skills are not highly valued,
whereas in therapy groups, sensitiv ity training groups, and social
clubs socio-emotional skills were important. However, the practi-
cal results from dividing the leadership roles have been less than
ideal.
Frontiers in Human Neuroscience www.frontiersin.org March 2014
|
Volume 8
|
Article 114
|
26

Boyatzis et al. Leadership roles and opposing domains
Like the old CEO (chief executive officer) and COO (chief
operating officer) split, father and mother role split, CO (com-
manding officer) and XO (executive officer) split in the military,
this leadership role differentiation is possible but appears to be less
effective in the long-term. Attempts to have two people occupy
co-chair, or co-CEO roles have been, at best, confusing. Usu-
ally leaders in these roles cannot sustain true status and power
equalization over time. In addition, others around them may not
allow it and their expectations and preferences push for more
status differentiation, not less. Over time, one role dominates
the other, and as a result one neural network dominates brain
activation (even as an organizational norm) leading the organi-
zation down a narrow path of either problem focused decisions
with little openness to new ideas or events occurring in the larger
environment (like market shifts) OR an organization preoccupied
with environmental changes and meeting the various desires of
employees that has difficulty executing a strategy consistently over
time.
Differentiating the leadership role effectively allows a leader
to spend the majority of their time in one of the two neural net-
works and reduces the need to cycle between them. From the point
of view of sustained leadership effectiveness, fluid cycling at rest
between the two networks is associated with good mental health
and higher IQ, whereas a lessening of the cycling between net-
works is associated w ith a variety of mental disorders (Broyd et al.,
2009; Andrews-Hanna et al., 2010; Anticevic et al.,2012; Whitfield-
Gabrieli and Ford, 2012). While studies of the long-term effects of
privileg ing the engagement of one cognitive mode over the other
in task performance have yet to be done, it is plausible that a
more balanced approach is associated with better long-term men-
tal health and performance, whereas over-privileging one network
for sustained periods leads to mental exhaustion and burn-out –
two detrimental effects that are often discussed in the leader-
ship literature. Therefore, role differentiation, while presenting
an easier short-term strategy for an organization to accomplish
a balance, may prove far less productive if the individual’s role
remains constant over time.
These considerations suggest a more effective approach would
be to train and develop leaders so that they not only possess a
high level of competency in enacting both the task and relation-
ship leadership roles, but also have the ability to switch fluidly
between them along an awareness of appropriate cues and con-
texts for doing so (French and Jack, in press), which also requires
a perceptual facility with perceiving when each is needed or more
appropriate. The a ctions to invoke a change of role are within a
leader’s purview. For example, a leader w itnessing a competitor
take some of their clients or market share could see this as a need
for analytic investigation – is there is pricing difference? Are there
differences in transportation costs or delivery speed?
Similarly, a leader who is heavily into a task role (and TPN
activation) may decide that each day he/she will coach another
person to help them develop. In a within subjects study com-
paring a method of coaching with the positive emotional attractor
(PEA; i.e., coaching with compassion) vs. the more t ypical method
of coaching someone to fix them – to the negative emotional
attractor (NEA; i.e., coaching for compliance), components of the
DMN were significantly activated in the PEA condition more than
the NEA condition (Jack et al., 2013a). Since this neural network
allows a person to be more perceptually and cognitively open to
new ideas, it may be the process needed to help people become
open to switching and engaging both domains with fluidity. By
deciding to coach one person each day (formally or informally
over coffee or a lunch), and to commit to doing it about the per-
son’s dreams, vision or values, the leader commits to switching
into the relationship role at least once a day and activating the
DMN in both himself/herself and the other person. Over time
and practice, the switching between the task and relationship roles
would likely become easier and help the leader develop more cues
as to when one role is more appropriate or possible than the other.
Not quite as simple as changing hats or shoes, but it could become
as convenient.
NEURAL RESOURCE EFFICIENCY
The opposing domains hypothesis could be framed as presenting
a form of “trade-off” between adopting roles favoring task-
related leadership activities and therefore activating the TPN and
suppressing the DMN and adopting roles favoring relationship
building activities and therefore a ctivating the DMN and suppress-
ing the TPN. In this framing, neurological activation is essentially
a form of resource that leaders distribute between the task and
relationship roles to attain or increase their effectiveness. When a
leader expends more neural resources attending to relationships,
they consequently have fewer resources to invest in the task role
and vice versa. It may be possible that we can change the rate
or efficiency of the leader’s neural resources, thereby minimizing
the extent of activation required to successfully complete the task.
Because the TPN and the DMN are antagonistic, minimizing the
degree of activation in one network also serves to proportionally
decrease the suppression of the opposing network (McKiernan
et al., 2003; Pyka et al., 2009).
Task-positive network competencies
We expect that leaders with a high level of cognitive intelligence
(g) will show greater ability in analytical or mechanical type tasks.
They are also more likely to perceive the need for an analytic
leadership role focusing on the TPN and to adopt this role in
an organization. When faced with an analytical or mechanical
task, we expect leaders with high levels of cognitive intelligence
will require less “effort” or neurological resources to successfully
complete an analytical or mechanical task than leaders with lower
levels of cognitive intelligence (Graham et al., 2010). Similarly, we
expect that when faced with an analytical task requiring the str ate-
gic use of emotional information, leaders with high EI w ill require
less cognitive effort to engage followers than leaders with low EI.
Leaders with higher levels of EI can access the emotional infor-
mation more easily than those with low EI, even if it is in service
of an analytic task. This helps to clarify that emotional labor can
be in ser vice of either a task demand or an emotional and social
demand.
A leader who shows a high level of familiar ity or specialized
competence in a given task should also require less neurological
resources than leaders with a lower level of familiarity or special-
ized competence. A high level of task competence will result in
the leader experiencing the task with less intensity resulting in a
Frontiers in Human Neuroscience www.frontiersin.org March 2014
|
Volume 8
|
Article 114
|
27

Boyatzis et al. Leadership roles and opposing domains
lower level of activation in the TPN. By the work appearing more
routine to a leader using an appropriate role, it may allow a leader
to switch roles more easily. Holding competence, experiences, and
intelligence constant, more difficult tasks will require more neu-
rological resources than easy tasks (McKiernan et al., 2003; Mason
et al., 2007; Pyka et al., 2009).
Default mode network competencies
In similar vein to the reasoning discussed above, when faced with a
social or relational task, we expect leaders with high SI (as opposed
to EI – see Boyatzisand Goleman,2007) to require less neurological
resources to successfully complete a relational task relative to those
leaders with low SI. We would also expect that leaders who possess
high levelsof empathetic concern and compassion tobe ina similar
position. These leaders are also more likely to perceive the need
for and adopt a relational leadership role.
SWITCHING BETWEEN THE TPN AND DMN
While the idea that a task can be classified as either analytical or
social is useful for theoretical purposes, as with most dichotomies,
the distinction is rarely so clean-cut in practice. In reality, and par-
ticularly in the context of leadership, all tasks have a relational
component and an analytical component. Leadership almost
always requires consideration of both analytical tasks (TPN) and
relationships (DMN), therefore we suspect that the greater ability
a leader has to switch between these two modes of reasoning the
more effective they will be as a leader. We suspect that minimiz-
ing the suppression of the opposing network will make it easier,
faster, and less costly for the leader to switch between the two
networks. For example, we have already argued that leaders with
certain social competencies require less cognitive effort to com-
plete a social task than those without these competencies, resulting
in less activation of the DMN and less suppression of the TPN.
This reduction in the difference or gap between the two networks
should make switching between the two networks faster and less
costly.
Along with the ability to switch between the two opposing net-
works, which we argued may require a reduction in intensity of
the dominant network, we also expect the ability to appropriately
time the shift from task to relationship to be important both in
terms of minimizing disruption for followers and for maximizing
the effectiveness of the shift. For example, knowing that activa-
tion of the DMN suppresses our analytical–mechanical reasoning
abilities (Jack et al., 2012), and that activation of the DMN dur-
ing analytic tasks is associated with mind-wandering and lapses
of attention (Mason et al., 2007; Fassbender et al., 2009), it would
appear unwise for a leader to engage followers in activities requir-
ing social or relational reasoning at a time when it is important or
urgent to maintain analytic focus. Similarly, in situations requir-
ing social or relational reasoning, for example, during the group’s
formation period, introducing task-focused activities may inhibit
relationship development in the group.
The timing of the switch may also have implications for the
timing of feedback. Based on the opposing domains hypothesis,
we would expect that the closer the time period between action
and feedback, the more congruence there should be between the
type of feedback and the type of task. For example, if feedback is
being given while a person is performing an analytical task, the
feedback given should be analytical or technical in nature because
this is the type of feedback is consistent with the neural network
within which the receiver is engaged. If the leader wishes to give
feedback that requires the follower to engage in social or rela-
tional reasoning, he/she would be better to wait until the receiver
has disengaged from the analytical task. The same can be said
for g iving task-related feedback in an emotionally charged situa-
tion. Gottman et al. (2002) documented something every married
or partnered person should know. When your spouse or part-
ner is angry and yelling at you, this is not the time to reply by
analyzing the situation in emotional distant terms. It does not
help and in fact, as Gottman et al. (2002) document, inflames the
situation.
Finally, given that the decision to switch from one cognitive
domain to another requires reasoning about the emotional state
of self and others, we would expect that leaders with greater DMN
abilities are more likely to be able to successfully time the shifts
than leaders who lack such abilities.
In sum, by using the evidence of these antagonistic neural net-
works and recent research on activating each of them, we can
hypothesize that that most effective leadership requires a combi-
nation of three facilitating factors: (a) a decrease in the switching
time (or cycle time) between these networks; (b) t raining people
to high levels of competence in enacting the roles requiring each
network, so decreasing the cognitive effort required and hence the
degree of deactivation of the opposing network; and (c) training
leaders to recognize and perceive contexts and cues which require
a switch between modes, so they do not remain “stuck in set” and
apply an ineffective cognitive strategy for the task at hand (e.g., by
privileg ing analytic thinking when faced with an ethical decision,
or intuitive thinking when faced with a logical task where creativity
is not helpful).
To make this happen, we conjecture that people would have to
be trained in multiple techniques that invokea tippingpoint. These
techniques would function somewhat like cognitive behavioral
therapy, helping leaders to identifyexternal (e.g., follower thoughts
and emotional state) and internal (e.g., own thoughts and emo-
tional state) cues and respond appropriately. In particular, people
may need to develop the ability to calm the system and lower the
intensity when there is a danger they are becoming “stuck in set” –
whether that involves preoccupation with social/emotional con-
cerns (over-privileging the DMN) or an overly narrow task focus
(over-privileging the TPN).
This emphasis contrasts with current beliefs that to motivate
we must increase energy and incentives (whether positive or neg-
ative). While that approach may preclude the dualistic swing
between these two cognitive modes, and the occasionally con-
flicting considerations raised by each, it also presents a larger
danger: losing sight of important insights, either emotional or
analytic. Additionally, the ability to sense the optimal timing and
context for switches may also be a critical component in under-
standing leadership effectiveness. For example, in the context of
learning a new task, interruptions can be extremely costly, not
only in terms of task outcomes (errors) but also in the ability to
“pick up where you left off.” Once a person has gained a higher
level of mastery, interruptions w ill be less costly and following the
Frontiers in Human Neuroscience www.frontiersin.org March 2014
|
Volume 8
|
Article 114
|
28

Boyatzis et al. Leadership roles and opposing domains
interruption, the person will be able to re-engage with the task
faster.
Prior research on the intensity of emotions suggests that in
order to move a person from a negative emotional state (NEA) to
a positive emotional state (PEA), the intensity of the emotion must
be reduced to reach a tipping point (Boyatzis, 2013). It seems rea-
sonable to suggest that a similar principle mayexist when switching
between the TPN and the DMN. Boyatzis (2013) argues that when
people are in the PEA they are “more perceptually open and accu-
rate in perceptions of others” (p. 1978; see also Fredrickson and
Branigan, 2005; Boyatzis, 2006), which is consistent with the work
of the DMN in allowing individuals to engage in reasoning about
the emotions of others. In contrast, the NEA is said to be linked to
human survival, particularly to defend against threats. NEA also
balances “unchecked optimism” through suppressing the DMN,
which has been linked to poor investment decisions (Gibson and
Sanbonmatsu, 2004) – an analytical task that would require acti-
vation of the TPN rather than the DMN. The opposing domains
model suggests the NEA’s ability to balance unchecked optimism is
achieved through both activating the TPN required for analytical
reasoning and suppressing the DMN, which is largely responsible
for the overly optimistic state.
The link between the PEA–NEA and the DMN–TPN is also
reflected in Fiedler’s (1986) cognitive resources theory. Fiedler and
McGuire (1987, as cited in Bass and Bass, 2008) found that under
non-stressful conditions, leaders with fluid intelligence (IQ) per-
form better than leaders with crystallized intelligence (experience);
however under stressful conditions, leaders with crystallized intel-
ligence performed better. Cognitive resource theory posits that
the reason for this distinction is that under stressful conditions,
a leader with fluid intelligence will rely on intellectual solutions
to a task even when such solutions are inappropriate. In other
words, under stressful conditions, a leader is “stuck” in the TPN
and also in the NEA due to the stress condition, which limits their
ability to switch into the DMN and the PEA, which enables them
to explore more creative and non-intellectual solutions. Leaders
with crystallized intelligence (intelligence based on past experi-
ence and learning) are likely to experience the same situation with
less intensity, thus these leaders will be: (1) closer to the NEA–PEA
tipping point; and (2) more able to switch between the TPN and
the DMN.
FURTHER CONSIDERATIONS ABOUT MAPPING BRAIN NETWORKS
ONTO LEADERSHIP ROLES
In this article, we have focused on mapping a duality which has
long been noted at the behavioral level, between different lead-
ership roles, onto a duality in the brain, highlighted by recent
research in neuroscience. There appears to be a ver y promising
mapping between these two domains, which suggests a fundamen-
tal neurophysiological basis for the observed duality in leadership
roles. At the same time, we acknowledge that there is a con-
siderable distance between neurophysiological observations and
leadership behavior. Hence, more research is needed to firmly
establish the links we highlight, and to elaborate and extend the
model sketched here. Our main goal has been to highlight these
links as a very promising avenue for further research. With an
eye to this future research, in this section, we respond to three
specific questions that naturally arise in response to our proposed
mapping.
First, the DMN has been found to exist in many species
(Mantini et al., 2011). Further, in humans its function serves as
basic index of level of consciousness, even in non-communicative
brain-damaged patients (Vanhaudenhuyse et al., 2010). Given that
this network appears to have such basic functions, it may seem
surprising that we are suggesting it plays a key role in effective
leadership, which would appear a hig her level function. However,
we regard this as consistent with our account, which is based on the
view that the default network originally evolved to play a basic role
in visceral awareness and emotion self-regulation, and that these
functions expanded and evolved so that in the human this cortex
additionally supports complex representations of value and the
mental states of others (Jack et al., 2012, 2013b, in press). This fits
with evidence that the default network is considerably expanded
in the human compared to other species, even when its size is
considered relative to overall cortical volume – which is massively
expanded in the human compared to other primates (Jack et al.,
in press; Figure 1).
More broadly, our rev iew indicates that we see the default
network as critically involved in self-management, in particular
mindfulness, motivation, and affective meaning. We see relational
aspects of leadership as an extension of these functions which
arises through coupling of them with our capacity to metalize. In
summar y, we suggest it quite natural to view the relational aspects
of effective leadership as a skillful cognitive blending of our basic
capacities for emotional self-regulation and social cognition. This
view sits very well with what is known about the function and
evolution of the DMN, and is not contradicted by findings which
indicate the DMN plays a role in more basic functions.
Second, we admit and welcome the possibility that there are
likely to be additional mechanisms, be yond the DMN/TPN dual-
ity we highlight, which are critical for understanding leadership.
For example, we have highlighted a duality which places two much
discussed systems involved in social cognition in opposition: the
mirror neuron system lies within the TPN, and hence there is
a general tendency for it to be deactivated w hen the metaliz-
ing system of the DMN is activated, and vice-versa. The mir ror
neuron system is thought to play a role in “emotional conta-
gion” (Hatfield et al., 1994)–akeymechanism used by leadership
scholars to explain the transfer of emotion between leader and
follower (Bono and Ilies, 2006; Johnson, 2008; see also Sy et al.,
2005) and from followers to the leader (Dasborough et al., 2009).
Additionally, parts of both the mirror neuron network and the
DMN were activated in older executives when remembering spe-
cific moments with resonant vs. dissonant leaders in their past
(Boyatzis et al., 2012). In summary, it is not our claim that the
DMN/TPN dichotomy highlighted here represents an exhaustive
description of the neural processes involved in effective leader-
ship. We look forward to future research that may clarify different
types of neural interaction. In particular, we acknowledge the
importance of looking at ways in the DMN and TPN work coop-
eratively in addition to our focus here on the“default”tendency for
them towork competitively (Fornito et al., 2012). Such cooperative
interactions between the networks need not always be anti-
social in effect, although we document evidence above that some
Frontiers in Human Neuroscience www.frontiersin.org March 2014
|
Volume 8
|
Article 114
|
29

Boyatzis et al. Leadership roles and opposing domains
modes of cooperation are associated with a greater sense of social
distance.
Finally, the methodological concern might be raised that our
analysis depends on reverse inference (Poldrack, 2011). That is,
since br ain imaging evidence is essentially correlational in data,
it is not clear that the DMN and TPN are essential to the spec-
ified roles in effective leadership. We acknowledge this concern,
which applies to all neuroimaging data. One impor tant way to
mitigate faulty inferences of this type is to conduct broad anal-
yses of the literature in order to justify the claimed association
between a specific brain area and a specific function (Poldrack,
2011). Another important step is to conduct critical tests of the
hypothesized account against other accounts.
We have taken both these steps, using both meta-analysis (Jack
et al., in press) and critical tests of our theory (Jack et al., 2012,
2013b) to justify our view that the DMN vs. TPN dichotomy
reflects a tension between empathetic vs. analytic reasoning, as
opposed to the more broadly stated view that it reflects a ten-
sion between internal vs. external attention. Nonetheless, we
agree that further testing is wanted. Ideal tests would involve
directly up or down-regulating one of the networks, or mod-
ifying the ability to switch between them, and then assessing
the impact on naturalistic leadership behavior. As noted, there
is already evidence suggesting that patients with vmPFC dam-
age perform poorly in relational leadership roles (Anderson et al.,
1999), however it would be ideal to manipulate neural process-
ing and study effects w ithin individuals. While this is challenging
to do directly, some more indirect tests along these lines may
be possible. For instance, oxytocin administration appears to
up-regulate DMN function (Bethlehem et al., 2013), hence we
would predict oxytocin administr ation should improve perfor-
mance in relational leadership roles and deteriorate performance
in task-oriented roles. Alternatively, it has been shown that
different forms of meditation tend to either increase (focused
meditation) or decrease (non-dual awareness meditation) anti-
correlations between the DMN and TPN (Josipovic et al., 2012).
The former should increase leadership flexibility (i.e., the abil-
ity to switch between different roles and perform well in both),
the latter decrease it. Exploring these and other potential manip-
ulations of neural processing is an important area for further
research.
CONCLUSION
The emergence of two distinct leadership roles, the task-oriented
leader and the relationship-oriented leader, has been documented
in the leadership literature since the 1950s ( Bales, 1958). Recent
discoveries in neuroscience that the TPN, which allows us to focus
on problem-solving and analytic work, is antagonistic with the
DMN, which allows a person to be socially engaged and open to
new ideas, creates a dialectical tension that reverberates through-
out the leadership role literature and raises questions as to how
leaders can effectively fulfill both roles.
RESEARCH, THEORY, AND PRACTICAL IMPLICATIONS
This paper has identified a key pattern in the leadership literature
and linked this pattern to cutting edge research in the neuro-
science domain. In doing so, we have raised a number of questions
regarding our treatment of the task and relationship distinction in
the literature to date, par ticularly the assumption that leaders are
able to attend to both leadership roles simultaneously. Addition-
ally, we havebeen ableto add further explanation to some historical
findings attempting to understand the interaction between task,
leadership roles, and leadership effectiveness. Finally, we sug-
gested an array of conceptual implications that might extend our
current conceptualization and operationalization of leadership
effectiveness.
From a practical standpoint, this paper suggests that developing
a leader’s analytical and relational abilities may be an important
way to offset the costly effects of the antagonistic relationship
between the TPN and the DMN. Increasing a leader’s abilities
in each role should facilitate the ability faster and more fluidly
between the task and relationship roles by reducing the cogni-
tive effort, and consequently the differential activation between
the TPN and the DMN, required to perform effectively in each
respective role. We belie ve that the ability to switch between
these networks and corresponding leadership roles may be a key
component of leadership effectiveness.
Additionally, knowing that engagement in analytical tasks
inhibits our ability to engage in social or relational reasoning
and vice versa may have important implications for organiza-
tions in terms of how they structure and order tasks that have
analytical and relational components. For example, when giving
feedback, managers should consider if the feedback is analytical
or task related in nature or interpersonal in nature and time the
delivery of that feedback accordingly. The same may be said for
the ordering of meeting agendas and the time and structure of
performance review meetings.
While this paper has focused specifically on the implications
of the opposing domains hypothesis for leadership roles, we
believe that the distinction and antagonistic relationship between
analytical–mechanical reasoning and social reasoning exists in
many other areas in the organizational behavior domain. These
areas include, but are not limited to, leadership styles, conflict
management, trust, and moral reasoning. For example, distinc-
tions in the literature have been made between cognitive and
relational trust (Lewis and Weigert, 1985); cognitive conflict and
affective conflict (Jehn, 1997; De Dreu and Weingart, 2003);
empathy and dehumanization (Haslam, 2006).
Relevant to the leadership domain specifically, further test-
ing is needed in order to understand if individual difference
variables play a role in facilitating the ability to switch between
the two networks. Research is currently underway to address
this question by surfacing the opposing domains at the behav-
ioral level and linking individual difference variables and abilities
to the speed at which an individual is able to switch between
tasks requiring analytical and tasks requiring relational reason-
ing. Once we have more information on this we will be able
to target these variables in leadership development training pro-
grams. Additionally, manipulation of situational characteristics
within each type of task, for example, task difficulty and rou-
tineness for analytical tasks, and prior relationship quality for
social tasks, will allow us to isolate the key situational variables at
play. Finally, further research on the link between hor monal sys-
tems and neurological systems would allow us to understand how
Frontiers in Human Neuroscience www.frontiersin.org March 2014
|
Volume 8
|
Article 114
|
30

Boyatzis et al. Leadership roles and opposing domains
tipping points in hormonal systems influence neurological tipping
points.
REFERENCES
Amodio, D. M., and Frith, C. D. (2006). Meeting of minds: the medial frontal
cortex and social cognition. Nat. Rev. Neurosci. 7, 268–277. doi: 10.1038/
nrn1884
Anderson, S. W., Bechara, A., Damasio, H., Tranel, D., and Damasio, A. (1999).
Impairment of social and moral behavior related to early damage in human
prefrontal cortex. Nat. Am. 2, 1032–1037.
Andrews-Hanna, J. R. (2012). The brain’s default network and its adaptive role
in internal mentation. Neuroscientist 18, 251–270. doi: 10.1177/10738584114
03316
Andrews-Hanna, J. R., Reidler, J. S., Sepulcre, J., Poulin, R., and Buckner, R. L.
(2010). Functional-anatomic fractionation of the brain’s default network. Neuron
65, 550–562. doi: 10.1016/j.neuron.2010.02.005
Anticevic, A., Cole, M. W., Murray, J. D., Corlett, P. R., Wang, X. J., and Krystal, J. H.
(2012). The role of default network deactivation in cognition and disease. Trends
Cogn. Sci. 16, 584–592. doi: 10.1016/j.tics.2012.10.008
Bagozzi, R. P., Verbeke, W. J., Dietvorst, R. C., Belschak, F. D., van den Berg, W.
E., and Rietdijk, W. J. (2013). Theor y of mind and empathic explanations of
Machiavellianism: a neuroscience perspective. J. Manag. 39, 1760–1798. doi:
10.1177/0149206312471393
Bales, R. F. (1958). “Task roles and social roles in problem-solving groups,” in
Readings in Social Psychology, eds E. Maccoby, T. Newcomb, and E. Hartley (New
York, NY: Rinehart & Winston), 437–447.
Bass, B. M. (1990). From transactional to transformational leadership: learning to
share the vision. Organ. Dyn. 18, 19–31. doi: 10.1016/0090-2616(90)90061-S
Bass, B. M., and Bass, R. (2008). The Bass Handbook of Leadership: Theory, Research,
and Managerial Applications. New York, NY: Simon and Schuster.
Bastian, B., and Haslam, N. (2011). Experiencing dehumanization: cognitive and
emotional effects of ever yday dehumanization. Basic Appl. Soc. Psychol. 33, 295–
303. doi: 10.1080/01973533.2011.614132
Beissner, F., Meissner, K., Bar, K., and Napadow, V. (2013). The autonomic brain:
an activation likelihood estimation meta-analysis for central processing of auto-
nomic function. J. Neurosci. 33, 10503–10511. doi: 10.1523/JNEUROSCI.1103-
13.2013
Bethlehem, R. A., van Honk, J., Auyeung, B., and Baron-Cohen, S.
(2013). Oxytocin, brain physiology, and functional connectivity: a review of
intranasal oxytocin fMRI studies. Psychoneuroendocrinology 38, 962–974. doi:
10.1016/j.psyneuen.2012.10.011
Biddle, B. J. (1986). Recent developments in role theory. Annu. Rev. Soc. 12, 67–92.
doi: 10.1146/annurev.so.12.080186.000435
Blake, R., and Mouton, J. (1964). The Managerial Grid. Houston, TX: Gulf.
Blau, P., and Scott, W. (1962). Formal Organizations. San Francisco, CA: Chandler.
Bono, J. E., and Ilies, R. (2006). Charisma, positive emotions and mood contagion.
Leadersh. Q. 17, 317–334. doi: 10.1016/j.leaqua.2006.04.008
Bowers, D. G., and Seashore, S. E. (1966). Predicting organizational effective-
ness with a four-factor theory of leadership. Adm. Sci. Q. 11, 238–263. doi:
10.2307/2391247
Boyatzis, R. E. (1982). The Competent Manager: A Model for Effective Performance.
New York, NY: John Wiley.
Boyatzis, R. E. (2006). Using tipping points of emotional intelligence and cognitive
competenciesto predictfinancial performance of leaders. Psicothema 18,124–131.
Boyatzis, R. E. (2013).“When pulling to the negative emotional att ractor is too much
or not enough to inspire and sustain outstanding leadership,” in The Fulfilling
Workplace: The Organization’s Role in Achieving Individual and Organizational
Health, eds. R. J. Burke and C. L. Cooper (Burlington, TV: Ashgate Publishing
Ltd), 139–150.
Boyatzis, R. E., and Goleman, D. (2007). Emotional and social competency
inventory. Boston: Hay Group.
Boyatzis, R. E., Passarelli, A. M., Koenig, K., Lowe, M., Mathew, B., Stoller, J.
K., et al. (2012). Examination of the neural substrates activated in memories of
experiences with resonant and dissonant leaders. Leadersh. Q. 23, 259–272. doi:
10.1016/j.leaqua.2011.08.003
Boyatzis, R. E., and Sala, F. (2004). “The emotional competence inventory (ECI),” in
Measuring Emotional Intelligence: Common Ground and Controversy, ed. G. Geher
(Hauppauge, NY: Nova Science Publishers), 147–180.
Bo
yatzis,
R. E., Smith, M. L., and Blaize, N. (2006). Developing sustainable leaders
through coaching and compassion. Acad. Manag. Learn. Educ. 5, 8–25. doi:
10.5465/AMLE.2006.20388381
Broyd, S. J., Demanuele, C., Debener, S., Helps, K., James, C. J., and
Sonuga-Barke, E. J. (2009). Default-mode brain dysfunction in mental dis-
orders: a systematic review. Neurosci. Biobehav. Rev. 33, 279–296. doi:
10.1016/j.neubiorev.2008.09.002
Buckner, R., and Carroll, D. (2007). Self-projection and the brain. Trends Cogn. Sci.
11, 49–57. doi: 10.1016/j.tics.2006.11.004
Buckner, R. L., Andrews-Hanna, J. R., and Schacter, D. L. (2008). The brain’s default
network. Ann. N. Y. Acad. Sci. 1124, 1–38. doi: 10.1196/annals.1440.011
Burke, W. W. (1965). Leadership behavior as a function of the leader, the follower,
and the situation. J. Pers. 33, 60–81. doi: 10.1111/j.1467-6494.1965.tb01372.x
Bzdok, D., Schilbach, L., Vogeley, K., Schneider, K., Laird, A. R., Langner, A., et al.
(2012). Parsing the neural correlates of moral cognition: ALE meta-analysis on
morality, theory of mind, and empathy. Brain Struct. Funct. 217, 783–796. doi:
10.1007/s00429-012-0380-y
Cartwright, D., and Zander, A. (1960). Group Dynamics: Research and Theory.
Evanston, IL: Row Peterson.
Chai, X. J., Castañón, A. N., Öngür, D., and Whitfield-Gabrieli, S. (2012). Anticor-
relations in resting state networks without global signal regression. Neuroimage
59, 1420–1428. doi: 10.1016/j.neuroimage.2011.08.048
Chang, C., and Glover, G. H. (2009). Effects of model-based physiological noise cor-
rection on default mode network anti-correlations and correlations. Neuroimage
47, 1448–1459. doi: 10.1016/j.neuroimage.2009.05.012
Cohen, A. L., Fair, D. A., Dosenbach, N. U., Miezin, F. M., Dierker, D., Van
Essen, D. C., et al. (2008). Defining functional areas in individual human
brains using resting functional connectivity MRI. Neuroimage 41, 45–57. doi:
10.1016/j.neuroimage.2008.01.066
Corbetta, M., Akbudak, E., Conturo, T. E., Snyder, A. Z., Ollinger, J. M., Drury, H.
A., et al. (1998). A common network of functional areas for attention and eye
movements. Neuron 21, 761–773. doi: 10.1016/S0896-6273(00)80593-0
Cowley, W. (1928). Three distinctions in the study of leaders. J. Abnorm. Soc. Psychol.
23, 144–157. doi: 10.1037/h0073661
Damasio, A. R. (1994). Descartes’ Error: Emotion, Reason, and the Human Brain.
New York: Putnam.
Dasborough, M., Ashkanasy, N., Tee, E., and Tse, H. (2009). What goes around
comes around: how meso-level negative emotional contagion can ultimately
determine organizational attitudes toward leaders. Leadersh. Q. 20, 571–585.
doi: 10.1016/j.leaqua.2009.04.009
De Dreu, C., and Weingart, L. (2003). Task versus relationship conflict, team per-
formance and team member satisfaction: a meta-analysis. J. Appl. Psychol. 88,
741–749. doi: 10.1037/0021-9010.88.4.741
Duncan, J., and Owen, A. M. (2000). Common regions of the human frontal
lobe recruited by diverse cognitive demands. Trends Neurosci. 23, 475–483. doi:
10.1016/S0166-2236(00)01633-7
Eisenberger, N. I., and Cole, S. W. (2012). Social neuroscience and health: neuro-
physiological mechanisms linking social ties with physical health. Nat. Neurosci.
15, 669–674. doi: 10.1038/nn.3086
Fassbender, C., Zhang, H., Buzy, W. M., Cortes, C. R., Mizuiri, D., Beckett, L., et al.
(2009). A lack of default network suppression is linked to increased distractibility
in ADHD. Brain Res. 1273, 114–128. doi: 10.1016/j.brainres.2009.02.070
Fiedler, F. E. (1986). The contribution of cognitive resources and leader behav-
ior to organizational performance. J. Appl. Soc. Psychol. 16, 532–548. doi:
10.1111/j.1559-1816.1986.tb01157.x
Fiedler, M. E., and McGuire, M. A. (1987). Paper, Third Army Leadership Conference.
Kansas City, MO.
Fleishman, E. A. (1953). Leadership climate, human relations training, and
supervisory behavior. Pers. Psychol. 6, 205–222. doi: 10.1111/j.1744-6570.1953.
tb01040.x
Fornito, A., Harrison, B. J., Zalesky, A., and Simons, J. S. (2012). Com-
petitive and cooperative dynamics of large-scale brain functional networks
supporting recollection. Proc. Natl. Acad. Sci. U.S.A. 109, 12788–12793. doi:
10.1073/pnas.1204185109
Fox, M. D., Corbetta, M., Snyder, A. Z., Vincent, J. L., and Raichle, M. E.
(2006).
Spontaneous neur
onal activ ity distinguishes human dorsal and ventral
attention systems. Proc. Natl. Acad. Sci. U.S.A. 103, 10046–10051. doi:
10.1073/pnas.0604187103
Frontiers in Human Neuroscience www.frontiersin.org March 2014
|
Volume 8
|
Article 114
|
31

Boyatzis et al. Leadership roles and opposing domains
Fox, M. D., Snyder, A. Z., Vincent, J. L., Corbetta, M., Van Essen, D. C., and
Raichle, M. E. (2005). The human brain is intrinsically organized into dynamic,
anticorrelated functional networks. Proc. Natl. Acad. Sci. U.S.A. 102, 9673–9678.
doi: 10.1073/pnas.0504136102
Fransson, P. (2005). Spontaneous low-frequency BOLD signal fluctuations: an fMRI
investigation of the resting-state default mode of brain function hypothesis. Hum.
Brain Mapp. 26, 15–29. doi: 10.1002/hbm.20113
Fredrickson, B. L., and Branigan, C. (2005). Positive emotions broaden the scope
of attention and thought-action repertoires. Cogn. Emot. 19, 313–332. doi:
10.1080/02699930441000238
French, S. E., and Jack, A. I. (in press). “Dehumanizing the enemy: the intersection
of neuroethics and military ethics,” in The Responsibility to Protect: Alternative
Perspectives, ed. D. Whetham (Martinus Nijhoff), due in pr int April 2014.
Gibson, B., and Sanbonmatsu, D. M. (2004). Optimism, pessimism, and gam-
bling: the downside of optimism. Pers. Soc. Psychol. Bull. 30, 149–160. doi:
10.1177/0146167203259929
Golland, Y., Bentin, S., Gelbard, H., Benjamini, Y., Heller, R., Nir, Y., et al.
(2007). Extrinsic and intrinsic systems in the posterior cortex of the human
brain revealed during natural sensory stimulation. Cereb. Cortex 17, 766–777.
doi: 10.1093/cercor/bhk030
Gottman, J. M., Murray, J. D., Swanson, C. C., Tyson, R., and Swanson, K. R. (2002).
The Mathematics of Marriage: Dynamic Non-linear Models. Cambridge, MA: MIT
Press.
Grabenhorst, F., and Rolls, E. T. (2011). Value, pleasure and choice in the ventral
prefrontal cortex. Trends Cogn. Sci. 15, 56–67. doi: 10.1016/j.tics.2010.12.004
Graham, S., Jiang, J., Manning, V., Nejad, A. B., Zhisheng, K., Salleh, S. R., et al.
(2010). IQ-related fMRI differences during cognitive set shifting. Cereb. Cortex
20, 641–649. doi: 10.1093/cercor/bhp130
Greene, J. D., Nystrom, L. E., Engell, A. D., Darley, J. M., and Cohen, J. D. (2004).
The neural bases of cognitive conflict and control in moral judgment. Neuron 44,
389–400. doi: 10.1016/j.neuron.2004.09.027
Greicius, M. D., Krasnow, B., Reiss, A. L., and Menon, V. (2003). Functional con-
nectivity in the resting brain: a network analysis of the default mode hypothesis.
Proc. Natl. Acad. Sci. U.S.A. 100, 253–258. doi: 10.1073/pnas.0135058100
Gusnard, D. A., Akbudak, E., Shulman, G. L., and Raichle, M. E. (2001).
Medial prefrontal cortex and self-referential mental activity: relation to a default
mode of brain function. Proc. Natl. Acad. Sci. U.S.A. 98, 4259–4264. doi:
10.1073/pnas.071043098
Halpin, A., and Winer, B. (1957). “A factorial study of the leader behavior descrip-
tions,” in Leader Behavior: Its Description and Measurement, eds R. Stodgill and
A. Coons (Columbus, OH: Bureau of Business Research, Ohio State University),
39–51.
Haslam, N. (2006). Dehumanization: an integrative review. Pers. Soc. Psychol. Rev.
10, 252–264. doi: 10.1207/s15327957pspr1003_4
Hatfield, E., Cacioppo, J., and Rapson, R. (1994). Emotional Contagion.NewYork,
NY: Cambridge University Press.
Hemphill, J. K. (1950). Relations between the size of the group and the behavior
of “superior” leaders. J. Soc. Psychol. 32, 11–22. doi: 10.1080/00224545.1950.
9919026
Henson, R. (2006). Forward inference using functional neuroimaging: dissociations
versus associations. Trends Cogn. Sci. 10, 64–69. doi: 10.1016/j.tics.2005.12.005
Hersey, P., and Blanchard, K. (1969). Management of Organizational Be havior:
Utilizing Human Resources. Englewood Cliffs, NJ: Prentice-Hall.
Iacoboni, M., Lieberman, M. D., Knowlton, B. J., Molnar-Szakacs, I., Moritz, M.,
Throop, C. J., et al. (2004). Watching social interactions produces dorsome-
dial prefrontal and medial parietal BOLD fMRI signal increases compared to
a resting baseline. Neuroimage 21, 1167–1173. doi: 10.1016/j.neuroimage.2003.
11.013
Indvik, J. (1986). Path-goal theory of leadership: a meta-analysis. Acad. Manag.
Proc. 1986, 189–192. doi: 10.5465/AMBPP.1986.4980581
Insel, T. R. (1997). A neurobiological basis of social attachment. Am. J. Psychiatry
154, 726–735.
Jack, A., Boyatzis, R. E., Khawaja, M., Passarelli, A. M., and Leckie, R. (2013a).
Visioning in the brain: an fMRI study of inspirational coaching and mentoring.
Soc. Neurosci. 8, 369–384. doi: 10.1080/17470919.2013.808259
Jack, A. I., Dawson, A. J., and Norr, M. (2013b). Seeing human: distinct and overlap-
ping neural signatures associated with two forms of dehumanization. Neuroimage
79, 313–328. doi: 10.1016/j.neuroimage.2013.04.109
J
ack,
A. I. (in press). “A scientific case for conceptual dualism: the problem
of consciousness and the opposing domains hypothesis,” in Oxford Studies in
Experime ntal Philosophy, Vol. 1, eds J. Knobe and S. Nichols (Oxford: Oxford
University Press).
Jack, A. I., Dawson, A., Begany, K., Leckie, R. L., Barry, K., Ciccia, A., et al.
(2012). fMRI reveals reciprocal inhibition between social and physical cog-
nitive domains. Neuroimage 66C, 385–401. doi: 10.1016/j.neuroimage.2012.
10.061
Jack, A. I., Robbins, P. A., Friedman, J. P., and Meyers, C. D. (in press). “More than a
feeling: counterintuitive effects of compassion on moral judgment,” in Advances
in Experimental Philosophy of Mind, eds J. Sytsma (Continuum).
Jehn, K. (1997). “Affective and cognitive conflict in work groups: increasing
performance through value-based intragroup conflict,” in Using Conflict in
Organizations, eds C. De Dreu and E. Van de Vliert (London: Sage), 87–100.
Johnson, S. K. (2008). I second that emotion: effects of emotional contagion and
affect at work on leader and follower outcomes. Leadersh. Q. 19, 1–19. doi:
10.1016/j.leaqua.2007.12.001
Josipovic, Z., Dinstein, I., Weber, J., and Heeger, D. J. (2012). Influence of medita-
tion on anti-correlated networks in the brain. Front. Hum. Neurosci. 5:183. doi:
10.3389/fnhum.2011.00183
Katz, D., Maccoby, N., and Morse, N. C. (1950). Productivity, Supervision, and
Morale in an Office Situation. Oxford: Institute for Social Research, University of
Michigan.
Koenigs, M., Kruepke, M., Zeier, J., and Newman, J. P. (2012). Utilitarian
moral judgment in psychopathy. Soc. Cogn. Affect. Neurosci. 7, 708–714. doi:
10.1093/scan/nsr048
Koenigs, M., Young, L., Adolphs, R., Tranel, D., Cushman, F., Hauser, M., et al.
(2007). Damage to the prefrontal cortex increases utilitarian moral judgements.
Nature 446, 908–911. doi: 10.1038/nature05631
Kubit, B., and Jack, A. I. (2013). Rethinking the role of the rTPJ in
attention and social cognition in light of the opposing domains hypoth-
esis: findings from an ALE-based meta-analysis and resting-state func-
tional connectivity. Front. Hum. Neurosci. 7:323. doi: 10.3389/fnhum.
2013.00323
Laird, A. R., Eickhoff, S. B., Rottschy, C., Bzdok, D., Ray, K. L., and Fox,
P. T. (2013). Networks of task co-activations. Neuroimage 80, 505–514. doi:
10.1016/j.neuroimage.2013.04.073
LeMay, R. A. (1999). “Roles, identities, and expectancies: positive contributions to
normalization and social role valorization,”in A Quar ter-century of Normalization
and Social Role Valorization: Evolution and Impact, eds R. J. Flynn and R. A. Lemay
(Ottawa, ON: University of Ottawa Press), 219–240.
Lewis, J. D., and Weigert, A. (1985). Trust as a social reality. Soc. Forces 63, 967–985.
Lieberman, M. D. (2013). Social: Why are Brains are Wired to Connect.NewYork,
NY: Crown Publishers.
Lindquist, K. A., Wager, T. D., Kober, H., Bliss-Moreau, E., and Barrett, L. F. (2012).
The brain basis of emotion: a meta-analytic review. Behav. Brain Sci. 35, 121–143.
doi: 10.1017/S0140525X11000446
Mantini, D., Gerits, A., Nelissen, K., Durand, J. B., Joly, O., Simone, L., et al. (2011).
Default mode of brain function in monkeys. J. Neurosci. 31, 12954–12962. doi:
10.1523/JNEUROSCI.2318-11.2011
Mars, R. B., Neubert, F. X., Noonan, M. P., Sallet, J., Toni, I., and Rushworth, M. F.
(2012). On the relationship between the “default mode network” and the “social
brain”. Front. Hum. Neurosci. 6:189: doi: 10.3389/fnhum.2012.00189.
Mason, M. F., Norton, M. I., Van Horn, J. D., Wegner, D. M., Grafton, S. T., and
Macrae, C. N. (2007). Wandering minds: the default network and stimulus-
independent thought. Science 315, 393–395. doi: 10.1126/science.1131295
McClelland, D. (1961). The Achieving Society. Princeton, NJ: Van Nostrand. doi:
10.1037/14359-000
McGregor, D. (1960). The Human Side of Enterprise.NewYork,NY:McGrawHill.
McKiernan, K. A., Kaufman, J. N., Kucera-Thompson, J., and Binder, J. R.
(2003). A parametric manipulation of factors affecting task-induced deac-
tivation in functional neuroimaging. J. Cogn. Neurosci. 15, 394–408. doi:
10.1162/089892903321593117
Mead, G. H. (1934). Mind, Self, and Society. Chicago: University of Chicago Press.
Meyer, M. L., Spunt, R. P., Berkman, E. T., Taylor, S. E., and Lieberman, M. D.
(2012).
Ev
idence for social working memory from a par ametric functional MRI
study. Proc. Natl. Acad. Sci. U.S.A. 109, 1883–1888. doi: 10.1073/pnas.11210
77109
Frontiers in Human Neuroscience www.frontiersin.org March 2014
|
Volume 8
|
Article 114
|
32

Boyatzis et al. Leadership roles and opposing domains
Mitchell, J. P., Macrae, N. C., and Banaji, M. R. (2006). Dissociable medial prefrontal
contributions to judgments of similar and dissimilar others. Neuron 50, 655–663.
doi: 10.1016/j.neuron.2006.03.040
Ochsner, K. N., Beer, J. S., Robertson, E. R., Cooper, J. C., Gabrieli, J. D. E., Kihsltrom,
J. F., et al. (2005). The neural correlates of direct and reflected self-knowledge.
Neuroimage 28, 797–814. doi: 10.1016/j.neuroimage.2005.06.069
Owen, A. M., McMillan, K. M., Laird, A. R., and Bullmore, E. (2005). N-back work-
ing memory paradigm: a meta-analysis of normative functional neuroimaging
studies. Hum. Brain Mapp. 25, 46–59. doi: 10.1002/hbm.20131
Poldrack, R. A. (2011). Inferring mental states from neuroimaging data:
from reverse inference to large-scale decoding. Neuron 72, 692–697. doi:
10.1016/j.neuron.2011.11.001
Pyka, M., Beckmann, C. F., Schöning, S., Hauke, S., Heider, D., Kugel, H., et al.
(2009). Impact of working memory load on fMRI resting state pattern in subse-
quent resting phases. PLoS ONE 4:e7198. doi: 10.1371/journal.pone.0007198.
Raichle, M. E., MacLeod, A. M., Snyder, A. Z., Powers, W. J., Gusnard, D. A., and
Shulman, G. L. (2001). A default mode of brain function. Proc. Natl. Acad. Sci.
U.S.A. 98, 676–682. doi: 10.1073/pnas.98.2.676
Raichle, M. E., and, Snyder, A. Z. (2007). A default mode of brain func-
tion: a brief history of an evolving idea. Neuroimage 37, 1083–1090. doi:
10.1016/j.neuroimage.2007.02.041
Roy, M., Shohamy, D., and Wager, T. D. (2012). Ventromedial prefrontal-subcortical
systems and the generation of affective meaning. Trends Cogn. Sci. 16, 147–156.
doi: 10.1016/j.tics.2012.01.005
Schilbach, L., Eickhoff, B., Rotarska-Jagiela, A., Fink, G. R., and Vogeley, K. (2008).
Minds at rest? Social cognition as the default mode of cognizing and its putative
relationship to the “default system” of the brain. Conscious. Cogn. 17, 457–467.
doi: 10.1016/j.concog.2008.03.013
Schulkin, J. (1999). The Neuroendocrine Regulation of Behavior. Cambridge:
Cambridge University Press.
Shartle, C. (1950). “Studies of leadership by interdisciplinary methods,” in Leader-
ship in American Education, ed. A. G. Grace (Chicago, IL: University of Chicago
Press).
Shulman, G. L., Corbetta, M., Buckner, R. L., Fiez, J. A., Miezin, F. M., Raichle, M.
E., et al. (1997a). Common blood flow changes across visual tasks: I. Increases
in subcortical structures and cerebellum but not in nonvisual cortex. J. Cogn.
Neurosci. 9, 624–647. doi: 10.1162/jocn.1997.9.5.624
Shulman, G. L., Corbetta, M., Buckner, R. L., Fiez, J. A., Miezin, F. M., Raichle, M.
E., et al. (1997b). Common blood flow changes across visual tasks: II. Decreases
in cerebral cortex. J. Cogn. Neurosci. 9, 648–663. doi: 10.1162/jocn.1997.9.5.648
Slatter, W. L. (1955). Why not a leadership training program? J. Dairy Sci. 38,
1408–1409. doi: 10.3168/jds.S0022-0302(55)95131-6
Spreng, R. N., and Grady, C. L. (2010). Patterns of brain activity supporting
autobiographical memory, prospection, and theory of mind, and their rela-
tionship to the default mode network. J. Cogn. Neurosci. 22, 1112–1123. doi:
10.1162/jocn.2009.21282
Spreng, R. N., Mar, R. A., and Kim, A. S. (2009). The common neural basis of
autobiographical memory, prospection, navigation, theory of mind, and the
default mode: a quantitative meta-analysis. J. Cogn. Neurosci. 21, 489–510. doi:
10.1162/jocn.2008.21029
Subramaniam, K., Kounios, J., Parrish, T. B., and Jung-Beeman, M. (2009). A brain
mechanism for facilitation of insight by positive affect. J. Cogn. Neurosci. 21,
415–432. doi: 10.1162/jocn.2009.21057
Sy, T., Côté, S., and Saavedra, R. (2005). The contagious leader: impact of the leader’s
mood on the mood of group members, group affective tone, and group processes.
J. Appl. Psychol. 90, 295–305. doi: 10.1037/0021-9010.90.2.295
Takeuchi, H., Taki, Y., Hashizume, H., Sassa, Y., Nagase, T., Nouchi, R.,
et al. (2011). Failing to deactivate: the association between brain activity dur-
ing a working memory task and creativity. Neuroimage 55, 681–687. doi:
10.1016/j.neuroimage.2010.11.052
Tannenbaum, R., and Schmidt, W. (1958). How to choose a leadership pattern.
Harv. Bus. Rev. 36, 95–101.
Tian, L., Jiang, T., Liu, Y., Yu, C., Wang, K., Zhou, Y., et al. (2007). The relationship
within and between the extrinsic and intrinsic systems indicated by resting
state correlational patterns of sensory cortices. Neuroimage 36, 684–690. doi:
10.1016/j.neuroimage.2007.03.044
Uddin, L. Q., Kelly, A. M., Biswal, B. B., Xavier Castellanos, F., and Milham, M.
P. (2009). Functional connectivity of default mode network components: cor-
relation, anticorrelation, and causality. Hum. Brain Mapp. 30, 625–637. doi:
10.1002/hbm.20531
V
an D
ijk, K. R., Hedden, T., Venkataraman, A., Evans, K. C., Lazar, S. W., and
Buckner, R. L. (2010). Intrinsic functional connectivity as a tool for human
connectomics: theory, properties, and optimization. J. Neurophysiol. 103, 297–
321. doi: 10.1152/jn.00783.2009
Vanhaudenhuyse, A., Noirhomme, Q., Tshibanda, L. J. F., Bruno, M. A., Boveroux,
P., Schnakers, C., et al. (2010). Default network connectivity reflects the level of
consciousness in non-communicative brain-damaged patients. Brain 133, 161–
171. doi: 10.1093/brain/awp313
Van Overwalle, F. (2009). Social cognition and the brain: a meta-analysis. Hum.
Brain Mapp. 30, 829–858. doi: 10.1002/hbm.20547
Van Overwalle, F. (2011). A dissociation between social mentalizing and general
reasoning. Neuroimage 54, 1589–1599. doi: 10.1016/j.neuroimage.2010.09.043
Van Overwalle, F., and Baetens, K. (2009). Understanding others’ actions and goals
by mirror and mentalizing systems: a meta-analysis. Neuroimage 48, 564–584.
doi: 10.1016/j.neuroimage.2009.06.009
Vincent, J. L., Kahn, I., Snyder, A. Z., Raichle, M. E., and Buckner, R. L.
(2008). Evidence for a frontoparietal control system revealed by intrinsic
functional connectivity. J. Neurophysiol. 100, 3328–3342. doi: 10.1152/jn.903
55.2008
Waytz, A., and Mason, M. F. (2013). Your brain at work. Harv. Bus. Rev. 91, 102.
Weed, S. E., Mitchell, T. R., and Moffitt, W. (1976). Leadership style, subordinate
personality, and task type as predictors of performance and satisfaction with
supervision. J. Appl. Psychol. 61, 58–66. doi: 10.1037/0021-9010.61.1.58
Whitfield-Gabrieli, S., and Ford, J. M. (2012). Default mode network activity
and connectivity in psychopathology. Annu. Rev. Clin. Psychol. 8, 49–76. doi:
10.1146/annurev-clinpsy-032511-143049
Wiggett, A. J., Pritchard, I. C., and Downing, P. E. (2009). Animate and inanimate
objects in human visual cortex: evidence for task-independent category effects.
Neuropsychologia 47, 3111–3117. doi: 10.1016/j.neuropsychologia.2009.07.008
Wofford, J. C. (1970). Factor analysis of managerial behavior variables. J. Appl.
Psychol. 54, 169–173. doi: 10.1037/h0029058
Yeo, B. T., Krienen, F. M., Sepulcre, J., Sabuncu, M. R., Lashkari, D., Hollinshead,
M., et al. (2011). The organization of the human cerebral cortex estimated
by intrinsic functional connectivity. J. Neurophysiol. 106, 1125–1165. doi:
10.1152/jn.00338.2011
Yukl, G. (1999). An evaluative essay on current conceptions of effective leadership.
Eur. J. Work Organ. Psychol. 8, 33–48. doi: 10.1080/135943299398429
Yukl, G. (2006). Leadership in Organizations, 6th Edn. Upper Saddle River, NJ:
Prentice-Hall.
Yukl, G. (2008). How leaders influence organizational effectiveness. Leadersh. Q. 19,
708–722. doi: 10.1016/j.leaqua.2008.09.008
Conflict of Interest Statement: The authors declare that the research was conducted
in the absence of any commercial or financial relationships that could be construed
as a potential conflict of interest.
Received: 20 December 2013; paper pending published: 23 January 2014; accepted: 17
February 2014; published online: 04 March 2014.
Citation: Boyatzis RE, Rochford K and Jack AI (2014) Antagonistic neural net-
works underlying differentiated leadership roles. Front. Hum. Neurosci. 8:114. doi:
10.3389/fnhum.2014.00114
This ar ticle was submitted to the journal Frontiers in Human Neuroscience.
Copyright © 2014 Boyatzis, Rochford and Jack. This is an open-access article distributed
under the terms of the Creative Commons Attribution License (CC BY). The use, dis-
tribution or reproduction in other forums is permitted, provided the original author(s)
or licensor are credited and that the orig inal publication in this journal is cited, in
accordance with accepted academic practice. No use, distribution or reproduction is
permitted which does not comply w ith these terms.
Frontiers in Human Neuroscience www.frontiersin.org March 2014
|
Volume 8
|
Article 114
|
33

HUMAN NEUROSCIENCE
PERSPECTIVE ARTICLE
published: 12 February 2015
doi: 10.3389/fnhum.2014.01073
Redefining neuromarketing as an integrated science of
influence
Hans C. Breiter
1,2,3
*
†
, Martin Block
3,4†
, Anne J. Blood
2,3†
, Bobby Calder
3,5†
, Laura Chamberlain
3,6†
,
Nick Lee
3,7†
, Sherri Livengood
1,3†
, Frank J. Mulhern
3,4†
, Kalyan Raman
1,3,4†
, Don Schultz
3,4†
,
Daniel B. Stern
1,3†
, Vijay Viswanathan
3,4†
and Fengqing (Zoe) Zhang
3,8,9†
1
Warren Wright Adolescent Center, Department of Psychiatry and Behavioral Science, Northwestern University Feinberg School of Medicine, Chicago, IL, USA
2
Mood and Motor Control Laboratory or Laboratory of Neuroimaging and Genetics, Department of Psychiatry, Massachusetts General Hospital, Boston, MA, USA
3
Applied Neuromarketing Consortium, Medill, Kellogg, and Feinberg Schools, Northwestern University, Evanston, IL, USA
4
Medill Integrated Marketing Communications, Northwestern University, Evanston, IL, USA
5
Department of Marketing, Kellogg School of Management, Northwestern University, Evanston, IL, USA
6
Aston Business School, Birmingham, UK
7
School of Business and Economics, Loughborough University, Leicestershire, UK
8
Department of Statistics, Northwestern University, Evanston, IL, USA
9
Department of Psychology, Drexel University, Philadelphia, PA, USA
Edited by:
Sven Braeutigam, University of
Oxford, UK
Reviewed by:
Arun Bokde, Trinity College Dublin,
Ireland
Giovanni Vecchiato, Sapienza
University of Rome, Italy
*Correspondence:
Hans C. Breiter, Warren Wright
Adolescent Center, Department of
Psychiatry and Behavioral Science,
Northwestern University Feinberg
School of Medicine, 710 N. Lake
Shore Dr., Abbott Hall 1301,
Chicago, IL 60611, USA
e-mail: h-breiter@northwestern.edu
†
These authors have contributed
equally to this work.
Multiple transformative forces target marketing, many of which derive from new
technologies that allow us to sample thinking in real time (i.e., brain imaging), or to
look at large aggregations of decisions (i.e., big data). There has been an inclination to
refer to the intersection of these technologies with the general topic of marketing as
“neuromarketing”. There has not been a serious effort to frame neuromarketing, which
is the goal of this paper. Neuromarketing can be compared to neuroeconomics, wherein
neuroeconomics is generally focused on how individuals make “choices”, and represent
distributions of choices. Neuromarketing, in contrast, focuses on how a distribution of
choices can be shifted or “influenced”, which can occur at multiple “scales” of behavior
(e.g., individual, group, or market/society). Given influence can affect choice through
many cognitive modalities, and not just that of valuation of choice options, a science of
influence also implies a need to develop a model of cognitive function integrating attention,
memory, and reward/aversion function. The paper concludes with a brief description of
three domains of neuromarketing application for studying influence, and their caveats.
Keywords: neuromarketing, neuroeconomics, marketing communications, neuroimaging, scaling, influence, choice
INTRODUCTION
Marketing has been dominated for over a century by models
that assume a rational process of persuasion, which follows a
sequence from awareness through purchase that consumers can
consciously articulate. While this approach fits with traditional
research methodologies, it hasn’t always explained or predicted
purchase behavior. Recent developments suggest that a new per-
spective may be emerging. In particular, marketers have sought
to integrate ideas about non-rational and rational processes
(Kahneman, 2011), and ideas related to social neuroscience vs.
individual decision-making (Lee et al., 2007; Senior and Lee,
2008), as well as using methods and technologies aligned with
neuroscience (Ioannides et al., 2000; Braeutigam, 2005; Vecchiato
et al., 2011; Plassmann et al., 2012). Some have been quick to
label—not always in a complimentary manner—such develop-
ments as “neuromarketing” (e.g., Laybourne and Lewis, 2005
1
).
1
See Brain scam? (2004). Nat. Neurosci. 7, 683. doi:10.1038/nn0704-683;
and Neuromarketing: beyond branding (2004). The Lancet Neurol. 3, 71.
doi:10.1016/S1474-4422(03)00643-4.
To date, neuromarketing has lacked a solid theoretical
framework. As such, the term “neuromarketing” itself runs
the risk of confusing more fundamental scientific research
with commercial applications (Lee et al., 2007; Javor et al.,
2013). In this paper, we seek to extend existing work (e.g.,
Fugate, 2007; Hubert and Kenning, 2008; Senior and Lee, 2008;
Wilson et al., 2008; Fisher et al., 2010), to clarify a frame-
work for neuromarketing as an integrated science of influence.
We start by contrasting neuroeconomics to neuromarketing.
We then consider the concept of influence across individuals,
groups, communities and markets, along with its dependency
on an integrated model of mental function, along with some
key—often unrecognized—caveats that must be considered by
neuromarketing researchers.
INFLUENCE VS. CHOICE
It is helpful to compare neuromarketing to neuroeconomics,
with which it may appear to overlap. Neuroeconomics tends
to focus on individual and group choice, or judgment and
decision-making in the context of consumables or markets
Frontiers in Human Neuroscience www.frontiersin.org February 2015 | Volume 8 | Article 1073 |
34
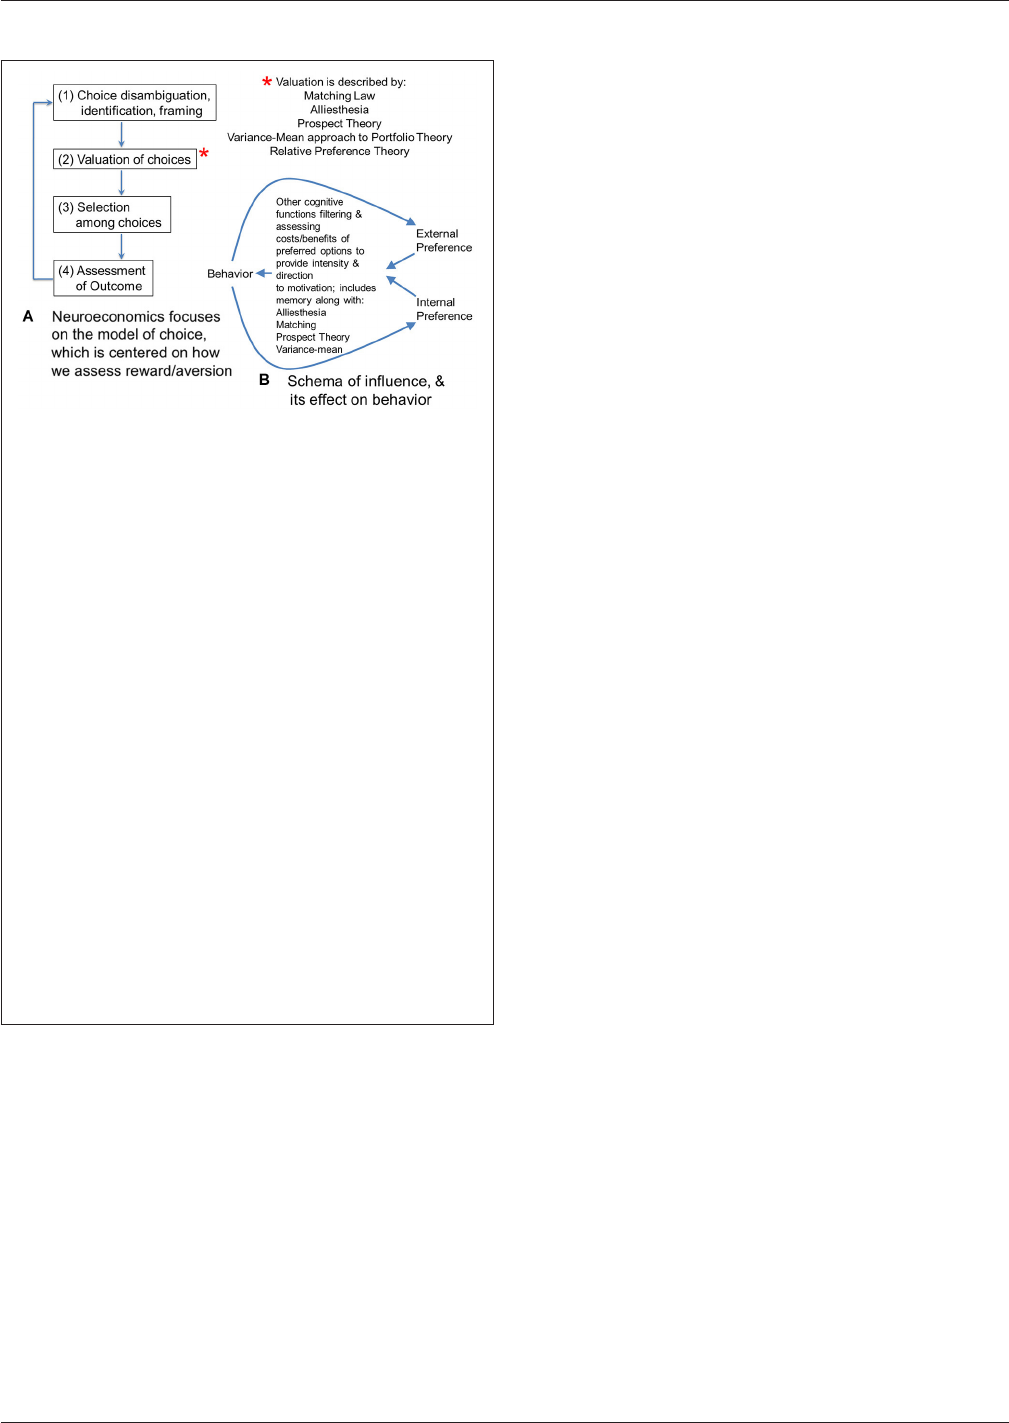
Breiter et al. Redefining neuromarketing as an integrated science of influence
FIGURE 1 | (A) Neuroeconomics focuses on the model of choice, which is
centered on how we assess reward/aversion. This flow diagram shows four
steps involved in making a choice. For the second step, there are several
theories that have been proposed to model valuation of choices. Matching
theory and alliesthesia (hedonic deficit theory) are two theories heavily
used in neuroscience. Prospect and portfolio theory are used in economics.
All four theories have been used in neuroeconomics. New to the set of
valuation theories is relative preference theory (RPT) that is the only
valuation theory meeting Feynman criteria for lawfulness, using an
information variable, or actually scaling from group to individual behavior.
Because of this scaling across group and individual behavior, and the fact it
can be framed as a power law, RPT actually encodes the fundamental
features of the other four theories, and can be used to ground them or even
derive them. (B) In contrast to economics and neuroeconomics with their
focus on choice, marketing is focused on “influence”, which looks at how
distributions of choice behavior can be shifted or altered. This diagram
sketches one potential model for the effect of influence on behavior.
Influence can be considered the difference in gradients for preference
inside a person (or organism) and outside a person. These gradients of
preference might be schematized by RPT. They would be filtered and
processed by valuation functions mentioned in panel (A), which include
alliesthesia or hedonic deficit theory regarding what is in deficit for an
individual, along with matching, prospect theory, and the variance mean
approach to portfolio theory. This processing would facilitate integration of
the gradient inputs and determine what goal-objects or events become the
focus of behavior, along with providing the intensity for it. Other cognitive
functions such as memory are critical to this processing and evaluation of
relative costs/benefits to prospective behavior; together they give behavior
its direction and intensity. Behavior, in turn, feeds back onto these internal
and external gradients of preference as experienced utility of expressed
behavior.
(Figure 1A; Camerer, 2008). This focus on choice is dis-
tinct from the focus in neuromarketing on the issue of how
individuals and groups might be shifted from one pattern of
decisions to another pattern, or to change their distribution of
choices.
Much neuromarketing research to this point has been focused
on optimal methods to shift the distribution of choices (e.g.,
Ambler et al., 2004; McClure et al., 2004; Ohme et al., 2009; Santos
et al., 2011). The use of “neuro” as a prefix has thus followed a
similar rationale to that of neuroeconomics, whereby study of the
neural processes provides a tool for describing behavioral change
that was not available by the study of behavior alone (Ariely and
Berns, 2010).
Such a view of neuromarketing ignores the broader perspective
on what might be called “influence”, which is the primary issue
involved with marketing, advertising, engineering design, teach-
ing, or behavioral change in medicine. All of these categories of
“influence” focus on how to get people to engage in a behavior
preferred by a corporation, government, trade-group, culture or
other entity. From an ethical perspective, discussions regarding
consumer rights, for example privacy, are key when considering
the influencing of behavior by interest groups, and neuromarket-
ing research has been a subject of some interest in this regard (e.g.,
Murphy et al., 2008; Wilson et al., 2008). Nonetheless, influence
doesn’t just shift the distribution of choices to one favored by
the interest group in question, but balances between internal
and external forces on behavior. Influence might be considered
a balance between gradients of preference within an individual
or group that influence events outside of them, and gradients of
preference outside the individual or group that influence events
inside of them.
Such gradients of preference could be schematized by patterns
of approach and avoidance decisions (i.e., the distribution of
choice) as described by relative preference theory (RPT; Breiter
and Kim, 2008; Kim et al., 2010), an empirically-based account
of reward/aversion resembling prospect theory (Kahneman and
Tversky, 1979; Breiter et al., 2001) but grounded in informa-
tion theory (Shannon and Weaver, 1949) to account for pat-
terns in decisions that can be connected to reward/aversion
circuitry and genetic polymorphisms (e.g., Perlis et al., 2008;
Gasic et al., 2009). Using RPT, internal and external gradients
of preference would involve variables quantifying (a) the pat-
tern of approach decisions; and (b) the pattern of avoidance
decisions. In the case of internal preferences, these would char-
acterize the individual, whereas in the case of external prefer-
ences these might characterize a group of people external to
the individual (or a preference gradient from just one other
external person). RPT allows individual and group preferences
to be readily characterized in a quantitative, lawful fashion
that scales between individual and group. The integration of
internal (e.g., individual) and external (e.g., group) gradients
of preference would then be given direction in distinct deci-
sion/planning/problem solving situations by the processes briefly
schematized in Figures 1A,B. Gradients of preference given direc-
tion by hedonic deficit theory (i.e., alliesthesia; Cabanac, 1971;
Paulus, 2007) and other valuation processes (necessary for incor-
porating probabilities related to goal-objects, Kahneman and
Tversky, 1979; relative valuations across goal-objects, Herrnstein,
1961; and variance in valuation, Markowitz, 1952) would consti-
tute the combined intrinsic and extrinsic motivation described
by Deci and Ryan (1985), leading to behavior, which in turn
feeds back into gradients of preferences based on the experi-
enced utility in individuals involved (see Kahneman et al., 1997).
Such a schema is shown in Figure 1B as one of many pos-
sibilities for how internal and external gradients are balanced
through their effects on behavior, and can shift distributions of
choice.
In considering the balance between internal and external pref-
erence, cognitive processes thought to be separate from that of the
valuation of options come into play, such as perception, attention,
Frontiers in Human Neuroscience www.frontiersin.org February 2015 | Volume 8 | Article 1073 |
35
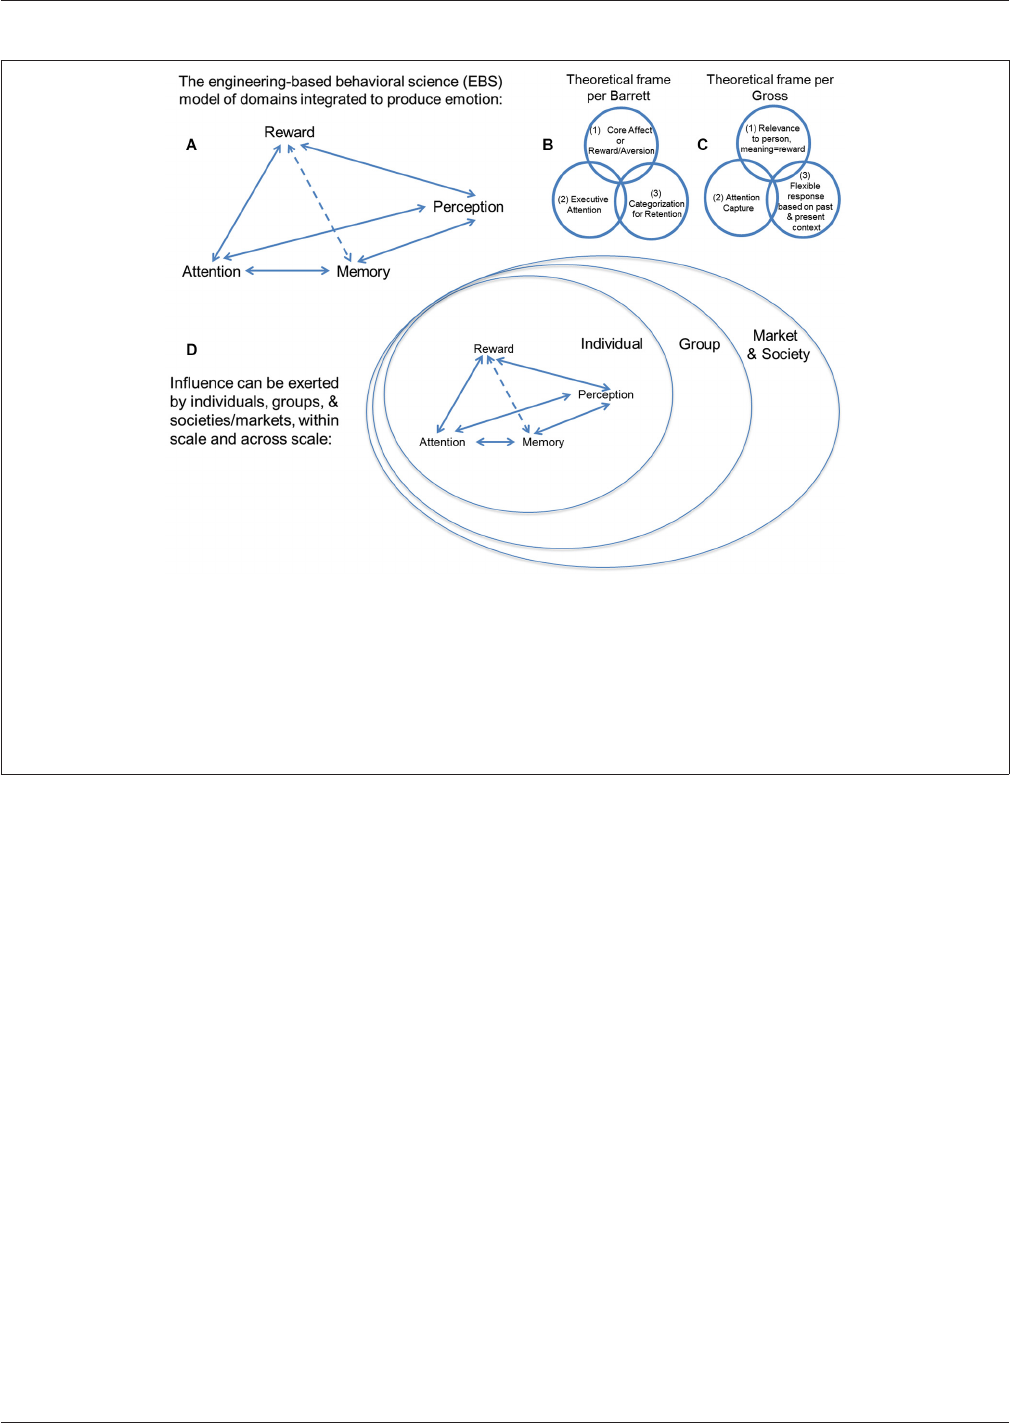
Breiter et al. Redefining neuromarketing as an integrated science of influence
FIGURE 2 | (A) This schema describes an engineering-based behavioral
science (EBS) model of psychological domains that can be integrated in
accordance with existing non- engineering-based models of emotion. Unlike
other frameworks, EBS evaluates mathematical, law-like relationships
between cognitive domains such as (i) reward/aversion processing, (ii)
attention, (iii) memory, and (iv) perception, rather than associative
relationships based purely on statistics. There are a number of modern
theoretical constructs for emotion, including two examples shown from work
by (B) Barrett and (C) Gross, and they tend to include the components we
suggest integrating through EBS. (D) Individuals, groups, and/or
societies/markets can exert “influence” to shift distributions of choice
behavior in others. This expression of “influence” can be exerted within scale
and across scale (e.g., by a group on an individual). Neuromarketing uses the
valuation aspect of neuroeconomics (i.e., reward/aversion processing) and
tries to integrate it with other behavioral science and neuroscience
constructs, such as attention, memory and perception, which are all
components of the EBS model. It tries to do this at the level of the individual,
the group, and society, which are each different scales of measure.
and memory (Ioannides et al., 2000; Ariely and Berns, 2010). At
this time, no theoretical schema and little empirical data exist for
how these theoretically independent cognitive processes interact,
but cognitive processes for perception of outside stimuli exerting
influence, attention to their features, and memory for comparison
of such features to prior percepts are necessary operations for
processing “influence”. Exerting “influence” to change another’s
behavior, or being the subject of outside “influence” to change
your own behavior thus need to be considered in a much broader
construct of mental operations (see Figure 2A). One must also
recognize that this ensemble of operations (i.e., perception, atten-
tion, memory, reward/aversion processing) have been extensively
theorized to be core processes for emotion (Breiter and Gasic,
2004; Barrett, 2006; Gross, 2009, 2013; Kuppens et al., 2013;
Lindquist et al., 2013). Specific examples of this are schematized
in Figures 2B,C for the models of Barrett (2006) and Gross (2009,
2013).
The balance between internal and external forces on behav-
ior (e.g., respectively, internal emotional experience (or inter-
nal preference gradient) vs. emotional expression by entities
outside the individual (or external preference gradient)) must
also be apparent at the neural level of measurement, given
that “brain and mind are one”, a fundamental hypothesis of
neuroscience (e.g., Breiter and Rosen, 1999; Breiter and Gasic,
2004; Breiter et al., 2006). This view of neuromarketing thus has
as its focus an understanding of the balance between internal
and external preferences (emotional experiences), on individ-
uals and groups. Neural measures of one individual or inter-
acting individuals (e.g., as with joint trust games; King-Casas
et al., 2005; Tomlin et al., 2006) can be made in parallel
with behavioral ones to confirm that observations made at the
behavioral level affect those at other levels of spatiotemporal orga-
nization, or actually scale across levels of spatiotemporal orga-
nization (i.e., group behavior, individual behavior, distributed
neural groups, neural group, etc.). Influence can thus be thought
of as being present across multiple spatiotemporal levels of
measurement, from group measures to measures of individual
behavior to neural groups, etc. The issue of scaling might be
considered as a “layering of influence” and warrants further
discussion.
LAYERS OF INFLUENCE AND COMMUNITIES AFFECTED
Scaling is rarely discussed in experimental psychology and other
behavioral disciplines, and was not formally introduced into
behavioral science and neuroscience until the 1990s by Sutton
and Breiter (1994). In its adaptation to biology and behavior,
scaling refers to how measures made at one level of spatiotemporal
organization, relate in a principled, lawful manner to measures at
Frontiers in Human Neuroscience www.frontiersin.org February 2015 | Volume 8 | Article 1073 |
36

Breiter et al. Redefining neuromarketing as an integrated science of influence
other spatiotemporal levels of organization (Sutton and Breiter,
1994; Perelson et al., 2006; Savage and West, 2006). This rela-
tionship does not represent a statistical one where a certain
amount of the variance at one level of measure can predict the
variance at another level, or how some information at one layer of
organization can specify some extent of information at another
layer (Adami, 2004; Szostak, 2004). Instead, it is causal (i.e.,
mechanistic) in that the same patterns of behavior measured at
one layer are also measured at a neighboring level, and there is
a necessary relationship (Sutton and Breiter, 1994; Breiter and
Gasic, 2004; Breiter et al., 2006). Given that it has not been a
major topic in behavior science or neuroscience, few biological
measures have yet been shown to scale. One behavior that does
show scaling is that of circadian rhythms, which show measures
that scale from behavior to distributed groups of neurons to
individual neural groups to cells and molecular biology. The other
is approach/avoidance behavior described by RPT, scaling from
group behavior to individual behavior, and potentially to other
scales (Breiter and Kim, 2008; Kim et al., 2010). To date, few
behavioral constructs outside of RPT have been tested to Feynman
criteria for lawfulness, which includes scaling (Feynman et al.,
1963).
Scaling has become an important metaphor/analogy in con-
sidering the statistical association of measures made at one
spatiotemporal scale vs. another, as with the Research Domain
Criteria project (RDoC) sponsored out of the National Institutes
of Health (NIMH; Insel et al., 2010; Morris and Cuthbert, 2012;
Cuthbert and Insel, 2013). The RDoC project and projects spon-
sored out of the National Institutes of Health Connectome Project
(Van Essen et al., 2012; Barch et al., 2013) focus on measures at
different spatiotemporal scales that can predict some degree of
variance in each other. Both the RDoC and Connectome projects
are directly modeled after the Phenotype Genotype Project in
Addiction and Mood Disorders (PGP),
2
which successfully dis-
covered measures that scale across levels (i.e., RPT; Breiter and
Kim, 2008; Kim et al., 2010).
While scaling is a sine qua non of classical science across lev-
els of spatiotemporal organization, constructs that have become
fundamental to more contemporary approaches to science have
also become active considerations in neuroscience, in particular
the issue of uncertainty (Kahneman and Tversky, 1979; Knill and
Pouget, 2004; Gallistel and King, 2009; Kim et al., 2010; Vilares
and Kording, 2011). Scaling and uncertainty are of interest with
regard to neuromarketing, in that there is a common intuition
that influence occurs between individuals, between individuals
and a group, and between groups. As schematized in Figure 2D,
influence is thought to occur in the interaction between individ-
uals, who are embedded within groups, so that they affect their
respective groups, and the larger framework (e.g., society, market)
in which that group exists. This embedding of individuals/groups
can be directly analogized to the embedding of networks (Sutton
and Breiter, 1994).
2
Lawler, A. “White house stirs interest in brain-imaging initiative”, Science,
News, August 2, 2002; Abbott A. “Addicted”, Nature’s Senior European
Correspondent, Nature, News Feature, October 31, 2002; and http://pgp.
mgh.harvard.edu
This model of influence across scales of organization (e.g.,
individual, group, society/market) also relates to issues of
uncertainty due to information loss in the communication
between individuals/groups, or the uncertainty related to impre-
cision in the interpretation of communicated emotions (e.g.,
Figures 2B–D). Characterizing influence by scaling and uncer-
tainty has some appeal, but begs the issue of what influence is in
this context. When one considers influence in this model, it comes
across as resembling a field of sorts, with a gradient of effects
as two entities wielding influence come in greater proximity
to each other (Figure 1B). To date, there has been no formal
definition of influence, either through axiomatic derivation, or
through iterative modeling (Banks and Tran, 2011) of behavior
data to show a specific mathematical formulation of a pattern
in a graph. Such work is clearly needed, and likely will depend
on the cognitive processes identified to underlie this “field”
of influence, such as those involved with emotion, discussed
previously.
One might consider influence, and its potential scaling and
effects of uncertainty, as a product of human psychology and
the sub-processes underlying human information processing.
Such considerations point to the importance of having a com-
plete model of mental functioning, which is as yet lacking.
Neuromarketing investigations can have a major input into the
development of this integrated model, if they are conducted
from a consistent and coherent theoretical base as discussed
herein.
BASING INFLUENCE ON AN INTEGRATED MODEL OF
MENTAL FUNCTION
At this time, we have no unified model of the mind, which
shows how sub-processes such as attention, memory and
reward/aversion processing are integrated and function concur-
rently for decision-making, planning, and problem solving. When
one opens any cognitive science/biological psychology textbook,
one finds chapters on information theory, perception, attention,
decision-making, etc., but nothing integrating them. Even the use
of the term information theory—although considered the basis of
cognitive science—was never used in its mathematical framework
in cognitive science until approximately 4–6 years ago (Breiter
and Kim, 2008; Tononi, 2008; Gallistel and King, 2009; Kim et al.,
2010). For the most part, marketers have relied on thinking about
judgment and decision-making in terms of cognitive biases and
mental functions involved with choice.
Recently, attention has been given to the building of such
an integrated model of mental processing, starting with efforts
to look at the input end of cognitive function, and to consider
how quantitative descriptions of processes for reward/aversion,
attention, and memory might work together. This work has
led to research (Viswanathan et al., Under review) integrating
parts of RPT (representing reward/aversion) with variables from
signal detection theory (representing attention), and combining
signal detection theory with Ebbinghaus memory functions to
unpack sub-processes mediating working memory (Reilly et al.,
Under review). This early work argues that cognitive science
constructs can be integrated, and points to the large amount of
work needed to develop a comprehensive merger of domains in
Frontiers in Human Neuroscience www.frontiersin.org February 2015 | Volume 8 | Article 1073 |
37

Breiter et al. Redefining neuromarketing as an integrated science of influence
cognitive science, including domains such as decision-making,
planning, and problem solving, along with output of the sys-
tem in terms of motor behavior, language, and autonomic
functions.
The ultimate integration of these cognitive functions can be
analogized to a wall chart in biochemistry where all chemical
pathways underlying biological metabolism are organized. We
are a long way from having such an integrated platform for
mental operations, particularly since such integrated systems as
in biochemistry also convey mechanism and allow causal infer-
ence. In the short term, the viability of such an effort can start
with developing complete constructs for attention, memory, and
reward/aversion processing. Complete constructs for attention,
for instance, would necessitate the mathematical description of
the relationship between focused, selective, sustained, divided,
and alternating attention. The potential for such complete con-
structs to be integrated across functions (i.e., perception, atten-
tion, memory, and reward/aversion processing) would then be
a necessary second step in testing the viability of developing a
general model of the mind.
Development of such a general model of mental function
would allow us to theorize and empirically test what set of
functions together respond to influence from another individ-
ual/organism, and exert influence on individuals/organisms out-
side of the person. With an integration of, at minimum, the
functions thought to comprise emotion and memory thereof,
cognitive psychology would likely be able to begin defining a
quantitative model of influence. Such an effort will also depend
on parallel assessments of the integrated cognitive model through
approaches that (1) assess how well the integrated cognitive con-
struct fits with neuroscience measures; (2) determine if impor-
tant features of the construct can be derived axiomatically (an
approach used extensively in traditional economics); and (3) test
if the integrated cognitive construct facilitates the analysis of large
data sets of human consumption and media use (referred to
as “big data”), which should show features of human cognitive
function.
Even so, efforts devoted towards developing neuromarketing
as a science of influence, and towards a general model of mental
function must remain cognizant of the risks inherent in such
research, particularly given the persuasiveness of brain imaging
(Roskies, 2008). Such risks are well covered in other founda-
tional literature (e.g., Senior et al., 2011), but it is worth noting
here that the subtractive and reverse inferential methodologies—
predicated on observing specific brain region activity associated
with specific tasks—are unable to conclusively confirm either
the necessity of that specific region for that specific task, nor
the lack of involvement of other regions, particularly in complex
tasks (Friston et al., 1996; Poldrack, 2006, 2008). Confounds can
also arise in neuroscientific studies of behavioral change (i.e.,
influence). It is a mistake to assume that one wants changes
in both behavior and brain signal to interpret the effect of any
influence. Such circumstances only lend themselves to interpre-
tation when there is a parametric variation in both variables,
which in turn can lead to a power problem. Rather, it is usu-
ally preferable for variables in either behavior or neuroimaging
change, assuming the (often unrecognized) issue that baseline
or comparative conditions remain unchanged also. Similarly,
one must control for hormonal and demographic variables,
which have been shown to influence key neuroimaging variables
(Goldstein et al., 2005, 2010; Breiter et al., 2006). A final caveat
is that we still do not understand the processes by which dis-
tributed groups of cells “process information” (e.g., Freeman,
2001). The functional domains of biochemistry, molecular biol-
ogy, and genetics are quite distinct from those we hypothesize
for behavior (e.g., attention, memory, reward/aversion process-
ing, etc.), and how distributed neural groups produce functional
domains and interact is far from understood. As such, all neural
signals must be looked at as providing ancillary support for
measures made at other spatiotemporal scales (e.g., behavior or
genetics).
There also remain key issues in the use of “big data”
approaches to neuromarketing. In particular, the high-
dimensionality and huge size of data sets in this context can
lead to inferential problems of their own—particularly spurious
correlations, noise accumulation, and incidental homogeneity
(e.g., Fan and Fan, 2008; Fan et al., 2013). The often uncontrolled
and naturalistic collection of such data sets also has the potential
to raise issues of public interest regarding the ethics of social
research (e.g., Kramer et al., 2014). That said, as long as
researchers approach their work in light of such caveats, big
data provides opportunities for neuromarketing as a science
of influence, in particular due to (i) its cohort sizes; (ii) its
attention to demographic and socio-economic variables; and (iii)
its broad array of variables that can be aligned to neuroscience
variables.
SUMMARY
This manuscript provides a theoretical framework for neuro-
marketing based on the process of influence, and how it shifts
distributions of choice across many scales of measurement,
from individual to group/market and society. As opposed to
issues of choice, issues of influence encompass a broader array
of behavioral science domains, pointing to the importance of
developing a rigorous quantitative model of mental function,
which can provide testable hypotheses for how distributions
of choice are shifted across scale and within scale (i.e., from
individuals to groups/market to society and back again). How-
ever, a tremendous amount of work is needed to get to this
point, and this work will need to meet the highest of aca-
demic standards if it is to change standards of practice and have
real relevance for the marketing community and those involved
with influence or behavior change, whether that be in educa-
tion, medicine, business, marketing communications, design, or
political policy.
ACKNOWLEDGMENTS
This work was supported by grants to Hans C. Breiter (#14118,
026002, 026104, 027804) from the NIDA, Bethesda, MD, USA
and grants (DABK39-03-0098 and DABK39-03-C-0098; The Phe-
notype Genotype Project in Addiction and Mood Disorder)
from the Office of National Drug Control Policy—Counterdrug
Technology Assessment Center, Washington, DC, USA. Fur-
ther support was provided to Hans C. Breiter by the Warren
Frontiers in Human Neuroscience www.frontiersin.org February 2015 | Volume 8 | Article 1073 |
38

Breiter et al. Redefining neuromarketing as an integrated science of influence
Wright Adolescent Center at Northwestern Memorial Hospital
and Northwestern University, Chicago, IL, USA. Support was also
provided by a grant to Anne J. Blood (#052368) from NINDS,
Bethesda, MD, USA. The funders had no role in study design, data
collection and analysis, decision to publish, or preparation of the
manuscript. Lastly, the authors wish to thank Charles N Rudick,
PhD for his critical commentary on the manuscript.
REFERENCES
Adami, C. (2004). Information theory in molecular biology. Phys. Life Rev. 1, 3–22.
doi: 10.1016/j.plrev.2004.01.002
Ambler, T., Braeutigam, S., Stins, J., Rose, S., and Swithenby, S. (2004). Salience
and choice: neural correlates of shopping decisions. Psychol. Mark. 21, 247–261.
doi: 10.1002/mar.20004
Ariely, D., and Berns, G. S. (2010). Neuromarketing: the hope and hype of
neuroimaging in business. Nat. Rev. Neurosci. 11, 284–292. doi: 10.1038/
nrn2795
Banks, H. T., and Tran, H. T. (2011). Mathematical and Experimental Modeling of
Physical and Biological Processes. Boca Raton, FL: CRC Press.
Barch, D. M., Burgess, G. C., Harms, M. P., Petersen, S. E., Schlaggar, B. L., Corbetta,
M., et al. (2013). Function in the human connectome: task-fMRI and individual
differences in behavior. Neuroimage 80, 169–189. doi: 10.1016/j.neuroimage.
2013.05.033
Barrett, L. F. (2006). Solving the emotion paradox: categorization and the expe-
rience of emotion. Pers. Soc. Psychol. Rev. 10, 20–46. doi: 10.1207/s1532
7957pspr1001_2
Braeutigam, S. (2005). Neuroeconomics—From neural systems to economic
behaviour. Brain Res. Bull. 67, 355–360. doi: 10.1016/j.brainresbull.2005.
06.009
Breiter, H. C., Aharon, I., Kahneman, D., Dale, A., and Shizgal, P. (2001). Functional
imaging of neural responses to expectancy and experience of monetary gains
and losses. Neuron 30, 619–639. doi: 10.1016/s0896-6273(01)00303-8
Breiter, H., and Gasic, G. (2004). “A general circuitry processing reward/aversion
information and its implications for neuropsychiatric illness,” in The Cognitive
Neurosciences III, ed M. Gazzaniga (Cambridge: MIT Press), 1043–1065.
Breiter, H. C., Gasic, G. P., and Makris, N. (2006). “Imaging the neural systems
for motivated behavior and their dysfunction in neuropsychiatric illness,” in
Complex Systems Science in Biomedicine, eds T. S. Deisboeck and J. Y. Kresh (New
York, NY: Springer), 763–810.
Breiter, H., and Kim, B. (2008). Recurrent and robust patterns underlying human
relative preference and associations with brain circuitry plus genetics in (U
Minn, Institute of Mathematics and its Applications). Available online at:
www.ima.umn.edu/2007-2008/W4.21-25.08/abstracts.html
Breiter, H. C., and Rosen, B. R. (1999). Functional magnetic resonance imaging of
brain reward circuitry in the human. Ann. N Y Acad. Sci. 877, 523–547. doi: 10.
1111/j.1749-6632.1999.tb09287.x
Cabanac, M. (1971). Physiological role of pleasure. Science 173, 1103–1107. doi: 10.
1126/science.173.4002.1103
Camerer, C. F. (2008). Neuroeconomics: opening the gray box. Neuron 60, 416–419.
doi: 10.1016/j.neuron.2008.10.027
Cuthbert, B. N., and Insel, T. R. (2013). Toward the future of psychiatric diagnosis:
the seven pillars of RDoC. BMC Med. 11:126. doi: 10.1186/1741-7015-11-126
Deci, E. L., and Ryan, R. M. (1985). Intrinsic Motivation and Self-Determination in
Human Behavior. New York and London: Plenum, p. 371.
Fan, J., and Fan, Y. (2008). High-dimensional classification using features annealed
independence rules. Ann. Stat. 36, 2605–2637. doi: 10.1214/07-aos504
Fan, J., Han, F., and Liu, H. (2013). Challenges of big data analysis. arXiv:1308.1479
[stat]. Available online at: http://arxiv.org/abs/1308.1479. Accessed on April 30,
2014.
Feynman, R. P., Leighton, R. B., and Sands, M. (1963). The Feynman Lectures
on Physics, BD 1: Mainly Mechanics, Radiation and Heat. Redwood City, CA:
Addison-Wesley.
Fisher, C. E., Chin, L., and Klitzman, R. (2010). Defining neuromarketing: prac-
tices and professional challenges. Harv. Rev. Psychiatry 18, 230–237. doi: 10.
3109/10673229.2010.496623
Freeman, W. (2001). How Brains Make Up Their Minds. New York: Columbia
University Press.
Friston, K. J., Price, C. J., Fletcher, P., Moore, C., Frackowiak, R. S., and Dolan, R. J.
(1996). The trouble with cognitive subtraction. Neuroimage 4, 97–104. doi: 10.
1006/nimg.1996.0033
Fugate, D. L. (2007). Neuromarketing: a layman’s look at neuroscience and its
potential application to marketing practice. J. Consum. Mark. 24, 385–394.
doi: 10.1108/07363760710834807
Gallistel, C. R., and King, A. P. (2009). Memory and the Computational Brain: Why
Cognitive Science Will Transform Neuroscience. UK: John Wiley & Sons.
Gasic, G. P., Smoller, J. W., Perlis, R. H., Sun, M., Lee, S., Kim, B. W., et al.
(2009). BDNF, relative preference and reward circuitry responses to emotional
communication. Am. J. Med. Genet. B Neuropsychiatr. Genet. 150B, 762–781.
doi: 10.1002/ajmg.b.30944
Goldstein, J. M., Jerram, M., Abbs, B., Whitfield-Gabrieli, S., and Makris, N.
(2010). Sex differences in stress response circuitry activation dependent on
female hormonal cycle. J. Neurosci. 30, 431–438. doi: 10.1523/jneurosci.3021-09.
2010
Goldstein, J. M., Jerram, M., Poldrack, R., Ahern, T., Kennedy, D. N., Seidman,
L. J., et al. (2005). Hormonal cycle modulates arousal circuitry in women using
functional magnetic resonance imaging. J. Neurosci. 25, 9309–9316. doi: 10.
1523/jneurosci.2239-05.2005
Gross, J. J. (2009). Handbook of Emotion Regulation. New York, NY: Guilford Press.
Gross, J. J. (2013). Emotion regulation: taking stock and moving forward. Emotion
13, 359–365. doi: 10.1037/a0032135
Herrnstein, R. J. (1961). Relative and absolute strength of response as a function of
frequency of reinforcement. J. Exp. Anal. Behav. 4, 267–272. doi: 10.1901/jeab.
1961.4-267
Hubert, M., and Kenning, P. (2008). A current overview of consumer neuroscience.
J. Consum. Behav. 7, 272–292. doi: 10.1002/cb.251
Insel, T., Cuthbert, B., Garvey, M., Heinssen, R., Pine, D. S., Quinn, K., et al. (2010).
Research domain criteria (RDoC): toward a new classification framework for
research on mental disorders. Am. J. Psychiatry 167, 748–751. doi: 10.1176/appi.
ajp.2010.09091379
Ioannides, A. A., Liu, L., Theofilou, D., Dammers, J., Burne, T., Ambler, T.,
et al. (2000). Real time processing of affective and cognitive stimuli in the
human brain extracted from MEG signals. Brain Topogr. 13, 11–19. doi: 10.
1023/A:1007878001388
Javor, A., Koller, M., Lee, N., Chamberlain, L., and Ransmayr, G. (2013). Neu-
romarketing and consumer neuroscience: contributions to neurology. BMC
Neurol. 13:13. doi: 10.1186/1471-2377-13-13
Kahneman, D. (2011). Thinking, Fast and Slow. New York, NY: Macmillan.
Kahneman, D., and Tversky, A. (1979). Prospect theory: an analysis of decision
under risk. Econometrica. 47, 263–292. doi: 10.2307/1914185
Kahneman, D., Wakker, P. P., and Sarin, R. (1997). Back to bentham? Explorations
of experienced utility. Q. J. Econ. 112, 375–406. doi: 10.1162/0033553975
55235
Kim, B. W., Kennedy, D. N., Lehár, J., Lee, M. J., Blood, A. J., Lee, S., et al.
(2010). Recurrent, robust and scalable patterns underlie human approach and
avoidance. PLoS One 5:e10613. doi: 10.1371/journal.pone.0010613
King-Casas, B., Tomlin, D., Anen, C., Camerer, C. F., Quartz, S. R., and Montague,
P. R. (2005). Getting to know you: reputation and trust in a two-person
economic exchange. Science 308, 78–83. doi: 10.1126/science.1108062
Knill, D. C., and Pouget, A. (2004). The Bayesian brain: the role of uncertainty
in neural coding and computation. Trends Neurosci. 27, 712–719. doi: 10.1016/
j.tins.2004.10.007
Kramer, A., Guillory, J., and Hancock, J. (2014). Experimental evidence of massive-
scale emotional contagion through social networks. Proc. Natl. Acad. Sci. U S A
111, 8788–8790. doi: 10.1073/pnas.1320040111
Kuppens, P., Tuerlinckx, F., Russell, J. A., and Barrett, L. F. (2013). The relation
between valence and arousal in subjective experience. Psychol. Bull. 139, 917–
940. doi: 10.1037/a0030811
Laybourne, P., and Lewis, D. (2005). Neuromarketing: the future of consumer
research. Admap 13, 28–30.
Lee, N., Broderick, A. J., and Chamberlain, L. (2007). What is “neuromarketing”?
A discussion and agenda for future research. Int. J. Psychophysiol. 63, 199–204.
doi: 10.1016/j.ijpsycho.2006.03.007
Lindquist, K. A., Siegel, E. H., Quigley, K. S., and Barrett, L. F. (2013). The hundred-
year emotion war: Are emotions natural kinds or psychological constructions?
Comment on Lench, Flores, and Bench (2011). Psychol. Bull. 139, 255–263.
doi: 10.1037/a0029038
Frontiers in Human Neuroscience www.frontiersin.org February 2015 | Volume 8 | Article 1073 |
39

Breiter et al. Redefining neuromarketing as an integrated science of influence
Markowitz, H. (1952). Portfolio selection
∗
. J. Finance 7, 77–91. doi: 10.1111/j.1540-
6261.1952.tb01525.x
McClure, S. M., Li, J., Tomlin, D., Cypert, K. S., Montague, L. M., and Montague,
P. R. (2004). Neural correlates of behavioral preference for culturally familiar
drinks. Neuron 44, 379–387. doi: 10.1016/j.neuron.2004.09.019
Morris, S. E., and Cuthbert, B. N. (2012). Research domain criteria: cognitive
systems, neural circuits and dimensions of behavior. Dialogues Clin. Neurosci.
14, 29–37.
Murphy, E. R., Illes, J., and Reiner, P. B. (2008). Neuroethics of neuromarketing. J.
Consum. Behav. 7, 293–302. doi: 10.1002/cb.252
Ohme, R., Reykowska, D., Wiener, D., and Choromanska, A. (2009). Analysis
of neurophysiological reactions to advertising stimuli by means of EEG and
galvanic skin response measures. J. Neurosci. Psychol. Econ. 2, 21–31. doi: 10.
1037/a0015462
Paulus, M. P. (2007). Decision-making dysfunctions in psychiatry—altered home-
ostatic processing? Science 318, 602–606. doi: 10.1126/science.1142997
Perelson, A. S., Bragg, J. G., and Wiegel, F. W. (2006). “The complexity of the
immune system: scaling laws,” in Complex Systems Science in Biomedicine, eds
T. S. Deisboeck and J. Y. Kresh (New York: Springer), 451–459.
Perlis, R. H., Holt, D. J., Smoller, J. W., Blood, A. J., Lee, S., Kim, B. W., et al.
(2008). Association of a polymorphism near CREB1 with differential aversion
processing in the insula of healthy participants. Arch. Gen. Psychiatry 65, 882–
892. doi: 10.1001/archgenpsychiatry.2008.3
Plassmann, H., Ramsøy, T. Z., and Milosavljevic, M. (2012). Branding the brain:
a critical review and outlook. J. Consum. Psychol. 22, 18–36. doi: 10.1016/
j.jcps.2011.11.010
Poldrack, R. A. (2006). Can cognitive processes be inferred from neuroimaging
data? Trends Cogn. Sci. 10, 59–63. doi: 10.1016/j.tics.2005.12.004
Poldrack, R. A. (2008). The role of fMRI in cognitive neuroscience: where do we
stand? Curr. Opin. Neurobiol. 18, 223–227. doi: 10.1016/j.conb.2008.07.006
Roskies, A. L. (2008). Neuroimaging and inferential distance. Neuroethics 1, 19–30.
doi: 10.1007/s12152-007-9003-3
Santos, J. P., Seixas, D., Brandão, S., and Moutinho, L. (2011). Investigating the
role of the ventromedial prefrontal cortex in the assessment of brands. Front.
Neurosci. 5:77. doi: 10.3389/fnins.2011.00077
Savage, V. M., and West, G. B. (2006). “Biological scaling and physiological time,”
in Complex Systems Science in Biomedicine, eds T. S. Deisboeck and Y. J. Kresh
(New York: Springer), 141–163.
Senior, C., and Lee, N. (2008). Editorial: a manifesto for neuromarketing science. J.
Consum. Behav. 7, 263–271. doi: 10.1002/cb.250
Senior, C., Lee, N., and Butler, M. (2011). Organizational cognitive neuroscience.
Organ. Science 22, 804–815. doi: 10.1287/orsc.1100.0532
Shannon, C. E., and Weaver, W. (1949). The Mathematical Theory of Communica-
tion Volume 1. Illinois: University of Illinois Press.
Sutton, J., and Breiter, H. (1994). Neural scale invariance: an integrative model with
implications for neuropathology. World Congr. Neural Netw. 4, 667–672.
Szostak, R. (2004). Classifying Science: Phenomena, Data, Theory, Method, Practice
(Vol. 7). Dordrecht: Springer.
Tomlin, D., Kayali, M. A., King-Casas, B., Anen, C., Camerer, C. F., Quartz, S. R.,
et al. (2006). Agent-specific responses in the cingulate cortex during economic
exchanges. Science 312, 1047–1050. doi: 10.1126/science.1125596
Tononi, G. (2008). Consciousness as integrated information: a provisional mani-
festo. Biol. Bull. 215, 216–242. doi: 10.2307/25470707
Van Essen, D. C., Ugurbil, K., Auerbach, E., Barch, D., Behrens, T. E.,
Bucholz, R., et al. (2012). The human connectome project: a data acqui-
sition perspective. Neuroimage 62, 2222–2231. doi: 10.1016/j.neuroimage.
2012.02.018
Vecchiato, G., Astolfi, L., De Vico Fallani, F., Toppi, J., Aloise, F., Bez, F., et al. (2011).
On the use of EEG or MEG brain imaging tools in neuromarketing research.
Comput. Intell. Neurosci. 2011:643489. doi: 10.1155/2011/643489
Vilares, I., and Kording, K. (2011). Bayesian models: the structure of the world,
uncertainty, behavior and the brain. Ann. N Y Acad. Sci. 1224, 22–39. doi: 10.
1111/j.1749-6632.2011.05965.x
Wilson, R. M., Gaines, J., and Hill, R. P. (2008). Neuromarketing and consumer free
will. J. Consum. Aff. 42, 389–410. doi: 10.1111/j.1745-6606.2008.00114.x
Conflict of Interest Statement: The authors declare that the research was conducted
in the absence of any commercial or financial relationships that could be construed
as a potential conflict of interest.
Received: 01 May 2014; accepted: 29 December 2014; published online: 12 February
2015.
Citation: Breiter HC, Block M, Blood AJ, Calder B, Chamberlain L, Lee N, Livengood
S, Mulhern FJ, Raman K, Schultz D, Stern DB, Viswanathan V and Zhang FZ
(2015) Redefining neuromarketing as an integrated science of influence. Front. Hum.
Neurosci. 8:1073. doi: 10.3389/fnhum.2014.01073
This article was submitted to the journal Frontiers in Human Neuroscience.
Copyright © 2015 Breiter, Block, Blood, Calder, Chamberlain, Lee, Livengood,
Mulhern, Raman, Schultz, Stern, Viswanathan and Zhang. This is an open-access
article distributed under the terms of the Creative Commons Attribution License (CC
BY). The use, distribution and reproduction in other forums is permitted, provided
the original author(s) or licensor are credited and that the original publication in this
journal is cited, in accordance with accepted academic practice. No use, distribution or
reproduction is permitted which does not comply with these terms.
Frontiers in Human Neuroscience www.frontiersin.org February 2015 | Volume 8 | Article 1073 |
40

ORIGINAL RESEARCH
published: 30 April 2015
doi: 10.3389/fnhum.2015.00176
Age-related striatal BOLD changes
without changes in behavioral loss
aversion
Vijay Viswanathan
1,2†
, Sang Lee
3,4,5‡
, Jodi M. Gilman
3‡
, Byoung Woo Kim
2,3,4,5‡
, Nick
Lee
2,6‡
, Laura Chamberlain
2,6‡
, Sherri L. Livengood
2,4‡
, Kalyan Raman
1,2,4,7$
, Myung Joo
Lee
2,3,4,5$
, Jake Kuster
3,5$
, Daniel B. Stern
2,4$
and Bobby Calder
2,7‡
, Frank J. Mulhern
1,2‡
,
Anne J. Blood
2,3,5†
, Hans C. Breiter
2,3,4,5
*
†
1
Medill Integrated Marketing Communications, Northwestern University, Evanston, IL, USA,
2
Applied Neuromarketing
Consortium: Northwestern University, Wayne State University, University of Michigan, Loughborough University School of
Business and Economics (UK) and Massachusetts General Hospital/Harvard University, Chicago, IL, USA,
3
Mood and Motor
Control Laboratory or Laboratory of Neuroimaging and Genetics, Department of Psychiatry, Massachusetts General Hospital,
Boston, MA, USA,
4
Warren Wright Adolescent Center, Department of Psychiatry and Behavioral Science, Northwestern
University Feinberg School of Medicine, Chicago, IL, USA,
5
Northwestern University and Massachusetts General Hospital
Phenotype Genotype Project in Addiction and Mood Disorders, Chicago, IL, USA,
6
Marketing Group, Aston Business
School, Birmingham, UK,
7
Department of Marketing, Kellogg School of Management, Northwestern University, Evanston,
IL, USA
Edited by:
Sven Braeutigam,
University of Oxford, UK
Reviewed by:
Martin P. Paulus,
University of California San Diego,
USA
Dave J. Hayes,
University of Toronto, Canada
*Correspondence:
Hans C. Breiter,
Warren Wright Adolescent Center,
Department of Psychiatry and
Behavioral Science, Northwestern
University Feinberg School of
Medicine, 710 N. Lake Shore Dr.,
Abbott Hall 1301, Chicago, IL 60611,
USA
h-breiter@northwestern.edu
†
Joint first authorship.
‡
Joint second authorship.
$
Joint third authorship.
Received: 23 April 2014
Accepted: 15 March 2015
Published: 30 April 2015
Citation:
Viswanathan V, Lee S, Gilman JM,
Kim BW, Lee N, Chamberlain L,
Livengood SL, Raman K, Lee MJ,
Kuster J, Stern DB and Calder B,
Mulhern FJ, Blood AJ, Breiter HC
(2015) Age-related striatal BOLD
changes without changes in
behavioral loss aversion.
Front. Hum. Neurosci. 9:176.
doi: 10.3389/fnhum.2015.00176
Loss aversion (LA), the idea that negative valuations have a higher psychological
impact than positive ones, is considered an important variable in consumer research.
The literature on aging and behavior suggests older individuals may show more LA,
although it is not clear if this is an effect of aging in general (as in the continuum
from age 20 and 50 years), or of the state of older age (e.g., past age 65 years).
We also have not yet identified the potential biological effects of aging on the neural
processing of LA. In the current study we used a cohort of subjects with a 30 year
range of ages, and performed whole brain functional MRI (fMRI) to examine the ventral
striatum/nucleus accumbens (VS/NAc) response during a passive viewing of affective
faces with model-based fMRI analysis incorporating behavioral data from a validated
approach/avoidance task with the same stimuli. Our a priori focus on the VS/NAc
was based on (1) the VS/NAc being a central region for reward/aversion processing;
(2) its activation to both positive and negative stimuli; (3) its reported involvement with
tracking LA. LA from approach/avoidance to affective faces showed excellent fidelity
to published measures of LA. Imaging results were then compared to the behavioral
measure of LA using the same affective faces. Although there was no relationship
between age and LA, we observed increasing neural differential sensitivity (NDS) of the
VS/NAc to avoidance responses (negative valuations) relative to approach responses
(positive valuations) with increasing age. These findings suggest that a central region
for reward/aversion processing changes with age, and may require more activation
to produce the same LA behavior as in younger individuals, consistent with the idea
of neural efficiency observed with high IQ individuals showing less brain activation to
complete the same task.
Keywords: loss aversion, aging, nucleus accumbens, reward, fMRI, neurocompensation
Frontiers in Human Neuroscience | www.frontiersin.org April 2015 | Volume 9 | Article 176
41

Viswanathan et al. Age and loss aversion
Introduction
Age is among the most commonly used variables in marketing
and consumer research. While age is a deceptively simple
variable, the underlying construct of biological age and how it
relates to behavior is not always clear. One age effect supported
by a number of social psychology studies is that older adults
put more weight on avoiding potential negative outcomes,
as evidenced by an aversion to change (Botwinick, 1978)
and nostalgia for early experience (Schindler and Holbrook,
2003). Aging research points to an association of age with
making less risky decisions (Johnson and Busemeyer, 2010),
and suggests that older individuals generally avoid losses to
a greater extent than younger individuals (e.g., Heckhausen,
1997). A fundamental way to quantify this perspective is with
the concept of ‘‘loss aversion’’ (LA), in which negative stimuli
have a disproportionate psychological impact relative to positive
ones (Kahneman and Tversky, 1979), and can be defined
mathematically by the ratio of valuation of monetary losses
relative to valuation of gains (Tversky and Kahneman, 1991),
or in more general terms, as the ratio of avoidance to approach
measures (Abdellaoui et al., 2007). LA has become an important
variable in consumer research (Ariely et al., 2005; Paraschiv
and L’Haridon,
2008) and is consistent with the observation
that older individuals are more focused on goals pertaining to
maintenance and regulation of loss (Ebner et al., 2006). Cole et al.
(2008) suggest, based on ‘‘regulatory focus theory’’ (Avnet and
Higgins, 2006), that older individuals would be more prevention-
focused i.e., avoid losses, than promotion-focused i.e., pursuit
of gains.
Neuroscience studies have examined the biological basis
for age-related changes in cognitive function (Hedden and
Gabrieli, 2004; Mohr et al., 2010), which might affect biases in
decision-making such as LA. For instance, Raz (2000) found
a steady decline in the prefrontal cortex (PFC) structures
starting from the age of 20 along with a decline in the
striatal volume over the lifespan of an individual. In many
studies, the biology of age-related changes in the brain goes
in the same direction as behavior (Good et al., 2001), as for
instance in the domain of episodic memory, where older adults
have demonstrated decreased activation of various sites in the
left and right prefrontal cortices correlating with decreased
performance on the task relative to their younger counterparts
(Grady et al., 1995, 1999; Cabeza et al., 1997; Madden et al.,
1999; Grady and Craik, 2000; Reuter-Lorenz, 2002; Stebbins
et al., 2002). An alternate outcome is also possible, wherein
alterations in brain activity are not associated with an alteration
of behavior, namely, increasing amounts of activation are needed
to produce the same behavior (e.g., neurocompensation; Cabeza
et al., 2002; Park and Reuter-Lorenz, 2009; Daselaar et al.,
2015).
These neuroimaging and behavioral studies thus suggest at
least two potential hypotheses regarding LA, its underlying
neural substrate, and aging: (1) LA behavior may parallel
changes in neural processing, specifically, LA behavior may
increase with age along with increased activation in tissue
required to process it; or (2) LA behavior may increase more
slowly than the compensatory activity in tissue processing
it (i.e., there may be small differences in LA behavior
with age, and strong brain activity differences during its
processing). This latter possibility finds support from an
early functional MRI (fMRI) study that reported decreases in
either performance or IQ were associated with increased brain
activation during cognitive function (Seidman et al., 1998),
and the observation of potentially compensatory activity in
older individuals (Meunier et al., 2014). Two recent studies of
LA specifically support option (2) above, in that they report
LA behavior does not change between young adults and old
adults (Li et al., 2013) or between adolescents and young
adults (Barkley-Levenson et al., 2013). One of these studies
also evaluated neural processing of LA, and found differences
between adolescents and young adults in large decision-making
networks, further supporting option (2) (Barkley-Levenson et al.,
2013).
In the current study we sought to test these hypotheses
evaluating subject age against (1) the relative overweighting
of behavioral responses to negative vs. positive stimuli (i.e.,
LA behavior) using a validated keypress measure (Kim et al.,
2010); and (2) neural differential sensitivity (NDS; Tom et al.,
2007) within the ventral striatum/nucleus accumbens (VS/NAc)
to the same stimuli used in the behavior task. Given the
substantial involvement of the VS/NAc in motor preparation
(e.g., Florio et al., 1999) and abnormality with motor illnesses
such as Parkinsonism (e.g., Aarts et al., 2014; Payer et al., 2015),
we sought to avoid the motoric contamination inherent with
cognitive imaging studies of the VS/NAc using monetary choice
paradigms (Tom et al., 2007; Canessa et al., 2013). Since the
motor responses for the keypress task would not be separate from
reward/aversion assessments (the amount of VS/NAc activation
could just reflect how much an individual was keypressing to
approach or avoid a stimulus, or reflect the urgency of their
responses), the keypress task was done outside the MRI, and the
outcome of keypress responses used for model-based analysis
of VS/NAc signal during passive viewing of the same stimuli;
such a model-based approach to fMRI has been used with this
task (Aharon et al., 2001) and fMRI-based imaging-genetics
used with these stimuli and task before (Perlis et al., 2008;
Gasic et al., 2009), consistent with the framework for model-
based imaging discussed by others (e.g., Mittner et al., 2014;
Wang and Voss, 2014; White et al., 2014; Xu et al., 2015). The
implicit assumption in this model-based application was that the
emotional response to faces in the scanner, and the behavior
based on emotional response to the same stimuli outside of the
scanner would be related, as suggested for studies of emotion-
based processing by other investigators (Hayes and Northoff,
2012).
To examine the underlying physiological effects of age
on LA, we performed whole brain fMRI to monitor activity
within the VS/NAc, using a passive viewing paradigm with
affective faces known to evoke positive and negative valuations
(Strauss et al., 2005), given the VS/NAc is a central region
for reward/aversion processing (Breiter et al., 1997; Blood
et al., 1999; Breiter and Rosen, 1999; Hayes and Northoff,
2012), and has been shown to activate to both positive and
Frontiers in Human Neuroscience | www.frontiersin.org
April 2015 | Volume 9 | Article 176
42

Viswanathan et al. Age and loss aversion
negative stimuli (Aharon et al., 2001; Becerra et al., 2001;
Breiter et al., 2001; Kober et al., 2008; Hayes and Northoff,
2012) and to track LA for the choice and anticipation phases
of decision making (Tom et al., 2007; Lee et al., 2012;
Canessa et al., 2013). For a behavioral index of LA, we used
the same affective faces (Ekman and Friesen, 1976) with a
keypress task performed outside the MRI that allowed the
subject multiple potential decisions: (1) to do nothing about
the default viewing time of a picture; (2) to view the picture
for longer (approach); or (3) to view the picture for shorter
(avoidance) time. The keypress data was analyzed to produce
a value function (Breiter and Kim, 2008; Kim et al., 2010)
for each subject that is analogous to a prospect theory value
function or utility curve (Kahneman and Tversky, 1979),
but unlike any other reward/aversion construct actually uses
an entropy variable representing information (Shannon and
Weaver, 1949). The slopes of the negative and positive portions
of this curve can be readily sampled to yield a measure of
LA in a general framework for LA as an overweighting of
aversion (toward negative stimuli) relative to approach (toward
positive stimuli) as discussed by Abdellaoui et al. (2007). For
the model-based fMRI analysis, we explicitly required that (i)
relative activation to negative (avoidance) stimuli vs. positive
(approach) stimuli (i.e., the NDS of avoidance vs. approach)
would occur in the VS/NAc; and (ii) that NDS-related fMRI
signal in the VS/NAc would significantly correlate with LA
behavior across subjects. If this were observed, we then sought
to evaluate if VS/NAc NDS would increase with age, and
whether or not it would parallel any relationship of LA
behavior to age, supporting either the first or second hypothesis
regarding the interaction of LA, its underlying neural substrate,
and aging.
Methods
Subjects
Healthy control subjects were aggregated for an exploratory
analysis on an available sample of subjects with complete
behavior and imaging data from three paradigms for which
LA parameters could be computed and evaluated. The
resulting sample of 17 subjects was compiled for use with
another project testing if the negative component of LA
could explain aspects of amygdala function across the three
paradigms and connect it to structural measures (Lee et al.,
2012); the current study focused just on the emotional faces
paradigm given the value function curves from keypressing
to these stimuli had never been published, nor evaluated
against NDS or age. These 17 subjects were recruited by
advertisement and were part of a larger phenotype genotype
project in addiction and mood disorder (PGP)
1
. Subjects
were free of any psychiatric, neurological, or medical issues
per psychiatrist-based SCID for DSM-IV diagnoses, medical
review of systems and physical evaluation including blood
chemistry. Race was determined by individual self-identification
using a standardized form (Benson and Marano, 1998), and
1
http://pgp.mgh.harvard.edu
handedness via the Edinburgh Handedness Inventory (Oldfield,
1971). Participating subjects were without any current or
lifetime DSM-IV Axis I disorder or major medical illness
known to influence brain structure or function, including
neurologic disease, HIV, and hepatitis C. Subjects were
scanned at normal or corrected normal vision. Women
were scanned during their mid-follicular phase based
upon self-reported menstrual history, with confirmation
at the time of scanning based on hormonal testing with a
urine assay.
Participants in the study were adults (10 males, 7 females;
5 African Americans and 12 Caucasians) between the ages
of 20 and 55 with a mean (±SE) age of 35.8 ± 2.7 years,
with no significant difference between men and women
(F
(1,15)
= 1.81, P < 0.20). They had a mean educational history
of 15.4 ± 1.9 years, with no significant difference between men
and women (F
(1,15)
= 2.78, P < 0.12). Fifteen of subjects were
right-handed.
Experimental Paradigm and Offline Behavioral
Testing
In Scanner
Two fMRI scans were acquired (8 min 40 s each), each
consisting of 20-s blocks of the following seven experimental
conditions: angry, fearful, happy, sad, neutral expressions
(Ekman and Friesen, 1976), along with phase-scrambled stimuli
and fixation (Figure 1). During each scan, the seven conditions
(blocks) were presented in a counterbalanced order such
that no condition followed or preceded another more than
once. This produced a sequence of 25 blocks for the first
run, and 24 plus one blocks for the second run, with the
extra block in the second run being equivalent to the last
block in the first run, placed at the beginning to maintain
counterbalancing across all conditions. Each facial expression
block included standardized images of faces of eight individuals
(four males) in a pseudorandom order (Breiter et al., 1996;
Strauss et al., 2005). Each face was displayed for 200 ms
with a 300 ms interstimulus interval during which a fixation
cross was displayed, with five repetitions of each face stimulus
per block (40 faces total per block). Face stimuli (Ekman
and Friesen, 1976) were previously normalized at the MIT
Media Lab (Breiter et al., 1996). The face stimuli were
projected via a Sharp XG-2000V color LCD projector through
a collimating lens onto a hemicircular tangent screen and
viewed by the subject via a mirror affixed to the head
coil. Subjects were instructed to simply look at the faces,
keeping their eyes focused on the center of the picture at
the location of the cross-hair. After completion of scanning,
subjects performed a memory task in which they were asked to
identify faces and facial expressions they had seen during the
scanning session.
Offline Behavioral Testing
This experiment utilized a keypress task to determine each
subject’s relative preference toward the ensemble of faces
(Aharon et al., 2001; Elman et al., 2005; Strauss et al., 2005;
Levy et al., 2008; Makris et al., 2008; Perlis et al., 2008; Gasic
Frontiers in Human Neuroscience | www.frontiersin.org April 2015 | Volume 9 | Article 176
43
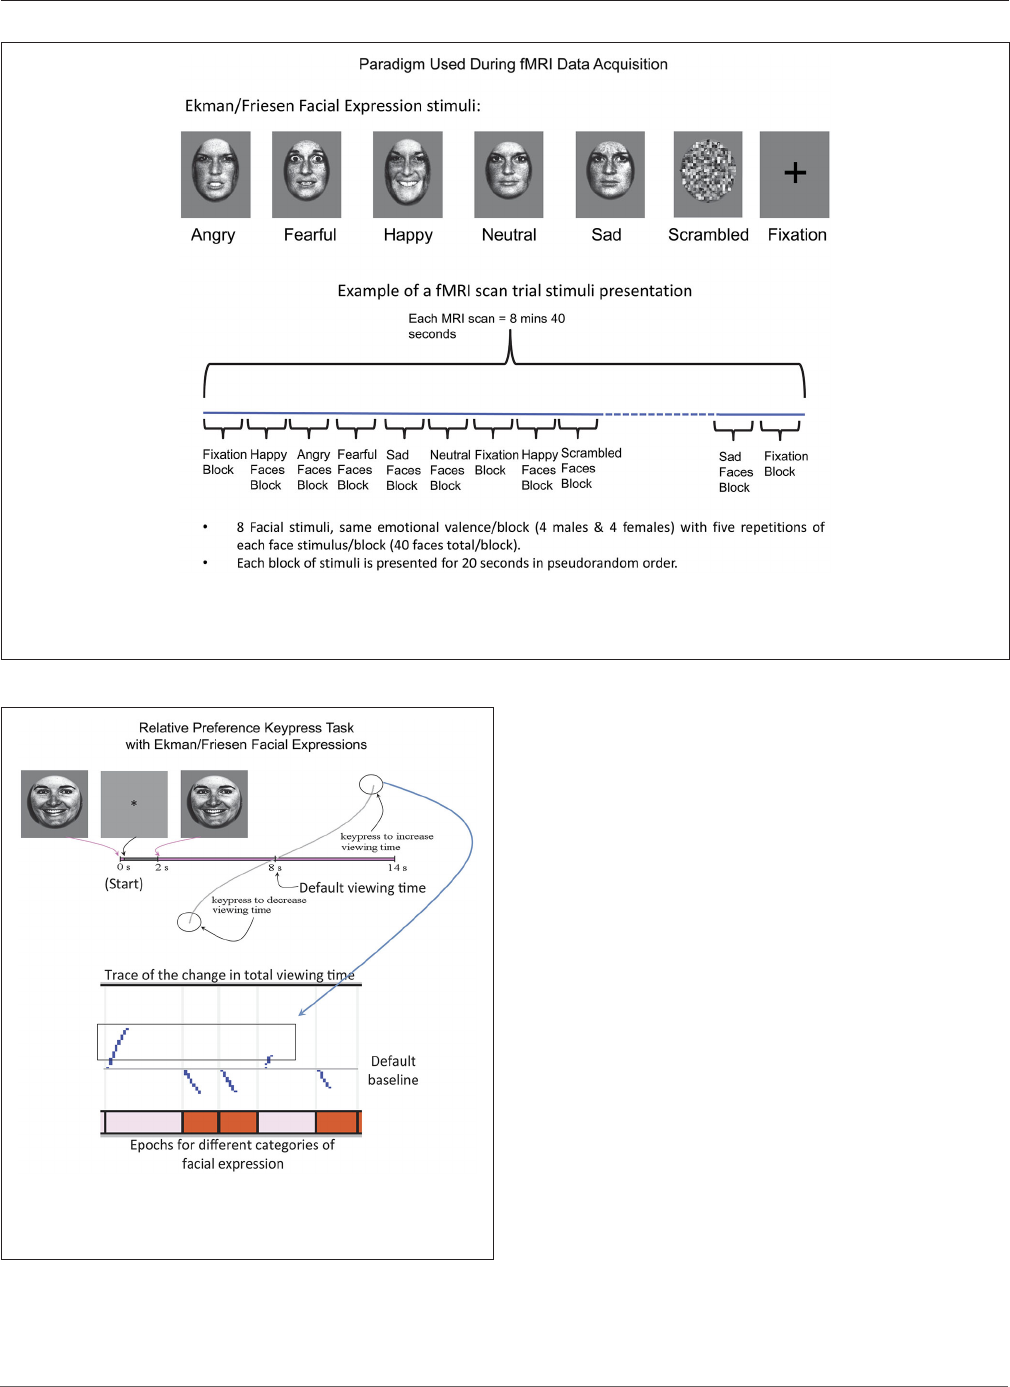
Viswanathan et al. Age and loss aversion
FIGURE 1 | Schema for Experimental Paradigm Used with fMRI. At
top, the categories of facial expressions used are shown along with
baselines (scrambled faces and fixation). A schema of how these stimuli
were presented as blocks is shown at bottom, along with details
relating to number of stimuli used per block. See Methods Section for
further detail.
FIGURE 2 | Keypress Paradigm. The behavioral task done outside the MRI
to minimize motor confounds to activation is schematized above, with an
example raster plot below.
et al., 2009; Yamamoto et al., 2009; Kim et al., 2010), which
had been used for passive viewing during scanning. The
separation of passive viewing and keypress response allowed
the fMRI component to be free of motoric elements, which
would otherwise confound interpretation of the fMRI results
(please see Introduction Section). The keypress procedure was
implemented with MatLab software on a PC (i.e., a personal
computer). This task captured the reward valuation attributed
to each observed face, and quantified positive and negative
preferences involving (i) decision-making regarding the valence
of behavior; and (ii) judgments that determine the magnitude of
approach and avoidance (Breiter et al., 2006; Perlis et al., 2008;
Figure 2). The objective was to determine how much effort each
subject was willing to trade for viewing each facial expression
compared to a default viewing time. Subjects were told that they
would be exposed to a series of pictures that would change every
8 s (the default valuation of 6 s + 2 s decision block; Figure 2)
if they pressed no keys. If they wanted a picture to disappear
faster, they could alternate pressing one set of keys (#3 and #4
on the button box), whereas if they wanted a picture to stay
longer on the screen, they could alternate pressing another set
of keys (#1 and #2 on the button box). Subjects had a choice to
do nothing (default condition), increase viewing time, decrease
viewing time, or a combination of the two responses (Figure 2).
A ‘‘slider’’ was displayed to the left of each picture to indicate
total viewing time. Subjects were informed that the task would
last approximately 20 min, and that this length was independent
of their behavior, as was their overall payment. The dependent
measure of interest was the amount of work, in number of
keypresses, which subjects traded for face viewtime.
Frontiers in Human Neuroscience | www.frontiersin.org 4 April 2015 | Volume 9 | Article 176
44
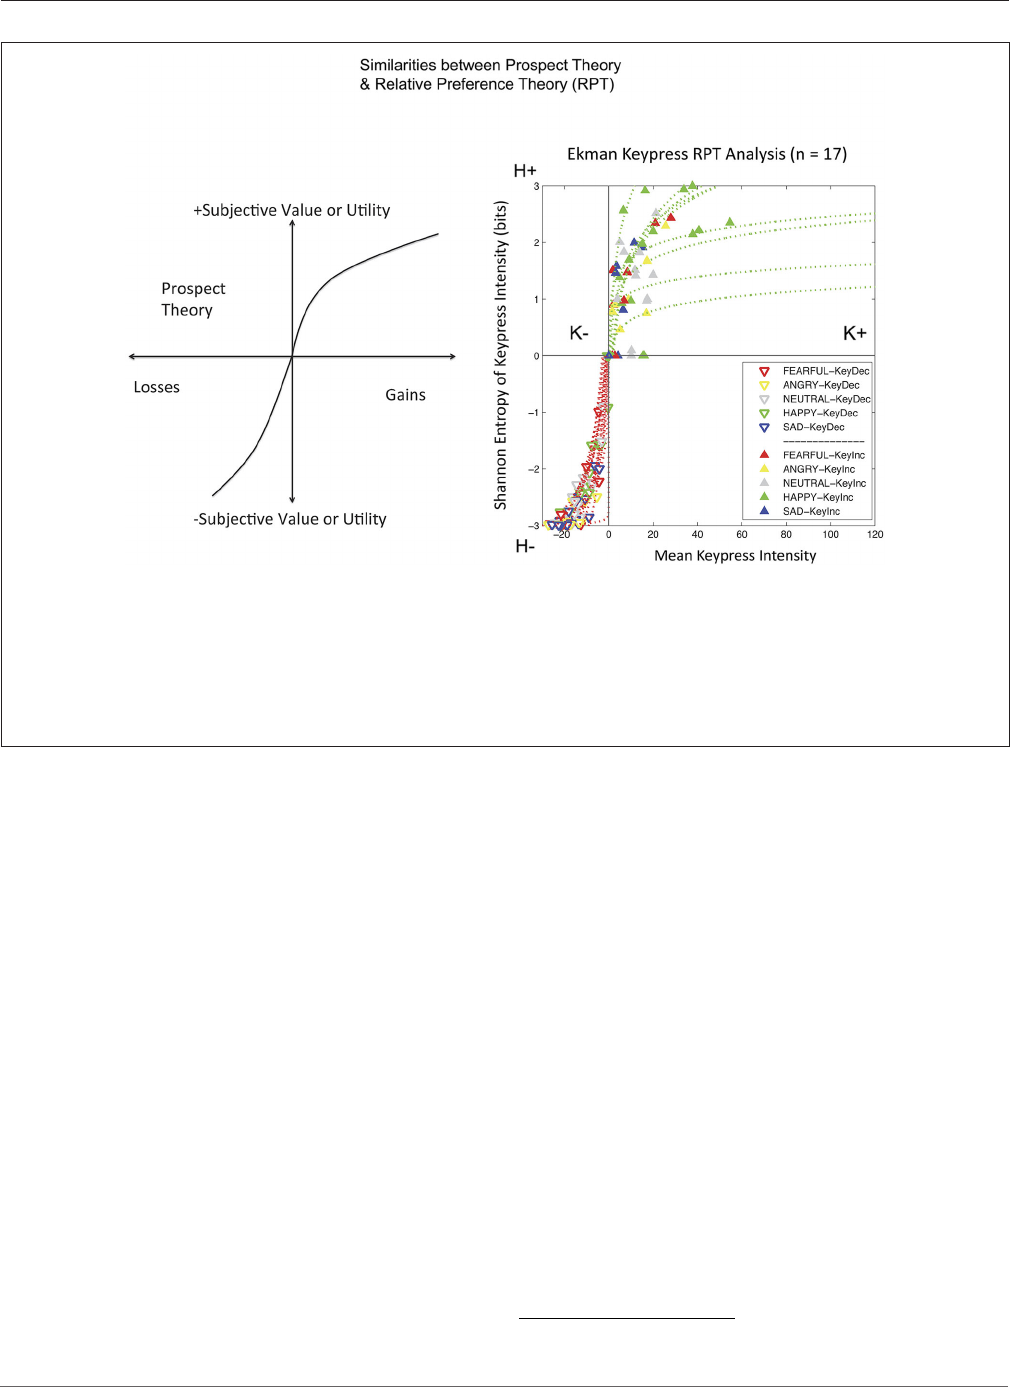
Viswanathan et al. Age and loss aversion
FIGURE 3 | Relative Preference Graphs. The output of the keypress
paradigm is shown for 17 subjects on the right. The variable K stands for
the mean number of keypresses made for category of picture viewed
(mean viewtime per category can also be substituted to produce
comparable results). K can be interpreted as the effort expended to
approach (+ keypresses) or avoid (keypresses) stimuli, and approximates
wanting. The variable H stands for the Shannon entropy (information or
uncertainty related to making a choice) for each category of picture. It can
be interpreted as representing memory about the uncertainty related to
making choices over this stimulus set. The approach graph is in green and
the avoidance graph is in red. On the left is shown a schema for prospect
theory (Kahneman and Tversky, 1979) to emphasize the similarity, despite
different variables, between the two theoretical frameworks of prospect
theory and relative preference theory (Breiter and Kim, 2008; Kim et al.,
2010). Both show an increased slope for negative or avoidance responses
relative to positive or approach responses.
Magnetic Resonance Imaging
All functional MR imaging was performed on a Siemens
Trio 3 Tesla MRI system using an eight-channel phased-array
receive-only RF coil. Subjects were positioned in the MRI scanner
and their heads stabilized using foam pads and adjustable paddles
fixed to the RF coil assembly. Blood oxygenation level-dependent
(BOLD) functional images were acquired using gradient-echo
EPI (TR/TE/α 2.5 s/30 ms/90
◦
, 3.125 mm × 3.125 mm × 3 mm
resolution), with slices situated parallel to the AC–PC line,
and parallel to the inside curve of the FOC to minimize signal
distortion in this region (Deichmann et al., 2003). Structural
images were acquired using a high resolution T1-weighted
MPRAGE sequence (192 sagittal slices over the full head volume,
matrix = 224 × 256, FOV = 224 × 256 mm
2
, thickness = 1
mm, no gap) before functional scanning. Details of the imaging
parameters and protocol have been reported previously (Perlis
et al., 2008; Gasic et al., 2009).
Data Analysis
Behavioral Data
Keypress data were checked by a relative preference theory
analysis of each subject, using previously validated procedures
(Breiter and Kim, 2008; Kim et al., 2010; Figure 3). These
procedures produce a valuation graph with variables K
and H that encode mean keypress number and Shannon
entropy (i.e., information) (Shannon and Weaver, 1949). This
valuation graph has been interpreted to relate ‘‘wanting’’ of
stimuli (Aharon et al., 2001) to the uncertainty associated
with making a choice (Kim et al., 2010). Using a local
and general definition of LA (Abdellaoui et al., 2007), we
computed the slope of the negative value/utility function
(s−) and the slope of the positive value/utility function (s+),
to produce s−/s+ (Figure 4). Specifically, s− and s+ were
computed by the integral of the curve-fit slope over the
10% of the curve closest to the inflection point or origin
(Figure 4). An absolute value of s−/s+ was then computed
for each subject. With the full dataset of these subjects we
then assessed the association of LA (i.e., |s−/s+|) with age
using linear regression; given this test was done in parallel
with another test against age (see NDS and age below),
there was a correction for multiple comparisons imposed of
p < 0.05/2 = 0.025.
Imaging Data
fMRI data were analyzed using the FSL platform (FMRIB’s
Software Library, v4.1.9)
2
, and followed signal processing and
2
http://fsl.fmrib.ox.ac.uk/fsl/fslwiki
Frontiers in Human Neuroscience | www.frontiersin.org 5 April 2015 | Volume 9 | Article 176
45
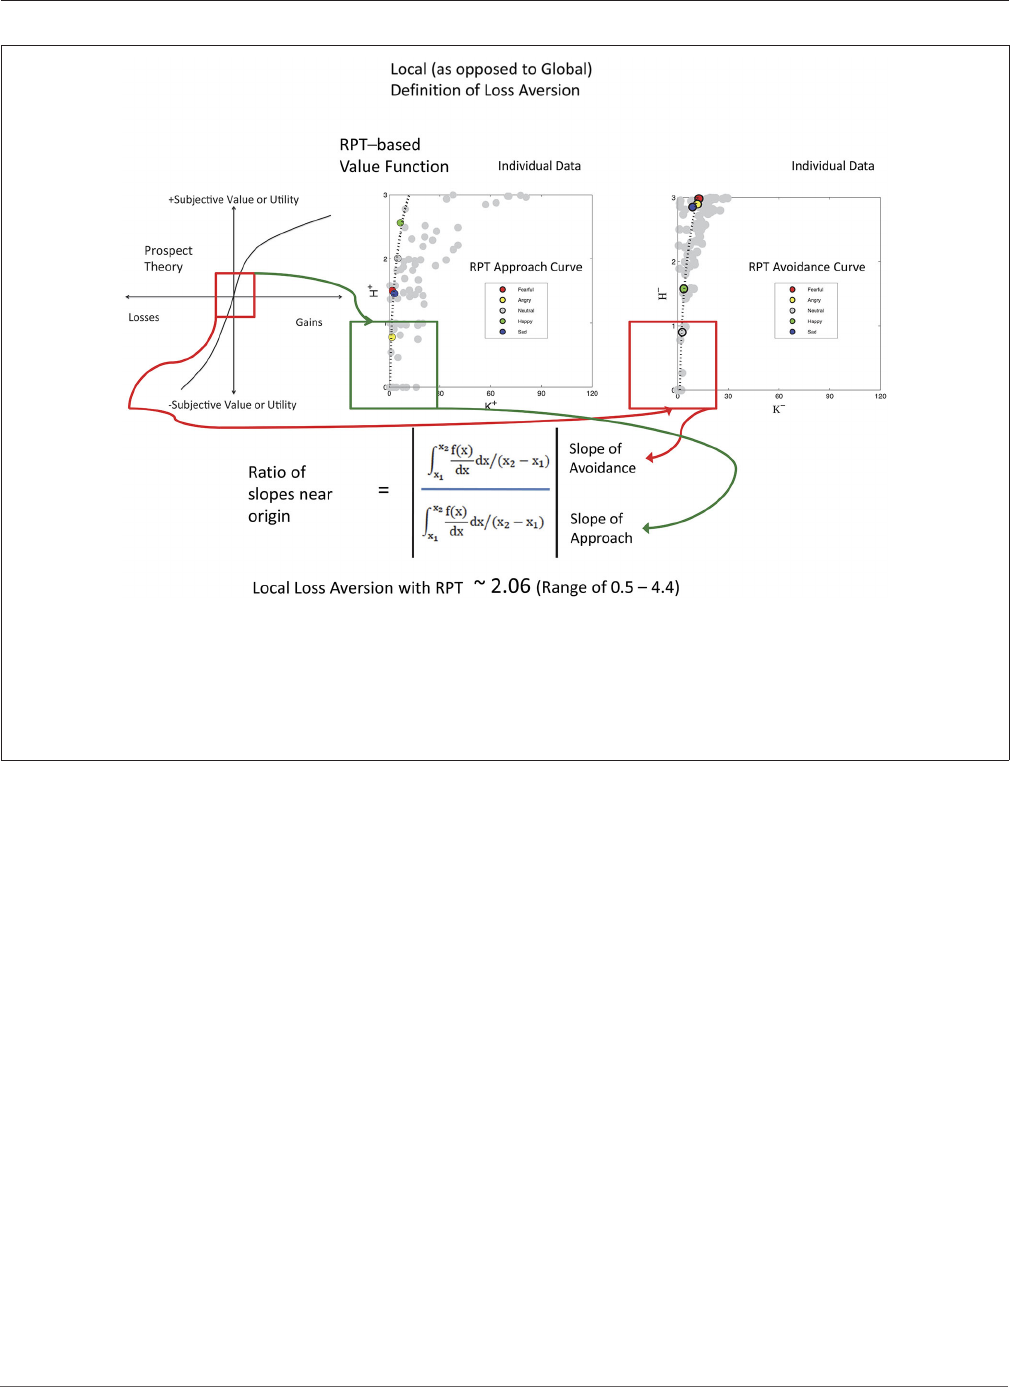
Viswanathan et al. Age and loss aversion
FIGURE 4 | Local Loss Aversion Computation. This study used a
local rather than a global assessment of loss aversion, meaning that the
ratio was computed using the slopes around the inflection point for
each graph, rather than the entire graph (Abdellaoui et al., 2007). In this
figure, the same cartoon for prospect theory used in Figure 3 is shown
on the left, with a red box around the inflection point between the
positive and negative graphs that meet at the origin. The approach KH
graphs (variables defined in Figure 3 legend) and avoidance KH graphs
for the 17 subjects are shown as unfitted points in gray to the right.
One example subject is shown with color points as defined in each
graph with a fitted curve. The lowest 10% of these curves was then
used for assessing the slopes as shown in the mathematics at bottom.
Of interest, the LA value for these subjects approximates that reported
by Tversky and Kahneman (1992).
statistical analysis procedures we have detailed elsewhere (Perlis
et al., 2008; Gasic et al., 2009). Stimuli were grouped based
on keypress responses into stimuli subjects avoided (Angry,
Fearful, and Sad faces) and stimuli subjects approached by
using the keypress task to increase viewing time (Happy
faces). These two stimuli classes were contrasted in order to
determine brain areas that responded more highly to negative
(avoidance) than to positive (approach) stimuli [i.e., the β
slope for the negative activation (or PE for the –COPE) was
greater than the β slope of the positive activation (or PE
for the +COPE)]. Statistical maps of NDS to losses relative
to gains (− > +) were constructed as a group map, and
voxels selected above a whole brain correction for z-stat = 2.3
that overlapped the VS/NAc segmentation volumes from the
ICBM152 T1 template (Perlis et al., 2008; Gasic et al., 2009;
Figure 5). VS/NAc segmentation followed previously published
parameters for its boundaries (Breiter et al., 1997), using
processes that have been well validated (see Breiter et al., 1994;
Makris et al., 2004). As a second step in our model-based
fMRI analysis, we assessed the correlation of NDS [(Angry,
Fearful, and Sad > Happy)] in the VS/NAc to LA, as described
by Tom et al. (2007), using a subset of the 17 subjects
who were not statistical outliers (Figure 6). For this isolated
correlation, significant effects had to meet p < 0.05. With the
full dataset of these subjects we then assessed the regression
of NDS with age (Figure 7), and LA with age. Given two
assessments against the age variable, significant effects had to
meet p < 0.05/2 = 0.025.
Results
Behavioral Data
All 17 subjects produced keypress data with value function
graphs consistent with relative preference theory (Breiter and
Kim, 2008; Kim et al., 2010; Figures 3, 4). All graphs produced
LA computations (Figure 3), although five subjects had s-/s+
ratios that were > 2 standard deviations above or below the
cohort mean, and thus were considered outliers. The LA estimate
for remaining subjects was 2.06 + 0.36 (mean + SE) (Figure 4),
and the confidence interval of this group overlapped the LA
mean of 2.25, published by Tversky and Kahneman (1992). The
regression of LA to age showed a non-significant relationship
(p > 0.1).
Neuroimaging Data
fMRI data showed significant motion artifacts in two subjects.
In the remaining subjects, significant fMRI activation was
observed in the VS/NAc bilaterally in the majority of
Frontiers in Human Neuroscience | www.frontiersin.org 6 April 2015 | Volume 9 | Article 176
46
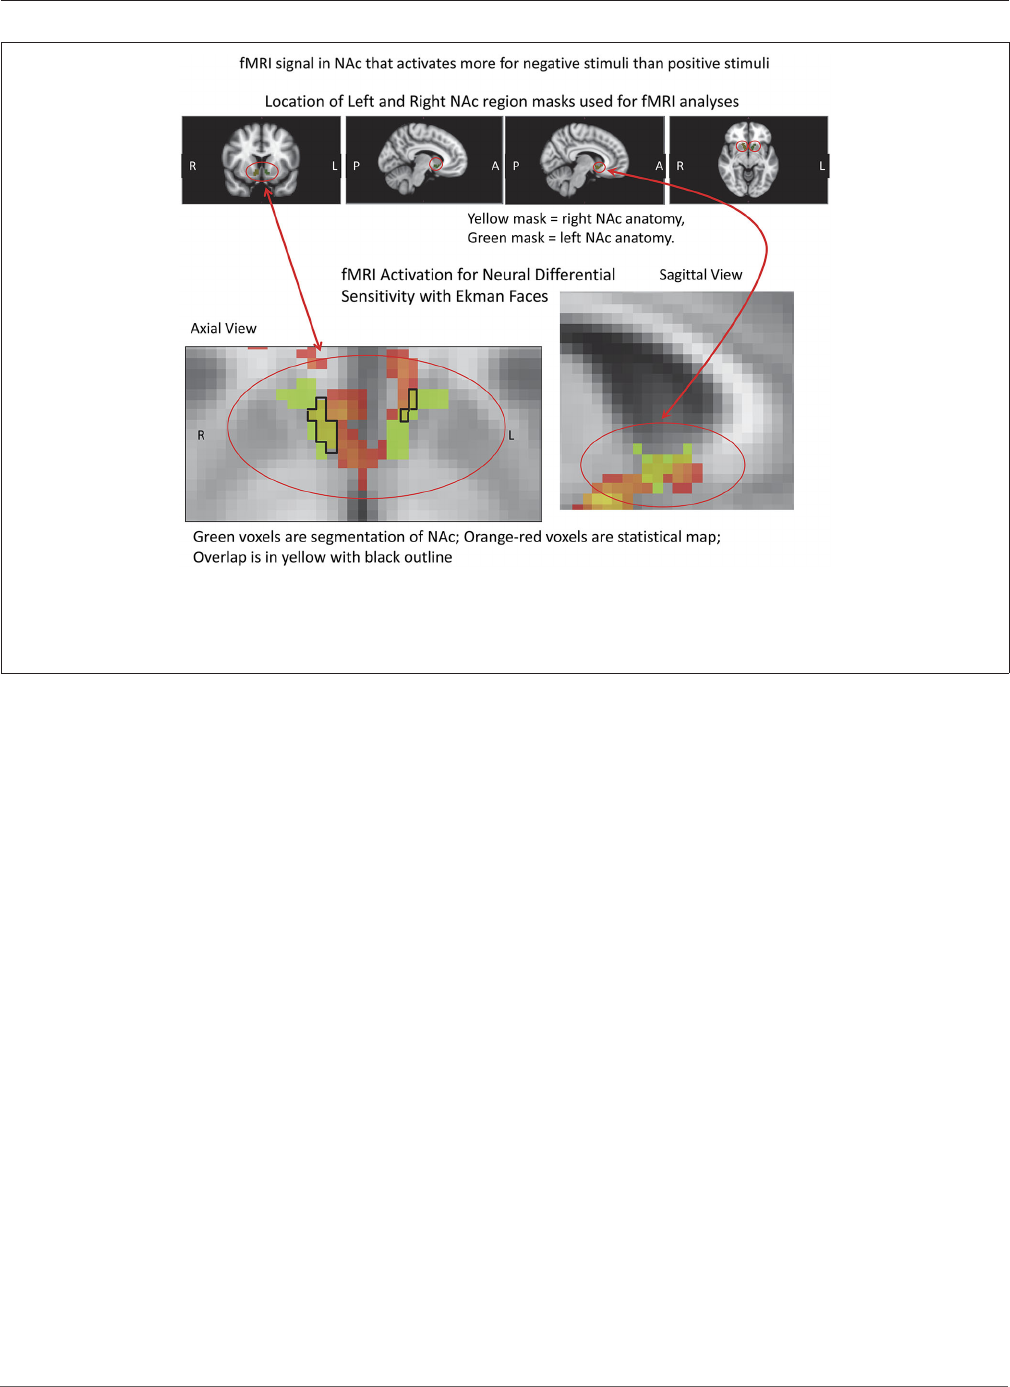
Viswanathan et al. Age and loss aversion
FIGURE 5 | fMRI Masks and Activation for Neural Differential Sensitivity
(NDS). The region of interest mask used for the VS/NAc is shown above in
color with red circles, with the statistics for the subtraction of negative stimuli vs.
positive stimuli in pseudocolor shown below. The segmented VS/NAc is shown
in light green in the images below, superimposed on the gray-tone ICBM152 T1
template. The light green segmentations are overlaid with the orange-red
statistical map for NDS. Overlap of segmented anatomy and statistical
activation map is outlined in black, with yellow inside the closed line.
subjects (see segmentation-based masks of the VS/NAc and
group statistical map in Figure 5). In individuals, voxels
of activation with p < 0.05, z = 1.96 that overlapped
segmentation of the VS/NAc were used to sample BOLD
signal representing NDS to losses relative to gains. Across
subjects, we found that activation to negative stimuli in left
and right NAc was significantly greater than activation to
positive stimuli (Figure 5). This signal was used for a control
analysis of the correlation of NDS relative to behavioral LA
(r
(2,11)
= 0.64, p < 0.04). Without outliers (>2 SD from
mean NDS), we found the same relationship (Figure 6)
reported by others (Tom et al., 2007). When we assessed
the relationship of NDS in the VS/NAc to age, we observed
a significant positive correlation (F
(2,16)
= 9.01, p < 0.009)
(Figure 7).
Discussion
Synopsis
This study showed that a validated keypress paradigm that
allowed subjects to trade effort for view-time of emotional faces
(Ekman and Friesen, 1976), produced a relationship between the
mean (K, Figure 3) and pattern of keypressing (H, Figure 3)
consistent with previous reports using a beauty stimulus set,
the International Affective Picture Set, and food stimuli (Breiter
and Kim, 2008; Kim et al., 2010). This relationship from
the picture-based keypress task produced a ratio between the
slope of the avoidance value function (s-) and slope of the
approach value function (s+) as a LA measure quite close to that
reported by Tversky and Kahneman (1992), who used a monetary
decision task.
The keypress-based LA measure correlated with a measure
of NDS from the VS/NAc, in similar fashion to that reported
by others using a monetary choice task (Tom et al., 2007), and
meeting our two criteria for model-based fMRI effects. Although
correlation of LA with age was non-significant, the correlation
of NDS with age showed a significant positive relationship.
Two sides of the three-way correlation test between LA, NDS,
and age were significant, suggesting that as individuals age
their NDS also increases but their behavioral index of LA
does not. The discussion that follows will evaluate potential
hypotheses and implications of these findings, along with
important caveats.
Neurocompensation and Other Hypotheses
The relationship between age and NDS in the absence of a
significant relationship between age and behavioral LA suggests
interesting hypotheses about the neural processing of LA in
relation to age. First, Seidman et al. (1998) have shown
that subject IQ is inversely related to brain activation levels
across individuals, suggesting that the brain compensates with
greater neural activity when functional capacity is lower. Given
that aging is known to be associated with brain atrophy
(e.g., Raz et al., 2005) and cognitive decline (e.g., Kensinger
and Corkin, 2008), it is inferred that the functional capacity of
the brain declines with age. The findings in this study suggest
Frontiers in Human Neuroscience | www.frontiersin.org 7 April 2015 | Volume 9 | Article 176
47
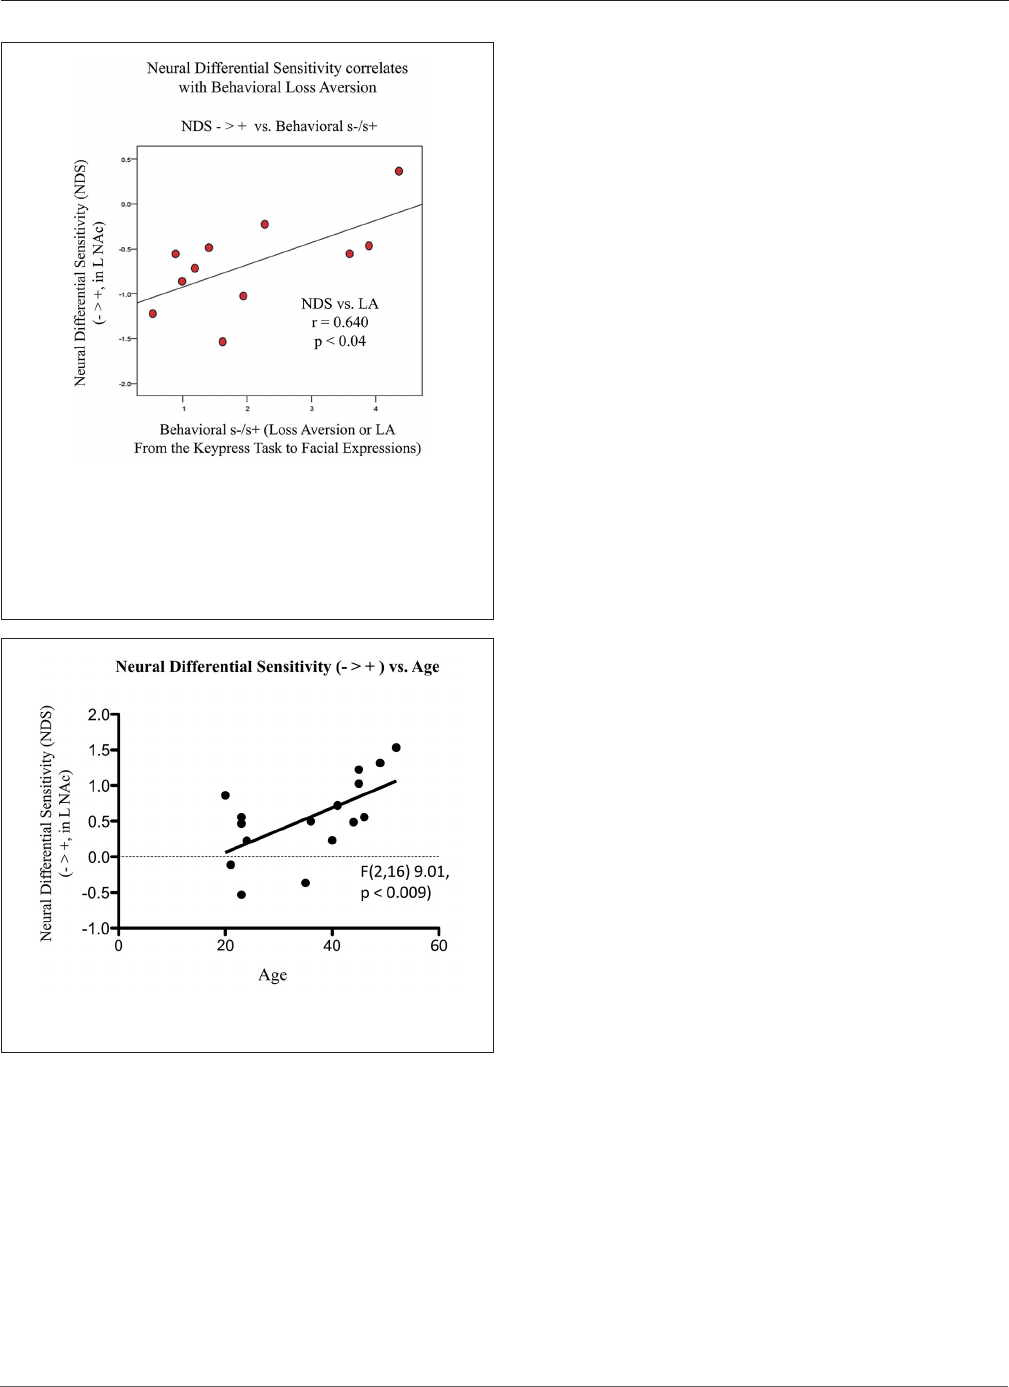
Viswanathan et al. Age and loss aversion
FIGURE 6 | Association between LA and NDS from BOLD signal
collected by fMRI. NDS represents the difference between BOLD
signal in the left VS/NAc for negative stimuli (Angry, Fearful, and Sad
faces) minus positive stimuli (Happy faces). LA is represented as the
absolute value of s-/s+ from the relative preference graphs of each
subject as shown in Figure 3. The line of best fit is shown from this
association.
FIGURE 7 | Association of NDS from BOLD signal collected by fMRI
with age. The line of best fit is shown from this association.
the hypothesis that as an individual ages, the neural differential
between losses and gains increases to achieve the same level
of behavioral LA. This perspective is consistent with recent
research on aging wherein preserved cognitive function in the
context of age-related brain activity may be thought to represent
a neurocompensation mechanism (Meunier et al., 2014).
Consistent with the neural efficiency (neurocompensation)
hypothesis, age-related differences in reward processing have
led to evolutionary theories about the changing costs and need
to acquire resources over the lifespan. Namely, youth have
optimal health and a lack of resources, which may drive the
early aggressive pursuit of rewards (Spear, 2000; Somerville
and Casey, 2010); while as age progresses, biological decline
drives the need to minimize effort and protect what has been
acquired (Heckhausen, 1997; Ebner et al., 2006; Heckhausen
et al., 2010).
Consistent with these observations, age-related brand
loyalty (Lambert-Pandraud and Laurent, 2010) has been
attributed to an increased aversion to risk associated with change
(Montgomery and Wernerfelt, 1992; Erdem et al., 2006) leading
to investigations of age-related changes in decision making and
reward processing across the lifespan (Mata and Nunes, 2010;
Eppinger et al., 2011, 2012; Mata et al., 2011; Weller et al., 2011;
Paulsen et al., 2012a,b; Barkley-Levenson et al., 2013). In the
current study, we observed no significant differences in LA
behavior, but did find relatively early (i.e., range 20–55 years
old) age-related increases in NDS. The parametric increase in
NDS with age may indicate additional neural effort is required
to obtain the same behavioral outcomes as one ages. Previous
studies support this notion; for example, aging populations show
bilateral activation patterns within homologous areas of the PFC
while their younger counterparts achieve the same performance
with singular lateralized activations (Reuter-Lorenz et al., 1999;
Cabeza et al., 2002), suggesting compensatory mechanisms in
response to neural senescence (Cabeza et al., 2002; Park and
Reuter-Lorenz, 2009; Daselaar et al., 2015). In addition, recent
imaging work on cognitive function suggests that behavioral
outcomes reflect interactions between age, neural efficiency and
processing load (Cappell et al., 2010; Vallesi et al., 2011; Turner
and Spreng, 2012).
Alternative hypotheses might consider additional age-related
asymmetries in the larger decision making network that interact
with the VS/NAc in such a way that the response to LA is either
uninhibited or amplified. For example, on the other end of the
age spectrum, recent imaging work has shown asynchronous
developments of the VS/NAc and PFC parallels adolescents’
predisposition to engage in high-risk behaviors (Steinberg, 2008;
Van Leijenhorst et al., 2010; Blakemore and Robbins, 2012;
Barkley-Levenson and Galván, 2014), however the relationship
only becomes apparent when the asynchronous trajectories
of PFC and VS/NAc interact within a specific window of
development. The observed VS/NAc response to LA may reflect
a similar interaction, albeit in areas that did not reach thresholds
of activation that changed behavior in the current experiment,
either because of the age group examined, sensitivity of the
task, or sensitivity of the imaging paradigm. For example, given
the limitations of imaging relatively small and deep subcortical
structures, particularly in small sample sizes, additional areas
may also contribute to age related changes in processing LA,
such as functional differences between the dorsal and ventral
striatum, where activations in the dorsal striatum may have
been sub-threshold in our data, or may only be associated with
anticipation paradigms (Tom et al., 2007) related to LA.
Limitations
The differences in the relationship between age and neural
responses vs. age and behavior suggests future work might
benefit from examining VS/NAc response against other regions
implicated in decision making, which appear to contribute to
Frontiers in Human Neuroscience | www.frontiersin.org 8 April 2015 | Volume 9 | Article 176
48

Viswanathan et al. Age and loss aversion
LA processing (e.g., consider the amygdala findings in Lee et al.,
2012, RO1 submission MH098867, and Canessa et al., 2013). In
addition, while the sample size for this study is comparable to
similar such work (e.g., Tom et al., 2007), much more needs
to be done to develop a better understanding of age effects.
In this study, we have a sample size of 17 subjects in the age
range of 20–55 years. Future studies might include a wider age
range to facilitate determining if there are distinct clusters of
subjects supporting one or both of the hypotheses regarding age
and neural function, and increase the number of participants to
obtain a more densely packed gradient of age distributions. With
a more comprehensive and dense parametric gradient of age, we
speculate that we would see stronger correlations with VS/NAc
activation, however we may also find non-linear functions, or a
step function based on plateaus within certain groups of ages.
The use of a model-based approach to fMRI in this study
also needs to be carefully considered in terms of its pros and
cons. Given concerns about VS/NAc involvement with motor
preparation (e.g., Florio et al., 1999) and alteration with motor
illnesses such as Parkinsonism (e.g., Aarts et al., 2014; Payer
et al., 2015), we sought to avoid motoric influence in cognitive
imaging studies of the VS/NAc as occurs by definition with
monetary choice paradigms (e.g., Tom et al., 2007; Canessa et al.,
2013). The implicit assumption in our model-based approach
was that emotional responses would drive keypress behavior,
and thus the keypress responses would reflect the assessment
of the faces being passively viewed in the scanner (see Perlis
et al., 2008; Gasic et al., 2009). Such considerations about the
use of valuation systems for processing even passively presented
stimuli have been discussed by others (e.g., Hayes and Northoff,
2012), and similar considerations have been employed in other
model-based fMRI analyses (e.g., Mittner et al., 2014; Wang and
Voss, 2014; White et al., 2014; Xu et al., 2015). In this study,
the model had two components: (i) testing if NDS would occur
in the VS/NAc; and (ii) assessing if NDS-related fMRI signal
in the VS/NAc correlated significantly with LA behavior across
subjects. It is important to note that the behavioral process
studied is one of only two behavioral models (the other being
circadian rhythms) that have been tested to Feynman criteria
for lawfulness (Kim et al., 2010). Even with such considerations,
there is always the possibility that our implicit assumption does
not hold, and the keypress behavior outside the scanner relates
to a completely different cognitive function than that occurring
in the scanner to passive viewing, such as might be involved with
the default network.
Conclusion
In this study we used a more general interpretation of LA,
as an overweighting of aversion (toward negative stimuli)
relative to approach (toward positive stimuli), and found
close concordance with prior published LA measures (Tversky
and Kahneman, 1992; Abdellaoui et al., 2007). This LA
measure correlated significantly with the differential processing
of negative outcomes relative to positive ones by the brain
consistent with other studies (Tom et al., 2007; Lee et al., 2012;
Canessa et al., 2013). The absence of LA correlation with age,
but presence of age correlation with brain differential sensitivity
(i.e., NDS) supports a neural efficiency or neurocompensation
hypothesis regarding the effects of age on the process of LA. The
data from this study may have implications for future research
using non-monetary stimuli, such as consumables, marketing
options, or market communications. Crossing this consideration
with the aging data, the results of our study suggest that
marketing communications and brands research that target older
adults might focus on the cost of neural processing in marketing
communications. Future fMRI work might specifically target an
older adult population in order to examine how brain circuits
underlying decision-making may be altered in persons over the
age of 65. Future fMRI work might also examine the interactions
of the nature of information with other variables such as amount
of information (Mata and Nunes, 2010) and uncertainty, and
thus give us a better understanding of the sub-processes that
occur when older adults make decisions.
Acknowledgments
This work was supported by grants to HCB (#14118, 026002,
026104, 027804) from the NIDA, Bethesda, MD, and grants
(DABK39-03-0098 and DABK39-03-C-0098; The Phenotype
Genotype Project in Addiction and Mood Disorder) from
the Office of National Drug Control Policy—Counterdrug
Technology Assessment Center, Washington, D.C. Further
support was provided to HCB by the Warren Wright Adolescent
Center at Northwestern Memorial Hospital and Northwestern
University, Chicago IL, USA. Support was also provided by a
grant to AJB (#052368) from NINDS, Washington, D.C., and a
grant from the Dystonia Medical Research Foundation to AJB.
The funders had no role in study design, data collection and
analysis, decision to publish, or preparation of the manuscript.
References
Aarts, E., Nusselein, A. A., Smittenaar, P., Helmich, R. C., Bloem, B. R., and Cools,
R. (2014). Greater striatal responses to medication in Parkinson’s disease
are associated with better task-switching but worse reward performance.
Neuropsychologia 62, 390–397. doi: 10.1016/j.neuropsychologia.2014.
05.023
Abdellaoui, M., Bleichrodt, H., and Paraschiv, C. (2007). Loss aversion under
prospect theory: a parameter-free measurement. Manag. Sci. 53, 1659–1674.
doi: 10.1287/mnsc.1070.0711
Aharon, I., Etcoff, N., Ariely, D., Chabris, C. F., O’Connor, E., and
Breiter, H. C. (2001). Beautiful faces have variable reward value: fMRI
and behavioral evidence. Neuron 32, 537–551. doi: 10.1016/s0896-6273(01)
00491-3
Ariely, D., Huber, J., and Wertenbroch, K. (2005). When do losses loom
larger than gains? J. Mark. Res. 42, 134–138. doi: 10.1509/jmkr.42.2.134.
62283
Avnet, T., and Higgins, E. T. (2006). How regulatory fit affects value in
consumer choices and opinions. J. Mark. Res. 43, 1–10. doi: 10.1509/jmkr.
43.1.1
Frontiers in Human Neuroscience | www.frontiersin.org 9 April 2015 | Volume 9 | Article 176
49

Viswanathan et al. Age and loss aversion
Barkley-Levenson, E., and Galván, A. (2014). Neural representation of expected
value in the adolescent brain. Proc. Natl. Acad. Sci. 111, 1646–1651. doi: 10.
1073/pnas.1319762111
Barkley-Levenson, E. E., Van Leijenhorst, L., and Galván, A. (2013). Behavioral
and neural correlates of loss aversion and risk avoidance in adolescents
and adults. Dev. Cogn. Neurosci. 3, 72–83. doi: 10.1016/j.dcn.2012.
09.007
Becerra, L., Breiter, H. C., Wise, R., Gonzalez, R. G., and Borsook, D. (2001).
Reward circuitry activation by noxious thermal stimuli. Neuron 32, 927–946.
doi: 10.1016/s0896-6273(01)00533-5
Benson, V., and Marano, M. A. (1998). Current estimates from the National Health
Interview Survey, 1995. Vital Health Stat. 10 199, 1–428.
Blakemore, S.-J., and Robbins, T. W. (2012). Decision-making in the adolescent
brain. Nat. Neurosci. 15, 1184–1191. doi: 10.1038/nn.3177
Blood, A. J., Zatorre, R. J., Bermudez, P., and Evans, A. C. (1999). Emotional
responses to pleasant and unpleasant music correlate with activity in paralimbic
brain regions. Nat. Neurosci. 2, 382–387. doi: 10.1038/7299
Botwinick, J. (1978). Aging and Behavior: A Comprehensive Integration of Research
Findings. 2nd Edn. New York: Springer Publication.
Breiter, H. C., Aharon, I., Kahneman, D., Dale, A., and Shizgal, P. (2001).
Functional imaging of neural responses to expectancy and experience
of monetary gains and losses. Neuron 30, 619–639. doi: 10.1016/s0896-
6273(01)00303-8
Breiter, H. C., Etcoff, N. L., Whalen, P. J., Kennedy, W. A., Rauch, S. L., Buckner,
R. L., et al. (1996). Response and habituation of the human amygdala during
visual processing of facial expression. Neuron 17, 875–887. doi: 10.1016/s0896-
6273(00)80219-6
Breiter, H. C., Filipek, P. A., Kennedy, D. N., Baer, L., Pitcher, D. A., Olivares,
M. J., et al. (1994). Retrocallosal white matter abnormalities in patients with
obsessive-compulsive disorder. Arch. Gen. Psychiatry 51, 663–664. doi: 10.
1001/archpsyc.1994.03950080075010
Breiter, H. C., Gasic, G. P., and Makris, N. (2006). ‘‘Imaging the neural systems
for motivated behavior and their dysfunction in neuropsychiatric illness,’’ in
Complex Systems Science in Biomedicine, eds T. S. Deisboeck and J. Y. Kresh
(New York: Springer Verlag), 763–810.
Breiter, H. C., Gollub, R. L., Weisskoff, R. M., Kennedy, D. N., Makris,
N., Berke, J. D., et al. (1997). Acute effects of cocaine on human brain
activity and emotion. Neuron 19, 591–611. doi: 10.1016/s0896-6273(00)
80374-8
Breiter, H. C., and Kim, B. W. (2008). Recurrent and robust patterns
underlying human relative preference and associations with brain circuitry plus
genetics. Design principles in biology (U Minn, institute of mathematics and
its applications). Available online at: www.ima.umn.edu/2007-2008/W4.21-
25.08/abstracts.html
Breiter, H. C., and Rosen, B. R. (1999). Functional magnetic resonance imaging of
brain reward circuitry in the human. Ann. N Y Acad. Sci. 877, 523–547. doi: 10.
1111/j.1749-6632.1999.tb09287.x
Cabeza, R., Anderson, N. D., Locantore, J. K., and McIntosh, A. R. (2002).
Aging gracefully: compensatory brain activity in high-performing older adults.
Neuroimage 17, 1394–1402. doi: 10.1006/nimg.2002.1280
Cabeza, R., Grady, C. L., Nyberg, L., McIntosh, A. R., Tulving, E., Kapur,
S., et al. (1997). Age-related differences in neural activity during memory
encoding and retrieval: a positron emission tomography study. J. Neurosci. 17,
391–400.
Canessa, N., Crespi, C., Motterlini, M., Baud-Bovy, G., Chierchia, G., Pantaleo, G.,
et al. (2013). The functional and structural neural basis of individual differences
in loss aversion. J. Neurosci. 33, 14307–14317. doi: 10.1523/JNEUROSCI.0497-
13.2013
Cappell, K. A., Gmeindl, L., and Reuter-Lorenz, P. A. (2010). Age differences in
prefontal recruitment during verbal working memory maintenance depend on
memory load. Cortex 46, 462–473. doi: 10.1016/j.cortex.2009.11.009
Cole, C., Laurent, G., Drolet, A., Ebert, J., Gutchess, A., Lambert-Pandraud, R.,
et al. (2008). Decision making and brand choice by older consumers. Mark.
Lett. 19, 355–365. doi: 10.1007/s11002-008-9058-x
Daselaar, S. M., Iyengar, V., Davis, S. W., Eklund, K., Hayes, S. M., and Cabeza,
R. E. (2015). Less wiring, more firing: low-performing older adults compensate
for impaired white matter with greater neural activity. Cereb. Cortex 25,
983–990. doi: 10.1093/cercor/bht289
Deichmann, R., Gottfried, J., Hutton, C., and Turner, R. (2003). Optimized EPI
for fMRI studies of the orbitofrontal cortex. Neuroimage 19, 430–441. doi: 10.
1016/s1053-8119(03)00073-9
Ebner, N. C., Freund, A. M., and Baltes, P. B. (2006). Developmental changes in
personal goal orientation from young to late adulthood: from striving for gains
to maintenance and prevention of losses. Psychol. Aging 21, 664–678. doi: 10.
1037/0882-7974.21.4.664
Ekman, P., and Friesen, W. V. (1976). Measuring facial movement. Environ.
Psychol. Nonverbal Behav. 1, 56–75. doi: 10.1007/bf01115465
Elman, I., Ariely, D., Mazar, N., Aharon, I., Lasko, N. B., Macklin, M. L.,
et al. (2005). Probing reward function in post-traumatic stress disorder with
beautiful facial images. Psychiatry Res. 135, 179–183. doi: 10.1016/j.psychres.
2005.04.002
Eppinger, B., Hämmerer, D., and Li, S.-C. (2011). Neuromodulation of reward-
based learning and decision making in human aging. Ann. N Y Acad. Sci. 1235,
1–17. doi: 10.1111/j.1749-6632.2011.06230.x
Eppinger, B., Nystrom, L. E., and Cohen, J. D. (2012). Reduced sensitivity to
immediate reward during decision-making in older than younger adults. PLoS
One 7:e36953. doi: 10.1371/journal.pone.0036953
Erdem, T., Swait, J., and Valenzuela, A. (2006). Brands as signals: a cross-country
validation study. J. Mark. 70, 34–49. doi: 10.1509/jmkg.2006.70.1.34
Florio, T., Capozzo, A., Nisini, A., Lupi, A., and Scarnati, E. (1999). Dopamine
denervation of specific striatal subregions differentially affects preparation and
execution of a delayed response task in the rat. Behav. Brain Res. 104, 51–62.
doi: 10.1016/s0166-4328(99)00045-5
Gasic, G. P., Smoller, J. W., Perlis, R. H., Sun, M., Lee, S., Kim, B. W., et al.
(2009). BDNF, relative preference and reward circuitry responses to emotional
communication. Am. J. Med. Genet. B Neuropsychiatr. Genet. 150B, 762–781.
doi: 10.1002/ajmg.b.30944
Good, C. D., Johnsrude, I. S., Ashburner, J., Henson, R. N., Fristen, K. J.,
and Frackowiak, R. S. (2001). A voxel-based morphometric study of ageing
in 465 normal adult human brains. Neuroimage 14, 21–36. doi: 10.1006/
nimg.2001.0786
Grady, C. L., and Craik, F. I. (2000). Changes in memory processing with age. Curr.
Opin. Neurobiol. 10, 224–231. doi: 10.1016/s0959-4388(00)00073-8
Grady, C. L., McIntosh, A. R., Horwitz, B., Maisog, J. M., Ungerleider, L. G.,
Mentis, M. J., et al. (1995). Age-related reductions in human recognition
memory due to impaired encoding. Science 269, 218–221. doi: 10.1126/science.
7618082
Grady, C. L., McIntosh, A. R., Rajah, M. N., Beig, S., and Craik, F. I. (1999). The
effects of age on the neural correlates of episodic encoding. Cereb. Cortex 9,
805–814. doi: 10.1093/cercor/9.8.805
Hayes, D. J., and Northoff, G. (2012). Common brain activations for painful
and non-painful aversive stimuli. BMC Neurosci. 13:60. doi: 10.1186/1471-
2202-13-60
Heckhausen, J. (1997). Developmental regulation across adulthood: primary and
secondary control of age-related challenges. Dev. Psychol. 33, 176–187. doi: 10.
1037/0012-1649.33.1.176
Heckhausen, J., Wrosch, C., and Schulz, R. (2010). A motivational theory of life-
span development. Psychol. Rev. 117, 32–60. doi: 10.1037/a0017668
Hedden, T., and Gabrieli, J. D. E. (2004). Insights into the ageing mind: a
view from cognitive neuroscience. Nat. Rev. Neurosci. 5, 87–96. doi: 10.1038/
nrn1323
Johnson, J. G., and Busemeyer, J. R. (2010). Decision making under risk
and uncertainty. Wiley Interdiscip. Rev. Cogn. Sci. 1, 736–749. doi: 10.
1002/wcs.76
Kahneman, D., and Tversky, A. (1979). Prospect theory: an analysis of decision
under risk. Econom. J. Econom. Soc. 47, 263–292. doi: 10.2307/1914185
Kensinger, E. A., and Corkin, S. (2008). ‘‘Amnesia: Point and Counterpoint,’’
in Learning Theory and Behavior, Vol. 1 of Learning and Memory - A
Comprehensive Reference (Vol. 4), eds R. Menzel and J. Byrne (Oxford: Elsevier
Press), 259–286.
Kim, B. W., Kennedy, D. N., Lehár, J., Lee, M. J., Blood, A. J., Lee, S.,
et al. (2010). Recurrent, robust and scalable patterns underlie human
approach and avoidance. PLoS One 5:e10613. doi: 10.1371/journal.pone.
0010613
Kober, H., Barrett, L. F., Joseph, J., Bliss-Moreau, E., Lindquist, K., and Wager,
T. D. (2008). Functional grouping and cortical-subcortical interactions in
Frontiers in Human Neuroscience | www.frontiersin.org 10 April 2015 | Volume 9 | Article 176
50

Viswanathan et al. Age and loss aversion
emotion: a meta-analysis of neuroimaging studies. Neuroimage 42, 998–1031.
doi: 10.1016/j.neuroimage.2008.03.059
Lambert-Pandraud, R., and Laurent, G. (2010). ‘‘Impact of age on brand
choice,’’ in The Aging Consumer: Perspectives from Psychology and Economics,
eds A. Drolet, N. Schwartz and C. Yoon (Routledge: Psychology Press),
191–208, 18.
Lee, M. J., Gilman, J., Kuhnen, C., Lee, S., Kuster, J., Washburn, J., et al. (2012).
‘‘Amygdala volume is related to the slope of the negative utility function,’’
in 24th Annual Convention of the Association for Psychological Science
(Chicago, IL).
Levy, B., Ariely, D., Mazar, N., Chi, W., Lukas, S., and Elman, I. (2008). Gender
differences in the motivational processing of facial beauty. Learn. Motiv. 39,
136–145. doi: 10.1016/j.lmot.2007.09.002
Li, Y., Baldassi, M., Johnson, E. J., and Weber, E. U. (2013). Complementary
cognitive capabilities, economic decision making and aging. Psychol. Aging 28,
595–613. doi: 10.1037/a0034172
Madden, D. J., Turkington, T. G., Provenzale, J. M., Denny, L. L., Hawk,
T. C., Gottlob, L. R., et al. (1999). Adult age differences in the
functional neuroanatomy of verbal recognition memory. Hum. Brain
Mapp. 7, 115–135. doi: 10.1002/(sici)1097-0193(1999)7:2<115::aid-hbm5>3.0.
co;2-n
Makris, N., Gasic, G. P., Kennedy, D. N., Hodge, S. M., Kaiser, J. R., Lee, M. J.,
et al. (2008). Cortical thickness abnormalities in cocaine addiction—a reflection
of both drug use and a pre-existing disposition to drug abuse? Neuron 60,
174–188. doi: 10.1016/j.neuron.2008.08.011
Makris, N., Gasic, G. P., Seidman, L. J., Goldstein, J. M., Gastfriend, D. R., Elman,
I., et al. (2004). Decreased absolute amygdala volume in cocaine addicts. Neuron
44, 729–740. doi: 10.1016/j.neuron.2004.10.027
Mata, R., Josef, A. K., Samanez-Larkin, G. R., and Hertwig, R. (2011). Age
differences in risky choice: a meta-analysis. Ann. N Y Acad. Sci. 1235, 18–29.
doi: 10.1111/j.1749-6632.2011.06200.x
Mata, R., and Nunes, L. (2010). When less is enough: cognitive aging, information
search and decision quality in consumer choice. Psychol. Aging 25, 289–298.
doi: 10.1037/a0017927
Meunier, D., Stamatakis, E. A., and Tyler, L. K. (2014). Age-related functional
reorganization, structural changes and preserved cognition. Neurobiol. Aging
35, 42–54. doi: 10.1016/j.neurobiolaging.2013.07.003
Mittner, M., Boekel, W., Tucker, A. M., Turner, B. M., Heathcote, A., and
Forstmann, B. U. (2014). When the brain takes a break: a model-based analysis
of mind wandering. J. Neurosci. 34, 16286–16295. doi: 10.1523/JNEUROSCI.
2062-14.2014
Mohr, P. N. C., Li, S.-C., and Heekeren, H. R. (2010). Neuroeconomics
and aging: neuromodulation of economic decision making in old age.
Neurosci. Biobehav. Rev. 34, 678–688. doi: 10.1016/j.neubiorev.2009.
05.010
Montgomery, C. A., and Wernerfelt, B. (1992). Risk reduction and umbrella
branding. J. Bus. 65, 31–50. doi: 10.1086/296556
Oldfield, R. C. (1971). The assessment and analysis of handedness: the
Edinburgh inventory. Neuropsychologia 9, 97–113. doi: 10.1016/0028-3932(71)
90067-4
Paraschiv, C., and L’Haridon, O. (2008). Aversion aux pertes: origine,
composantes et implications marketing. Rech. Appl. En Mark. 23, 67–83.
doi: 10.1177/076737010802300204
Park, D. C., and Reuter-Lorenz, P. (2009). The adaptive brain: aging and
neurocognitive scaffolding. Annu. Rev. Psychol. 60, 173–196. doi: 10.
1146/annurev.psych.59.103006.093656
Paulsen, D. J., Carter, R. M., Platt, M. L., Huettel, S. A., and Brannon, E. M.
(2012a). Neurocognitive development of risk aversion from early childhood
to adulthood. Front. Hum. Neurosci. 5:178. doi: 10.3389/fnhum.2011.
00178
Paulsen, D. J., Platt, M. L., Huettel, S. A., and Brannon, E. M. (2012b). From
risk-seeking to risk-averse: the development of economic risk preference
from childhood to adulthood. Front. Psychol. 3:313. doi: 10.3389/fpsyg.2012.
00313
Payer, D. E., Guttman, M., Kish, S. J., Tong, J., Strafella, A., Zack, M., et al. (2015).
[
11
C]-(+)-PHNO PET imaging of dopamine D2/3 receptors in Parkinson’s
disease with impulse control disorders. Mov. Disord. 30, 160–166. doi: 10.
1002/mds.26135
Perlis, R. H., Holt, D. J., Smoller, J. W., Blood, A. J., Lee, S., Kim, B. W., et al.
(2008). Association of a Polymorphism Near CREB1 with differential aversion
processing in the Insula of Healthy participants. Arch. Gen. Psychiatry 65,
882–892. doi: 10.1001/archgenpsychiatry.2008.3
Raz, N. (2000). ‘‘Aging of the brain and its impact on cognitive performance:
integration of structural and functional findings,’’ in The Handbook of Aging
and Cognition, 2nd Edn. eds F. I. M. Craik and T. A. Salthouse (Mahwah, NJ:
Lawrence Erlbaum Associates Publishers), 1–90.
Raz, N., Lindenberger, U., Rodrigue, K. M., Kennedy, K. M., Head, D., Williamson,
A., et al. (2005). Regional brain changes in aging healthy adults: general trends,
individual differences and modifiers. Cereb. Cortex 15, 1676–1689. doi: 10.
1093/cercor/bhi044
Reuter-Lorenz, P. A. (2002). New visions of the aging mind and brain. Trends
Cogn. Sci. 6, 394–400. doi: 10.1016/s1364-6613(02)01957-5
Reuter-Lorenz, P. A., Stanczak, L., and Miller, A. C. (1999). Neural
recruitment and cognitive aging: two hemispheres are better than one,
especially as you age. Psychol. Sci. 10, 494–500. doi: 10.1111/1467-9280.
00195
Schindler, R. M., and Holbrook, M. B. (2003). Nostalgia for early experience as
a determinant of consumer preferences. Psychol. Mark. 20, 275–302. doi: 10.
1002/mar.10074
Seidman, L. J., Breiter, H. C., Goodman, J. M., Goldstein, J. M., Woodruff,
P. W., O’Craven, K., et al. (1998). A functional magnetic resonance imaging
study of auditory vigilance with low and high information processing
demands. Neuropsychology 12, 505–518. doi: 10.1037//0894-4105.12.
4.505
Shannon, C. E., and Weaver, W. (1949). The Mathematical Theory of
Communication. Volume 1. (Illinois: University of Illinois Press), 117.
Somerville, L. H., and Casey, B. J. (2010). Developmental neurobiology of cognitive
control and motivational systems. Curr. Opin. Neurobiol. 20, 236–241. doi: 10.
1016/j.conb.2010.01.006
Spear, L. P. (2000). The adolescent brain and age-related behavioral
manifestations. Neurosci. Biobehav. Rev. 24, 417–463. doi: 10.1016/s0149-
7634(00)00014-2
Stebbins, G. T., Carrillo, M. C., Dorfman, J., Dirksen, C., Desmond, J. E., Turner,
D. A., et al. (2002). Aging effects on memory encoding in the frontal lobes.
Psychol. Aging 17, 44–55. doi: 10.1037//0882-7974.17.1.44
Steinberg, L. (2008). A social neuroscience perspective on adolescent risk-taking.
Dev. Rev. 28, 78–106. doi: 10.1016/j.dr.2007.08.002
Strauss, M., Makris, N., Aharon, I., Vangel, M., Goodman, J., Kennedy, D., et al.
(2005). fMRI of sensitization to angry faces. Neuroimage 26, 389–413. doi: 10.
1016/j.neuroimage.2005.01.053
Tom, S. M., Fox, C. R., Trepel, C., and Poldrack, R. A. (2007). The neural basis
of loss aversion in decision-making under risk. Science 315, 515–518. doi: 10.
1126/science.1134239
Turner, G. R., and Spreng, R. N. (2012). Executive functions and neurocognitive
aging: dissociable patterns of brain activity. Neurobiol. Aging 33,
826.e1–826.e13. doi: 10.1016/j.neurobiolaging.2011.06.005
Tversky, A., and Kahneman, D. (1991). Loss aversion in riskless choice: a
reference-dependent model. Q. J. Econ. 106, 1039–1061. doi: 10.2307/293
7956
Tversky, A., and Kahneman, D. (1992). Advances in prospect theory: cumulative
representation of uncertainty. J. Risk Uncertain. 5, 297–323. doi: 10.
1007/bf00122574
Vallesi, A., McIntosh, A. R., and Stuss, D. T. (2011). Overrecruitment in the aging
brain as a function of task demands: evidence for a compensatory view. J. Cogn.
Neurosci. 23, 801–815. doi: 10.1162/jocn.2010.21490
Van Leijenhorst, L., Gunther Moor, B., Op de Macks, Z. A., Rombouts,
S. A. R. B., Westenberg, P. M., and Crone, E. A. (2010). Adolescent
risky decision-making: neurocognitive development of reward and
control regions. Neuroimage 51, 345–355. doi: 10.1016/j.neuroimage.2010.
02.038
Wang, J. X., and Voss, J. L. (2014). Brain networks for exploration decisions
utilizing distinct modeled information types during contextual learning.
Neuron 82, 1171–1182. doi: 10.1016/j.neuron.2014.04.028
Weller, J. A., Levin, I. P., and Denburg, N. L. (2011). Trajectory of risky decision
making for potential gains and losses from ages 5 to 85. J. Behav. Decis. Mak.
24, 331–344. doi: 10.1002/bdm.690
Frontiers in Human Neuroscience | www.frontiersin.org 11 April 2015 | Volume 9 | Article 176
51

Viswanathan et al. Age and loss aversion
White, C. N., Congdon, E., Mumford, J. A., Karlsgodt, K. H., Sabb, F. W., Freimer,
N. B., et al. (2014). Decomposing decision components in the stop-signal task:
a model-based approach to individual differences in inhibitory control. J. Cogn.
Neurosci. 26, 1601–1614. doi: 10.1162/jocn_a_00567
Xu, J., Calhoun, V. D., and Potenza, M. N. (2015). The absence of task-related
increases in BOLD signal does not equate to absence of task-related brain
activation. J. Neurosci. Methods 240, 125–127. doi: 10.1016/j.jneumeth.2014.
11.002
Yamamoto, R., Ariely, D., Chi, W., Langleben, D. D., and Elman, I. (2009).
Gender differences in the motivational processing of babies are determined
by their facial attractiveness. PLoS One 4:e6042. doi: 10.1371/journal.pone.
0006042
Conflict of Interest Statement: The authors declare that the research was
conducted in the absence of any commercial or financial relationships that could
be construed as a potential conflict of interest.
Copyright © 2015 Viswanathan, Lee, Gilman, Kim, Lee, Chamberlain, Livengood,
Raman, Lee, Kuster, Stern and Calder, Mulhern, Blood, Breiter. This is an open-
access article distributed under the terms of the Creative Commons Attribution
License (CC BY). The use, distribution and reproduction in other forums is
permitted, provided the original author(s) or licensor are credited and that the
original publication in this journal is cited, in accordance with accepted academic
practice. No use, distribution or reproduction is permitted which does not comply
with these terms.
Frontiers in Human Neuroscience | www.frontiersin.org 12 April 2015 | Volume 9 | Article 176
52

ORIGINAL RESEARCH ARTICLE
published: 24 December 2013
doi: 10.3389/fnhum.2013.00881
On the interpretation of synchronization in EEG
hyperscanning studies: a cautionary note
Adrian P. Burgess
*
Aston Brain Centre, School of Life and Health Sciences, Aston University, Birmingham, UK
Edited by:
Sven Braeutigam, University of
Oxford, UK
Reviewed by:
Martin Vinck, University of
Amsterdam, Netherlands
Douglas D. Potter, University of
Dundee, UK
*Correspondence:
Adrian P. Burgess, Aston Brain
Centre, School of Life and Health
Sciences, Aston University, Aston
Triangle, Birmingham B4 7ET, UK
e-mail: a.p.burgess@aston.ac.uk
EEG Hyperscanning is a method for studying two or more individuals simultaneously with
the objective of elucidating how co-variations in their neural activity (i.e., hyperconnectivity)
are influenced by their behavioral and social interactions. The aim of this study was to
compare the performance of different hyper-connectivity measures using (i) simulated
data, where the degree of coupling could be systematically manipulated, and (ii)
individually recorded human EEG combined into pseudo-pairs of participants where no
hyper-connections could exist. With simulated data we found that each of the most widely
used measures of hyperconnectivity were biased and detected hyper-connections where
none existed. With pseudo-pairs of human data we found spurious hyper-connections
that arose because there were genuine similarities between the EEG recorded from
different people independently but under the same experimental conditions. Specifically,
there were systematic differences between experimental conditions in terms of the
rhythmicity of the EEG that were common across participants. As any imbalance between
experimental conditions in terms of stimulus presentation or movement may affect
the rhythmicity of the EEG, this problem could apply in many hyperscanning contexts.
Furthermore, as these spurious hyper-connections reflected real similarities between
the EEGs, they were not Type-1 errors that could be overcome by some appropriate
statistical control. However, some measures that have not previously been used in
hyperconnectivity studies, notably the circular correlation co-efficient (CCorr), were less
susceptible to detecting spurious hyper-connections of this type. The reason for this
advantage in performance is discussed and the use of the CCorr as an alternative measure
of hyperconnectivity is advocated.
Keywords: electroencephalography, hyperscanning, phase synchronization, social neuroscience, inter-brain
connectivity, Phase Locking Value
INTRODUCTION
Over the last decade, the development of techniques that allow
the measurement of neural activity from two or more individu-
als simultaneously, known as hyperscanning, has been heralded
with some justification as a promising new field in social neu-
roscience (Dumas, 2011; Dumas et al., 2011; Sanger et al., 2011;
Babiloni and Astolfi, 2012; Konvalinka and Roepstorff, 2012).
Hyperscanning methods have been used in many different social
contexts but all involve the simultaneous recording of brain activ-
ity from two or more individuals with a view to determining how
co-variation in their neural activity is related to their behavioral
and social interactions and this work has resulted in multiple
claims that neural coupling between people is increased during
social interaction. In contrast, there has been little attempt to
determine how valid the methods used to measure connectivity
are in this context and this paper is one attempt to redress that
omission.
The first true hyperscanning study was reported by Montague
et al. (2002) using two linked fMRI scanners with two individuals
playing a variant of the children’s guessing game, “handy-dandy.”
Other studies have used near-Infrared Spectroscopy (Funane
et al., 2011) and there is also a single case study demonstrating
the feasibility of hyperscanning using magnetoencephalography
(Baess et al., 2012). Most studies, however, have relied upon EEG
which, is not only more readily available than other methods but
is also better suited for use in naturalistic social settings, and these
are the focus of this paper.
The first EEG hyperscanning study was reported by Babiloni
et al. (2006) and involved sets of four individuals playing
Tressette, a bridge-like game. Since then, there have b een 30
more EEG publications that meet the definition of hyperscanning
coming from more than 20 independent studies have claimed
increased neural coupling between people engaged in social inter-
action (Babiloni et al., 2006, 2007a,b, 2011, 2012; Flexer and
Makeig, 2007; Tognoli et al., 2007, 2011a,b; Chung et al., 2008;
Tognoli, 2008; Yun et al., 2008; Astolfi et al., 2009, 2010a,b,c,
2011a,b, 2012; Lindenberger et al., 2009; Dumas et al., 2010,
2012a,b; Fallani et al., 2010; Dodel et al., 2011; Lachat et al., 2012;
Naeem et al., 2012a,b; Sanger et al., 2012, 2013; Yun et al., 2012;
Kawasaki et al., 2013). The methods used to establish neural cou-
pling between people have been very consistent and nearly all
studies have used one of three methods: (i) covariance in ampli-
tude or power, (ii) Partial Directed Coherence (PDC); (Baccala
and Sameshima, 2001), and (iii) phase synchrony, mostly the
Frontiers in Human Neuroscience www.frontiersin.org December 2013 | Volume 7 | Article 881
|
HUMAN NEUROSCIENCE
53
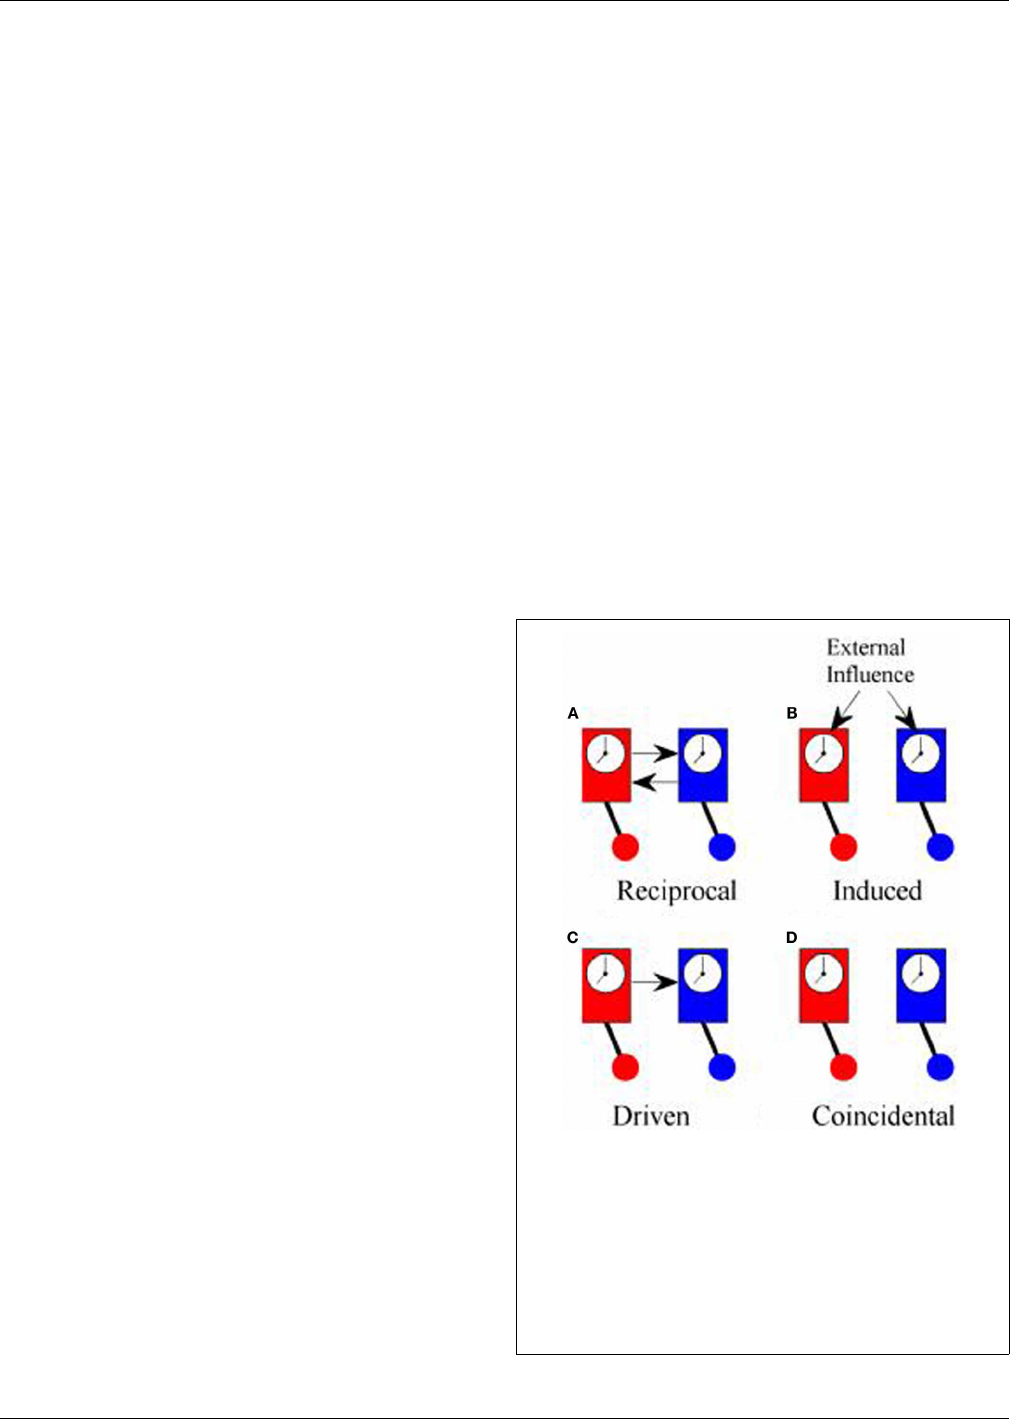
Burgess EEG hyperscanning: a cautionary note
Phase-Locking Value (PLV) (Lachaux et al., 1999)oravariant
thereof.
The most frequently used method for demonstrating brain-
to-brain coupling between socially interacting individuals, used
in 12 reports, has been to show that there are contiguous, or near
contiguous changes in EEG amplitude or power (Babiloni et al.,
2007b, 2011, 2012; Tognoli et al., 2007; Yun et al., 2008; Astolfi
et al., 2009; Dumas et al., 2012b; Lachat et al., 2012; Naeem et al.,
2012a,b; Yun et al., 2012; Kawasaki et al., 2013). In most cases,
this EEG amplitude/power has been estimated from event-related
changes or from FFT. Showing that there are co-variances in EEG
power is a weak form of association and although it is suggestive
of neural coupling, it is by no means conclusive.
The second most commonly used method has been that of
PDC which was the approach used in the very first EEG hyper-
scanning study (Babiloni et al., 2006)andhasbeenusedinatleast
nine further studies since (Babiloni et al., 2007a,b; Astolfi et al.,
2010a,b,c, 2011a,b, 2012; Fallani et al., 2010). PDC is based on
multivariate autoregressive modeling and Granger Causality and
is designed to be able to show the direction of flow of information
(linear) between two systems (Baccala and Sameshima, 2001). As
such, PDC seems ideally suited to role of identifying inter-brain
coupling in hyperscanning studies, at least in those cases where
when one person’s behavior is driving another’s. However, both
PDC and Granger causality are not without their critics. Friston
(2011), for example, provides a critique of the use of Granger
causality in fMRI research and, some of the limitations he men-
tions apply equally well to EEG research. It is certainly the case
that, as Konvalinka and Roepstorff (2012) have observed, the
results of PDC in hyperscanning studies have not replicated well,
but whether this is related to the use of PDC, or to some other
cause, is not clear.
The final class of measures of brain-to-brain coupling all
involve measures of phase synchrony (Lindenberger et al., 2009;
Dumas et al., 2010, 2012a; Sanger et al., 2012, 2013; Yun et al.,
2012). The first use of phase synchronization as a measure of
coupling with electrophysiological data was by Tass et al. (1998),
who defined synchronization as occurring when
ϕ
n, m
< const,
where const is some suitably small value, n and m are integers,
ϕ
n, m
(t) is the phase difference, nφ
1
(
t
)
− mφ
2
(
t
)
and φ
1, 2
are
the phases of the two oscillators. The most widely used index
of phase locking adopted in hyperscanning studies has been the
Phase Locking Value (PLV) (Lachaux et al., 1999)whichisa
measure that seems well suited for capturing the rapid flow of
information between people in social situations. Interestingly,
some hyperscanning studies have used PLV to characterize behav-
ioral interactions even when they have used other measures of
coupling for the EEG (e.g., Tognoli et al., 2007).
Although both PDC and PLV have been used to measure cou-
pling between cortical oscillations recorded in the EEG from two
or more different people, what they actually measure is quite dif-
ferent in each case and, for this reason, it is worth reviewing
what is meant by synchronization. The first scientific descrip-
tion of synchronization came in 1665 from Christiaan Huygens
who wrote a letter to the Royal Society in which he described “an
odd kind of sympathy” in which the pendulums of identical clocks
mounted on the same support came to swing exactly out of phase
(i.e., anti-phase) regardless of the phase they had been in when
they had been set running (Pikovsky et al., 2001; Klarreich, 2002).
The explanation of this phenomenon is that the swing of the pen-
dulum in one clock induced small movements in the support
from which the clocks were suspended that would slightly alter the
swing of the pendulum of the second clock. At the same time, the
pendulum of the second clock would induce movements in the
support that affected the swing of the pendulum in the first clock.
These small mutual nudges would continue to shift the phase of
each pendulum until they came to a point where the nudge from
one would exactly counterbalance the nudge from the other and
this would occur when the pendulums were precisely anti-phase.
In modern terms, the two clocks were in a system of reciprocal
negative feedback and would continue to change until the sys-
tem reached the state of minimum energy transfer between the
two. Minimum information transfer (in fact, zero energy trans-
fer) occurs in the anti-phase condition. An example of in-phase
reciprocal synchronization is shown in Figure 1A.
True synchronization then, is of interest in neuroscience
because it is a reliable marker of the flow of information
between elements of a system. Simply observing a consistent
phase relationship between two oscillators (clocks, human brains
etc.), however, does not necessarily mean that they are in the
FIGURE 1 | Types of synchrony. (A) Shows “reciprocal” synchronization
whereby the pendulums of the clocks swing in phase because there is
reciprocal influence between the two; (B) shows “induced”
synchronization whereby the phase of the pendulums of both clocks are
influenced by a common external driver; (C) shows “driven”
synchronization whereby the pendulum of one clock influences the phase
of the pendulum of the other clock without any reciprocal influence; (D)
shows “coincidental” synchronization where there is no coupling between
the clocks but the pendulums remain in a fixed phase relationship to each
other because they both swing at the same frequency.
Frontiers in Human Neuroscience www.frontiersin.org December 2013 | Volume 7 | Article 881
|
54

Burgess EEG hyperscanning: a cautionary note
same condition of reciprocal information exchange displayed by
Huygens’ clocks. Synchronization might also occur if both clocks
are driven by some external influence as in Figure 1B.Inhyper-
scanning experiments, this might occur if the participants simul-
taneously experience the same stimuli such as watching a movie
together, even though they are not directly interacting (Hasson
et al., 2008). Alternatively, the influence between oscillators might
be one-way with one oscillator driving another, Figure 1C,which
is exactly the type of coupling that PDC is designed to iden-
tify. Each of these types of synchronization might be of interest,
depending upon the context of the study, and it would often be of
interest to know which type of synchronization is being observed.
In practice, however, these different types of synchronization may
be difficult to tell apart.
There is a fourth type of synchrony which is not really syn-
chronization at all: coincidental synchrony, Figure 1D.Thisisa
phenomenon which is generally of no interest and, in the context
of hyperscanning, has nuisance value only. Unfortunately, it is not
a rare phenomenon. Had Huygens’s clocks been too far apart to
influence each other, they would have remained in the same fixed
phase relationship to each other indefinitely. Over time, small dif-
ferences between the clocks would lead to a gradual shift in phase
but, at least over short periods of time, the phase difference would
be nearly constant. In general, two oscillators will show a consis-
tent phase relationship whenever they share a common frequency
of oscillation. To put this in the context of the brain, consider
two adults, each with a dominant alpha rhythm of ∼10 Hz sit-
ting in isolation in separate rooms. If we were to measure their
EEG, we could expect to see a fairly consistent phase relation-
ship between their alpha rhythms, at least over short time scales,
even though there is no communication between them. This sit-
uation is exactly the same as the example of the identical but
unconnected pendulum clocks and stems solely from the fact that
they share a common frequency of oscillation. It follows from this
that simply observing a consistent phase relationship does not
imply synchronization or information exchange or, as Pikovsky
et al. (2001) put it, “synchronous variation of two variables does not
necessarily imply synchronization.” The critical feature of synchro-
nizationisnotthattheoscillatorsaresynchronousbutthatthere
is “...adjustment of their rhythms, or appearance of phase locking
due to interaction”(Tass et al., 1998).
To put this more formally, two oscillators can be said to be syn-
chronized if deviations from the regular oscillatory cycle of one
oscillator provides information about deviations in the oscillatory
cycle of the other. Such a definition suggests that a measure of the
co-variation or correlation between oscillators might sometimes
be more useful. It is for this reason, that most hyperscanning stud-
ies do not simply measure phase coupling in the EEG between
individuals but compare the degree of coupling between differ-
ent experimental conditions. In the best studies, the experimental
conditions are identical in every way except that in one case the
participants are socially engaged and in the other they are not. In
practice, however, this level of experimental control is difficult to
achieve.
The aim of this paper is to examine the performance
of currently used measures of phase synchronization in
hyperconnectivity studies (PDC and PLV) and compare them
with alternative measures including coherence (COH), the cir-
cular correlation co-efficient (CCorr) and Kraskov’s Mutual
Information estimator (KMI) (Kraskov et al., 2004). Good per-
formance, in this context, is defined by three qualities. First, the
measure should be unbiased and have a low root mean squared
error of estimation (RMSE). Specifically, when the true connec-
tivity, r = 0, the estimated connectivity should be zero or very
close to it. Second, the estimate of connectivity should increase
monotonically as r increases and third, the estimate of coupling
strength between two channels should be independent of the dis-
tribution of the signal in either of the constituent channels. In
particular, the estimate of coupling strength should be insensi-
tive to changes in the variance of the marginal distributions of
deviations from the expected phase in either channel.
The first comparison included simulated time series where the
degree of connectivity could be systematically varied. The sec-
ond comparison compared EEG from individuals independently
recorded but analyzed as though they had been recorded as part of
a hyperscanning study. Because these EEG recordings were com-
pletely independent and there was no social contract between
participants, a good measure of hyperconnectivity should not
detect any synchronization between them. The first example
of EEG data was from an event-related potential paradigm in
which data recorded around the time of the presentation of a
visual stimulus was used. This is analogous to induced synchrony
(Figure 1B) as there may be some apparent connectivity between
individuals because they share similar external stimulation. The
second example of EEG data was from two independent resting
state conditions in which there was no external stimulation to
induce synchrony.
MATERIALS AND METHODS
MEASURES
Five different methods for estimating functional hyper-
connectivitywereusedinthisstudy.
Coherence (COH)
COH is the traditional Fourier-based method of connectivity and
the Welch estimate of coherence is given by:
COH
xy
=
1
N
N
k = 1
Y
k
f
X
∗
k
f
1
N
N
k = 1
X
k
f
X
∗
k
f
.
1
N
N
k = 1
Y
k
f
Y
∗
k
f
(1)
where X
i
(
ω
)
denotes FFT of the kth segment of the time series
x(t)atfrequencyf and * indicates the transpose and complex
conjugate. The analysis was performed using the MatLab function
mscohere.m. COH values range from 0 to +1.
Partial directed coherence (PDC)
The PDC from y to x is defined as:
PDC
xy
f
=
A
xy
f
a
∗
y
f
.a
x
f
(2)
where A
xy
(f ) is an element in A(f ) which is the Fourier Transform
of the multivariate autoregressive (MVAR) model coefficients,
Frontiers in Human Neuroscience www.frontiersin.org December 2013 | Volume 7 | Article 881
|
55

Burgess EEG hyperscanning: a cautionary note
A(t), of the time series ; a
y
(f )isyth column of A(f ). MVAR
and PDC analysis was performed using the Extended Multivariate
Autoregressive Modeling Toolbox for MatLab (Faes and Nollo,
2011). PDC values range from 0 to +1 but as PDC
x, y
= PDC
y, x
both are reported.
Phase locking value (PLV)
There is an unfortunate terminological confusion over the use of
the term “PLV” as, not only is it often referred to as the Phase
Locking Index (PLI) but, both “PLV” and “PLI” can refer to two
quite different measures that have equations of the identical form
but quite different meaning. The PLV, as orig inally defined by
Lachaux et al. (1999), is estimated by:
PLV
n
=
1
N
N
k = 1
e
i
(
φ
(
t, k
)
−ψ
(
t, k
)
)
(3)
where N isthenumberoftrials,φ
(t, n)
,isthephaseontrial,n
at time t, in channel φ and ψ
(t, n)
in channel ψ. The PLV
n
varies
between0and1where1indicatesperfectphaselockingand0
indicates no phase locking. This form of the PLV
n
is a measure of
the consistency of the phase difference and is related to the inter-
trial variance of the phase difference, σ
2
φ − ψ
, by the relationship
PLV
n
= 1 − σ
2
φ−ψ
. Because this form of the PLV
n
is based on the
phase difference across trials, it is only suitable for event-related
paradigms.
However, there is a variant of the Equation (3) that has been
frequently used in EEG hyperscanning studies which involves
averaging the instantaneous phase differences over time within a
single trial:
PLV
t
=
1
T
T
n = 1
e
i
(
φ
(
t, n
)
−ψ
(
t, n
)
)
(4)
where T is the number of time points. This for m of the PLV is
essentially a measure of the int ra-trial consistency of the phase
differencebetweenchannels.Aswillbecomeclear,thissmall
difference between Equations (3) and (4) has important implica-
tions for the interpretation of EEG hyperscanning methods. In an
attempt to remove any ambiguity, we shall refer to the measure
defined by Equation (3) as the trial-averaged PLV or PLV
n
and
that described by Equation (4) as the time-averaged PLV, PLV
t
.
PLV values range from 0 to +1.
The PLV is a measure of the consistency of the phase-difference
but, as noted above, simply observing that there is a consistent
phase relationship between two signals does not imply covariance
or information exchange or between them. Indeed, the PLV
t
can-
not distinguish between coincidental phase synchronization and
true phase synchronization. To see why phase difference is a poor
measure of information exchange, consider the variance of the
difference in the case of the bivariate normal distribution
1
which
is given by:
σ
2
x − y
= σ
2
x
+ σ
2
y
− 2σ
x
σ
y
ρ, (5)
1
Unfortunately, the equivalent equation for the bivariate von Mises distribu-
tion is not known.
where σ
2
is the variance and ρ is the correlation between the
two distributions x and y.Clearlyσ
2
x − y
can be small, indicating
strong association between the two variables, not only when ρ is
large but when σ
2
x
and σ
2
y
are small. This means that although
σ
2
x − y
is related to ρ, it is a rather poor proxy for it and makes
no sense to measure correlation this way in such cases. The nat-
ural measure of correlation in this case is the Pearson Product
Moment Correlation Coefficient which measures the covariance
of the deviations from the expected (i.e., mean) values of the two
variables.
Circular correlation coefficient (CCorr)
The Pearson Product Moment Correlation Coefficient is not suit-
able for use with circular distributions like phase but there are
several suitable candidates including the Circular Correlation
Coefficient (CCorr) (Jammalamadaka and Sengupta, 2001),
CCorr is a direct parallel to the Pearson Product Moment
Correlation Coefficient for circular data and is given by:
CCorr
φ, ψ
=
N
k = 1
sin
φ − φ
sin
ψ − ψ
N
k = 1
sin
2
φ −
φ
sin
2
ψ −
ψ
(6)
where
φ and ψ are the mean directions for channels 1 and 2
respectively. For oscillatory signals, like the EEG, phase is approxi-
mately uniformly distributed and the population mean directions
are not defined. However, in the case of uniform marginal dis-
tributions, any arbitrary direction can be defined as the mean
without ill effect although for convenience, the sample mean
directions, φ and ψ werealwaysused.UnlikePLV
t
, the Circular
correlation, CCorr, is much more robust to coincidental synchro-
nization. The reason for this is that CCorr measures the circular
covariance of differences between the observed phase and the
expected (i.e., mean) phase. In the case of a perfect oscillator, the
frequency of oscillation will be constant and there will be no vari-
ance. In the case of a sinusoidal oscillation, knowing the frequency
of oscillation and its phase at any single time point provides a
complete description of its behavior. For imperfect oscillators, as
all real-world oscillators are, there will be small variations in phase
over time. However, knowing the phase of such an oscillator in its
recent past makes it possible to predict its phase in the near future.
In the case of two related channels, if one channel is slightly in
advance of its expected phase at a given time, then the phase
in the other channel is also likely to be advanced (for positively
correlated signals; the reverse for negatively correlated signals).
That is, the phase variance of the oscillators co-varies and this
is what CCorr measures. In the case of two unrelated channels,
the phase variance will not co-vary and the CCorr will be zero.
As the PLV measures the phase difference, which is a poor proxy
for phase covariance, it is likely to be poorer at discriminating
between related and unrelated signals. CCorr was measured using
the CircStat toolbox for MatLab (Berens, 2009). CCorr values
range from 0 to +1.
Kraskov mutual information (KMI)
The KMI is a non-parametric estimator of mutual informa-
tion (Kraskov et al., 2004) based nearest-neighbor method for
Frontiers in Human Neuroscience www.frontiersin.org December 2013 | Volume 7 | Article 881
|
56
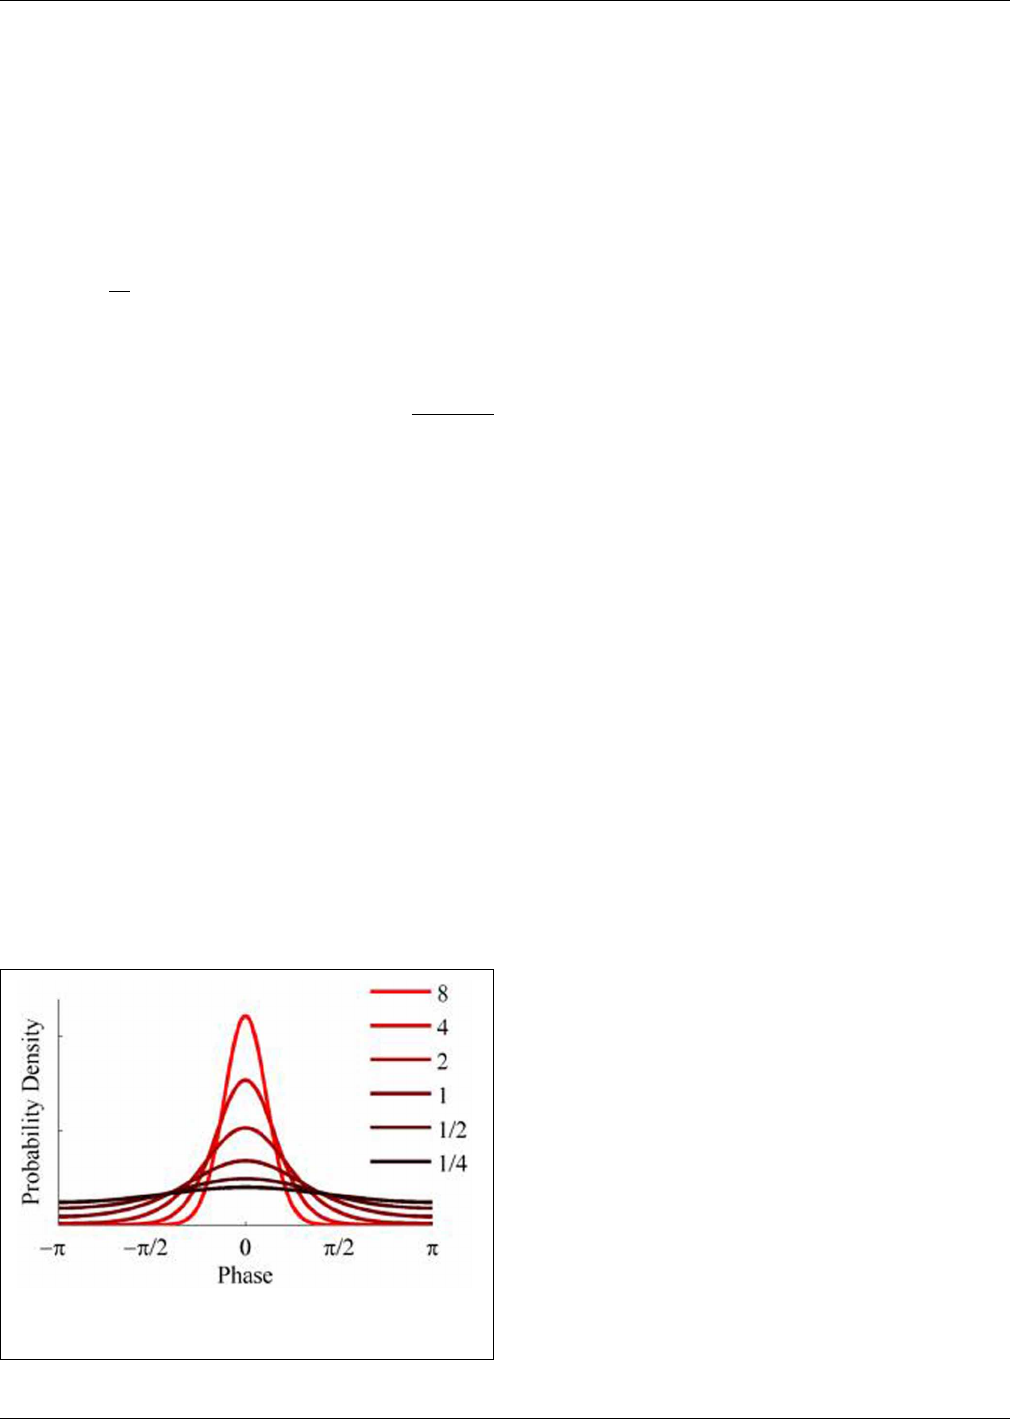
Burgess EEG hyperscanning: a cautionary note
estimating entropy proposed by Kozachenko and Leonenko
(1987) cited in Beirlant et al. (1997). The KMI, adapted for use
with phase data, is given by:
I
φψ
=
(
k
)
+
(
N
)
−
N
i = 1
n
φ
(
i
)
+ 1
+
n
ψ
(
i
)
+ 1
(7)
where (.) is the digamma function, n
φ (i)
isthenumberofpoints
with
φ
i
− φ
j
≤ ε (i)/2andn
(i)
isthenumberofpointswith
ψ
i
− ψ
j
≤
ε
(
i
)
2
; ε(i) is the distance from observation i to its j
th
nearest neighbor and distances are measured with respect to the
maximum norm ε
(
i
)
= max
ε
φ
(
i
)
, φ
ψ
(
i
)
and N is the total
number of independent observations. In the simulations reported
here, j = 5 and the distances were angular distances.
For convenience, all mutual information values were trans-
formed to the r ange 0–1 using the relationship r =
1 − e
−2I
φψ
where, I
φ
, is the mutual information between φ and and, r,
is the correlation from a bivariate normal distribution with the
same mutual information.
SIMULATIONS
The objective of the simulations was to generate time series when
the phase-coupling between the two could be systematically var-
ied. Phase distributions can be generated from the von Mises
distribution, a circular analog of the Gaussian distribution that
ranges from -π to +π. The von Mises distribution is defined by
its mean direction, μ, and concentration, κ, which are analogous
to the Gaussian mean, μ, and the reciprocal of the variance,1/σ
2
,
respectively. Examples of the von Mises distribution for μ = 0
and varying values of κ are shown in Figure 2. T he von Mises
distribution can be generalized to two dimensions where phase
can be represented as a distribution on the surface of a torus
(Singh et al., 2002). The covariance between the two dimensions
of the bivariate von Mises distribution is controlled by a param-
eter λ. The joint probability density function is defined by the 5
parameters (μ
1
, μ
2
, κ
1
, κ
2
,andλ) and from this it is a simple
matter of numerical integration to calculate the mutual infor-
mation between the two distributions (see Appendix). Given the
FIGURE 2 | Probability density functions of the von Mises distribution
for different values of concentration, κ.
probability density function of a 2-D von Mises distributions it is
a simple matter to generate random variables with any different
levels of mutual information and concentration (Figure 3)using
the acceptance/rejection method (Gentle, 1998).
To generate a time series with randomly varying phase shifts,
we first generated an unwrapped and perfectly regular phase series
[0, 2π,3π ....nπ], and generated n independent samples from a
von Mises random distribution [φ
1
; φ
2
; φ
3
; ....φ
n
]andadded
the two together giving a new phase series [0 + φ
1
,2π + φ
2
,
3π + φ
3
,....nπ + φ
n
]. The von Mises random v ariables were
added as phase deviations to the expected regular phase series.
In this case, the aim was to simulate an alpha rhythm with a mean
frequency of f = 10 Hz sampled at = 500 Hz. The phase series
[0, 2π,3π ....nπ] corresponded to a time series of [0, 0.1, 0.2,
0.3. . . n/f ]s so the phase values for intermediate time points from
0ton/f seconds in 1/ second intervals were estimated by spline
interpolation. Finally, the pseudo-alpha rhythm was obtained by
taking the sine of the interpolated phase series. This created a
smoothly frequency-varying oscillation with constant amplitude
in which the variance of the frequency was determined by, κ,the
concentration parameter of the von Mises distribution. In these
simulations, therefore, 1/κ is a measure of the variance of the
marginal distributions of deviations from the expected phase. An
example is shown in Figure 4. It is a simple matter to general-
ize this process to the 2D cases using random variables a 2D-von
Mises Distribution and the degree of dependency can be con-
trolled by the parameter λ. For the simulations values of λ were
chosen to approximate bivariate correlations of [0, 0.2, 0.4, 0.6,
0.8] and the concentration values of, κ, were [0.25, 0.5, 1, 2, 4,
8]. One hundred samples of 100 s epochs of pseudo-alpha were
generated for analysis for each value of λ and κ.
In order to generate pseudo-alpha time series in which there
was a time-lagged dependency between channels, n + 1indepen-
dent samples were drawn from a 2D-von Mises distribution [φ
1
;
φ
2)
; φ
3
; ....φ
n + 1
] and added to the phase series giving two new
phase series [0 + f
(1, 1)
,2π + φ
(2, 1)
,3π + φ
(3, 1)
....nπ + φ
(n,1)
]
and [0 + φ
(2, 2)
,2π + φ
(3, 2)
,3π + φ
(4, 2)
,....nπ + φ
(n + 1, 2)
].
The rest of the procedure was identical to that for the zero-lagged
time series but with the result that the two pseudo-alpha time
series were maximally correlated with a lag of 100 ms but uncor-
related at lag 0. That is, one time series “caused” the other in the
Granger sense.
Hyperconnectivity analysis
COH was estimated for each pair of time series using Welch’s
method with non-overlapping Hamming Windows of 1024 ms
Equation (1). For PDC, an MVAR model was generated for each
100 s pair of time series using a model order determined by the
Akaike Information Criterion. The PDC was estimated from the
MVAR coefficients following Equation (2). COH and PDC values
were averaged across each of the 100 randomizations.
Estimates of PLV
t
, CCorr, and KMI were derived from the
instantaneous phase of the time series. Instantaneous phase at
each time point in each time series was estimated from the Hilbert
Transform of the pseudo-alpha data using FFT with a window of
1024 ms and it was these estimates that were used for estimating
coupling strength. The Hilbert Transform produces a “real” and
Frontiers in Human Neuroscience www.frontiersin.org December 2013 | Volume 7 | Article 881
|
57
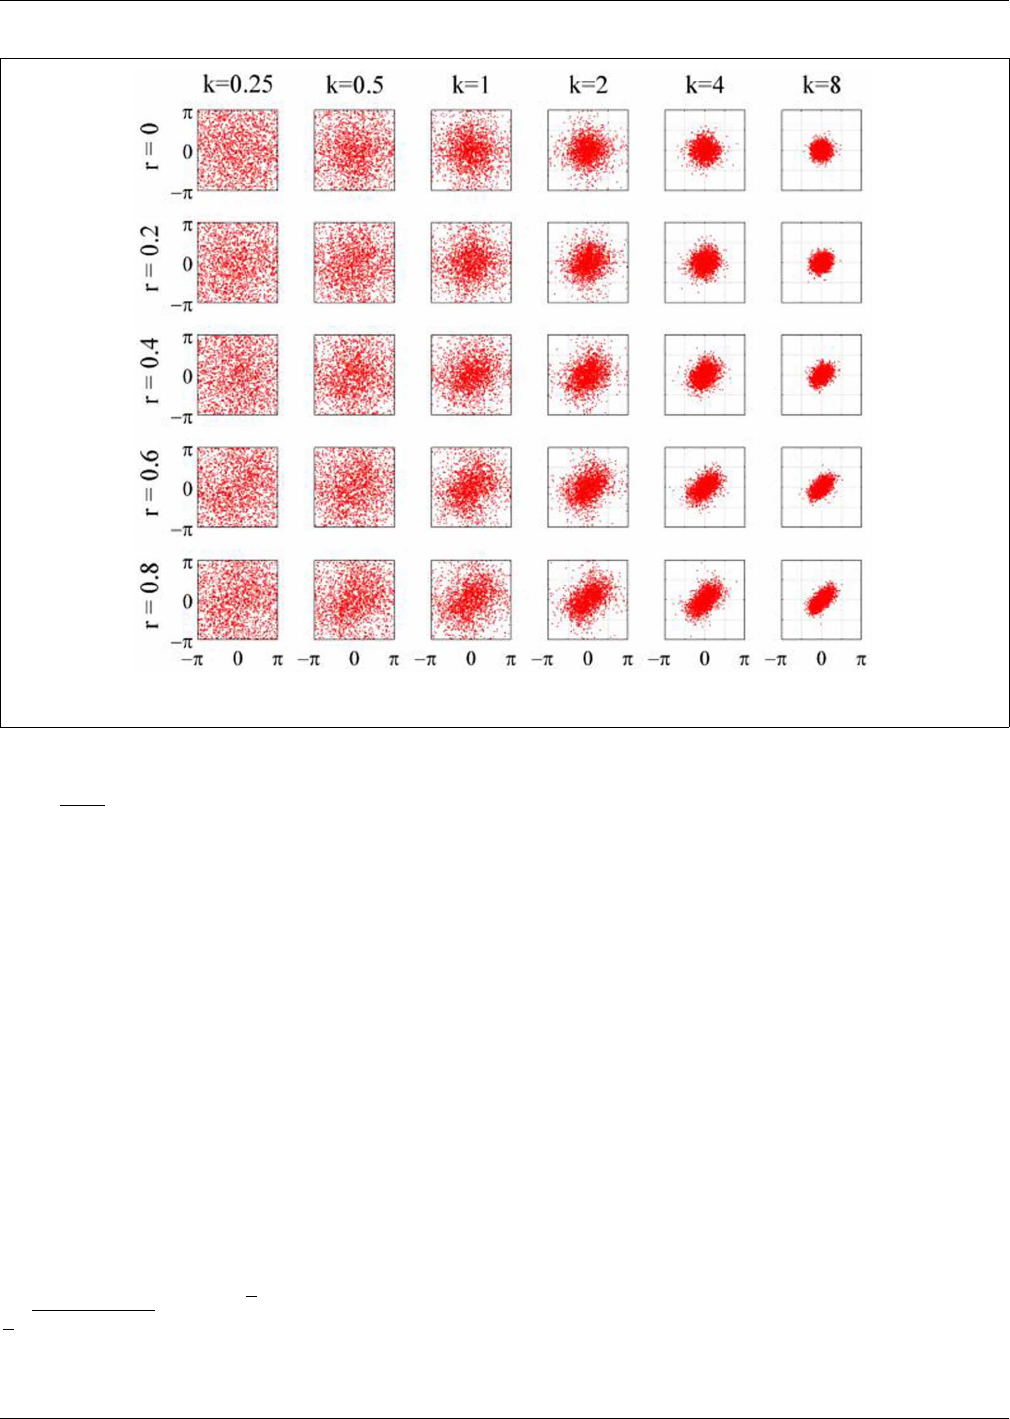
Burgess EEG hyperscanning: a cautionary note
FIGURE 3 | Scatterplots of the 2D-von Mises distribution for different values of concentration, κ, and correlation, r.
“imaginary” time series and the phase was estimated by φ
(
t
)
=
tan
−1
Imag
(
t
)
Real
(
t
)
. In all cases, the Hilbert-estimated phases were
very close to “true” phase values that had be en entered into the
simulation. The phase-series were divided into epochs of 1024 ms
and the PLV
t
and CCorr were estimated for each using Equations
(4) and (6) respectively. The resulting values were averaged across
all epochs and all randomizations. This procedure of estimat-
ing hyperconnectivity over short epochs and averaging follows
the methods reported in the literature (Lindenberger et al., 2009;
Dumas et al., 2010, 2012a; Sanger et al., 2012, 2013; Yun et al.,
2012) each of whom used segments of EEG of less than 800 ms.
As estimation of KMI assumes independent observations, the
instantaneous phase data was down-sampled to a rate equal to
the mean frequency of the signal i.e., 10 Hz. An estimate of KMI
was derived for each of the down-sampled segments of pseudo-
alpha phase data using E quation (7) and averaged across the 100
random samples.
Statistical analysis
Each of the measures of connectivity was evaluated in terms of
their bias and Root Mean Squared Error of Estimation (RMSE)
for the case where the true connectivity, r,waszero.Biasand
RMSE were defined as: Bias =
1
N
N
k = 1
(
r
i
−
ˆ
r
i
and RMSE =
1
N
N
k = 1
(r
i
−
ˆ
r
i
)
2
where r
i
is the true connectivity and
ˆ
r
i
is the
estimate of the true connectivity. Note that for COH, PDC and
PLV
t
,wherethevaluesaredefinedtobegreaterthanorequalto
zero, the Bias and RMSE are equal. Mutual information, by def-
inition must also be greater than or equal to zero but, the KMI
estimator can produce small negative values and for this reason,
Bias will not always be equal to RMSE.
HUMAN EEG
PARTICIPANTS
The data used for this study are a subset of a dataset that has
previously been reported on and full details of the experiment
are reported in Burgess (2012). Participants were 10 healthy
young adults (5 women, 5 men) recruited through advertisement
with a mean age of 25.4 years (SD = 5.8; range 20–40). Written
informed consent was obtained from all subjects and the experi-
ment was conducted as approved by the Riverside Research Ethics
Committee. All investigations were conducted according to the
principles expressed in the Declaration of Helsinki and data were
analyzed anonymously.
Procedure
EEG was recorded from participants at rest (60 s Eyes Open
Relaxed and 60 s Eyes Closed Relaxed) and as they were presented
with a series of faces. There were 90 trials which included the
presentation of a fixation cross for 1000 ms followed by a photo-
graph of a face for the same duration. Each photograph was of the
head and shoulders of a man or woman with neutral emotional
Frontiers in Human Neuroscience www.frontiersin.org December 2013 | Volume 7 | Article 881
|
58
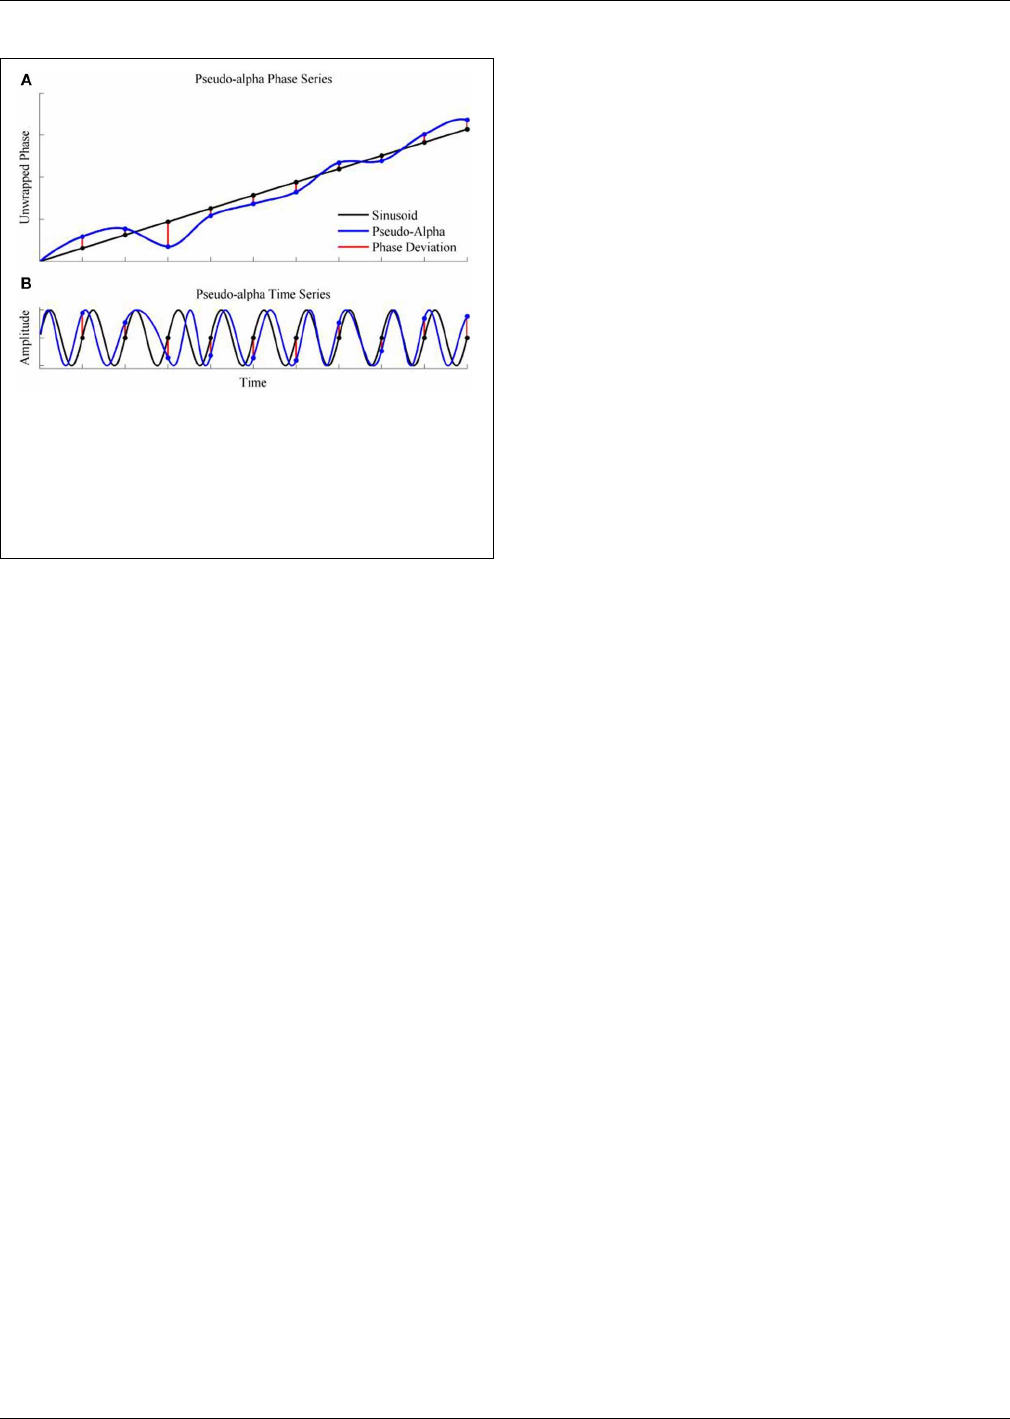
Burgess EEG hyperscanning: a cautionary note
FIGURE 4 | Simulation of the pseudo-alpha rhythm. (A) Shows the
unwrapped phase of a regular 10 Hz sinusoid (Black line) with random
phase deviations generated from the von Mises distribution (Red lines) and
added to the sinusoid at 100 ms interval. The phase series for the
pseudo-alpha rhythm is formed by a smooth line (Blue line) that connects
the points of the sinusoid + phase deviation. (B) Shows the times series
generated by taking the sine of the phase series in (A).
expressions, facing directly toward the participant. The inter-trial
interval consisted of a blank screen and randomly varied between
1000 and 2000 ms. All data were recorded from participants com-
pletely independently and at separate times. There was no social
interaction between any of the participants at any time during the
recording of these data.
Materials and equipment
Twenty-eight electrodes were positioned on the scalp using
an ECI electrode cap with electrodes placed according to the
International 10–20 system with an additional nine electrodes:
Oz, FC5/6, CP1/2, CP5/6 PO1/2. Horizontal electro-oculogram
(EOG) was recorded from the external canthus of each eye, and
the vertical EOG was recorded from the supra- to suborbit of
the left eye. Electrode impedances were all under 5 k. EEG and
EOG were amplified using a 32 channel Neuroscan Synapse-II
System. Signal bandpass was 0.1–100 Hz and the digital sampling
frequency was 500 Hz. Reference was to the left ear and converted
to average reference offline.
Data preparation
For the resting state, data were divided into consecutive epochs of
1024 ms. For the event-related paradigm, EEG was divided into
pre-stimulus and post-stimulus epochs each of 1024 ms dura-
tion. The pre-stimulus epochs included data from −1024 ms
to −1 ms and the post-stimulus epochs contained data from +1
to +1024 ms where zero was defined as the time of stimulus onset.
For both data sets, epochs including values outside the
range −100 to +100 μV range were excluded from the analysis.
In order to facilitate the comparison between EEG recorded from
different individuals, it was convenient to ensure that each partic-
ipant contributed the same amount of data. For this reason, only
the first 20 epochs for the resting state conditions and the first 50
epochs for the event-related paradigm were included.
Hyperconnectivity analysis
The data from each participant was paired with e very other par-
ticipant and analyzed as if they had been recorded jointly in
a hyperscanning experiment. With 10 participants, this gave a
total of 45 pseudo-pairings, one of whom was arbitrarily nomi-
nated as participant 1 and the other as participant 2. Twenty-eight
channels of EEG were recorded for each person meaning that
there were 56 channels for each pair of participants giving a total
of 1540 possible different channel combinations. Of these, only
the 784 hyper-connections that paired data between people were
considered further.
For each pairing, EEG data were concatenated across epochs
in preparation for the hyperconnectivity analysis. For the rest-
ing state data, 20 consecutive epochs of artifact-free EEG were
joined together from each condition to form 20.48 s of data
foreachoftheeyesopenandeyesclosedconditions.Forthe
event-related data, 50 epochs of pre-stimulus and post-stimulus
EEG were concatenated separately to give two time series of
51.2 s each.
COH and PDC were estimated from these concatenated data
for each participant separately using the method described for
simulated data and hyperconnectivity estimates were the high-
est values obtained in each of the Theta (4–8 Hz), Alpha (8–12),
Beta1 (13–19 Hz), Beta2 (20–29 Hz), and Gamma (30–70 Hz) fre-
quency bands. For the phase-based measures, PLV
t
,CCorrand
KMI, the concatenated data were filtered into the same frequency
bands using Butterworth filters and the instantaneous phase was
estimated using the Hilbert transform in the same way as for the
simulated data. PLV
t
and CCorr were estimated for each 1024 ms
epoch and frequency band separately and averaged. The KMI was
estimated from the same data down-sampled to 10 Hz.
Statistical analysis
For the rest conditions, connectivity in the Eyes Open and Eyes
Closed conditions were compared and for the event-related data,
connectivity in the pre-stimulus period was compared to that in
the post-stimulus per iod. The difference in connectivity between
experimental conditions was estimated for each of the 784 elec-
trode pairs and averaged across each of the 45 pseudo-pairs of
participants.
In order to determine if the differences were reliable, a ran-
domization testing procedure was used to control the Type-1
error (Holmes et al., 1996; Burgess and Gruzelier, 1997). Consider
one electrode pair; under the null hypothesis, there should be no
difference between conditions and so randomly swapping the data
between them and calculating the difference many times should
provide a good estimate of the variability in the connectivity of
that electrode pair that is due to chance. If the difference in con-
nectivity observed in the real data set is larger than 95% of the
differences observed in the randomized data sets, it is reasonable
to say that that difference is greater than might be expected by
chance.Toextendthisideatomultipleelectrodepairs,insteadof
examining the distribution of the connectivity difference at each
electrodepairinturn,thedistributionofthelargestdifferencein
connectivity across all electrode pairs for each randomization was
examined. The 95th percentile of the distribution of the maxi-
mum difference represents the value that would not be exceeded
Frontiers in Human Neuroscience www.frontiersin.org December 2013 | Volume 7 | Article 881
|
59
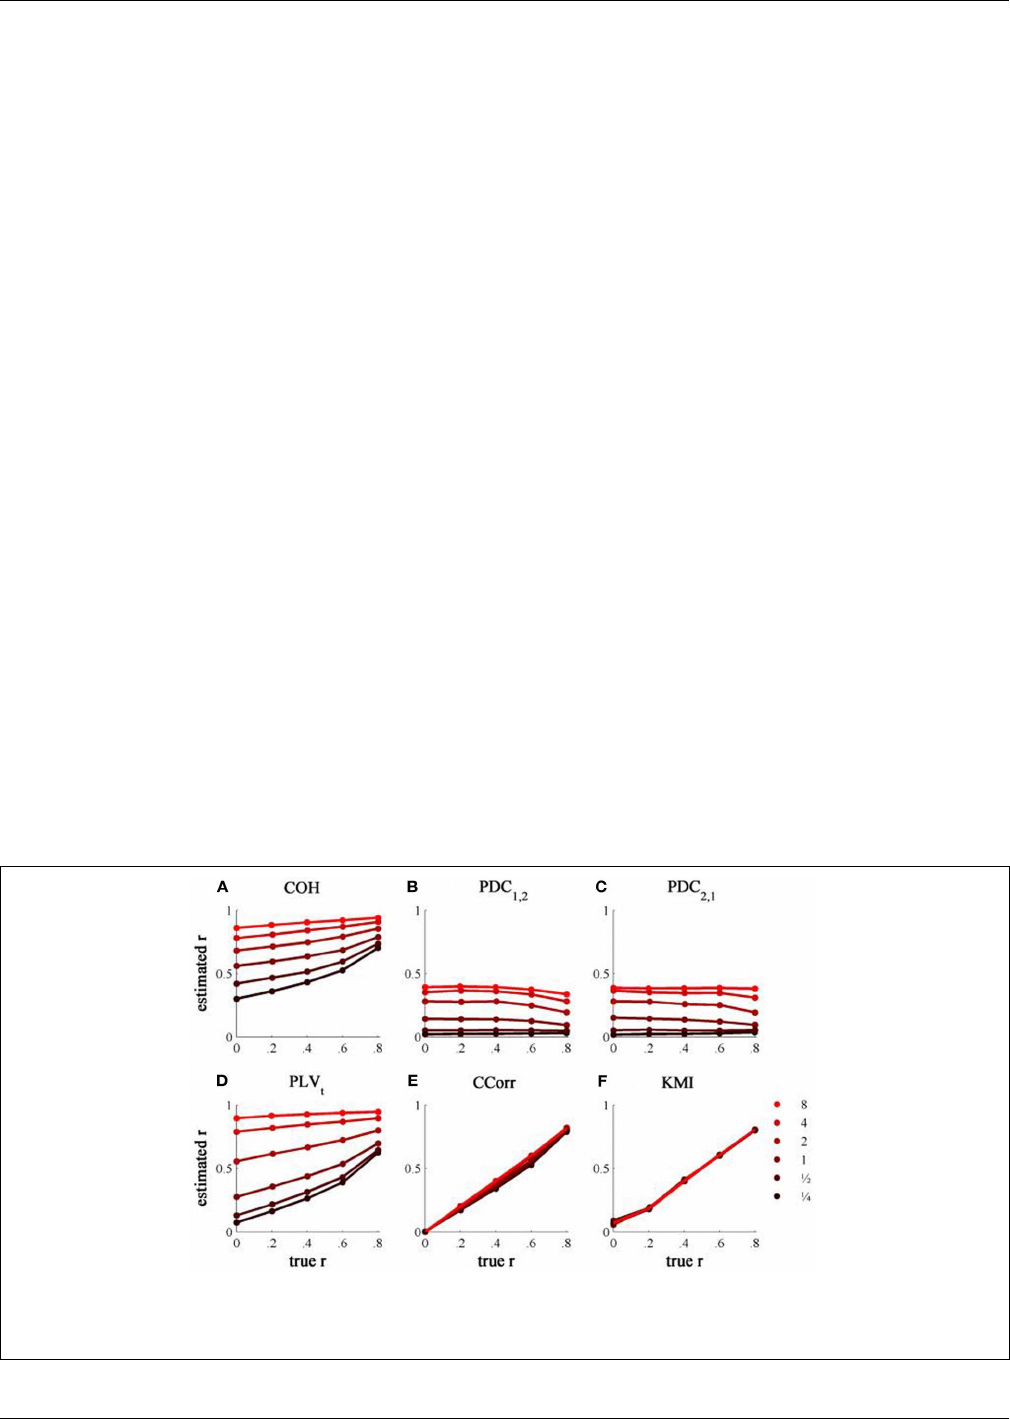
Burgess EEG hyperscanning: a cautionary note
at any electrode pair by chance. In this way, the family-wise
Type-1 error can be controlled to 5%.
The maximum difference across all 784 electrode pairs was
estimated for 1000 randomizations of the data. The 95th per-
centile of this distribution was used as the upper cut-off for deter-
mining statistical significance and controlling the per-condition
comparison Type-1 error to 5%. The same process was used to
obtain a lower cut-off value.
RESULTS
SIMULATIONS
The results from the simulations showing the effects of varying
the concentration, κ, and the zero-lagged correlation, r,oneach
of the measures of connectivity are shown in Figure 5.Thefirst
criterion of good performance, that the measures should have low
bias and low RMSE can be addressed by examining the mean bias
and RMSE of each of the connectivity measures when r = 0and
for each value of κ (Figure 6). Note that for COH, PDC and PLV,
the bias equals the RMSE as all values are positive and greater than
0;onlyforCCorrandKMIdotheydiffer.COHdidnotmeetthe
criterion for any value of r and PDC and PLV
t
only came close
for low values of κ. KMI was close to the criteria for all values of
κ but, as the minimum value of KMI is zero, there was a small,
consistent bias. Only CCorr met the criteria fully.
The second and third criteria of good performance, that
the estimate of connectivity should increase monotonically as r
increases and that it should be insensitive to changes in the vari-
ance of the marginal distributions of deviations from the expected
phase (1/κ), can be considered together. Ta b le 1 shows the pro-
portion of variance in each measure of connectivity that can be
accounted for by r, κ, the interaction r by κ and error derived
from a Two-Way ANOVA of the simulation data. For all of the
measures, except PDC, r, accounted for a good proportion of
the variance but for COH and PLV, this proportion was small
compared to the proportion attributable to κ. The poor perfor-
mance of PDC is this context was unsurprising as it is designed to
identify Granger causality in which one time series leads the other,
not instantaneous associations as seen here. Never theless, the sen-
sitivity of PDC to κ meant that relatively high values of PDC were
obtained even where there was no real association between chan-
nels and it was the measure that showed the highest proportion
of error variance. The interaction, r by κ, was important only for
the PLV
t
where it accounted for 7.5% of the variance and was
manifest as a relatively greater influence of r, at low values of κ
(Figure 5C). The two measures that best met the criteria were
CCorr and KMI as they were both overwhelmingly influenced
by r but not κ and,ofthetwo,CCorrhadamuchsmallererror
variance.
The results from the simulations showing the effects of vary-
ing the concentration, κ, and the 100 ms-lagged correlation, r,
on each of the measures of connectivity are shown in Figure 7.
This simulation was designed to provide an example of Granger
Causality that would be well-suited for analysis by PDC. The first
point to note is that COH was largely unaffected by the change
(compare Figures 5A and 7A) and performed badly with both sets
of data. In contrast, the PLV, CCor r, and KMI were all adversely
affected which is unsurprising as these measures are not designed
for use in this context. In the case of PLV
t
and KMI, less than
1% of the variance was attributable to r. For PLV
t
most vari-
ance was accounted for by κ whereas for KMI it was error. The
poor performance of KMI with this data set occurred because it
was estimated from the phase-series down-sampled to 10 Hz, the
same rate at which the random phase deviations were added to
the phase sequence. This meant that the simultaneous estimates
of phase were truly independent. In contrast, because the PLV
t
and CCorr were estimated based on intermediate points that were
spline estimates of the preceding and subsequent phase devia-
tions, each datum contained some information about the lagged
FIGURE 5 | The relationship between the true and estimated coupling
for each measure of connectivity for the zero-lagged simulated data at
different levels of concentration, κ.(A)Shows coherence, (B,C) partial
directed coherence, (D) time-averaged phase-locking value, (E) circular
correlation coefficient and (F) Kraskov mutual information. Concentration
values are ¼, ½, 1, 2, 4, and 8.
Frontiers in Human Neuroscience www.frontiersin.org December 2013 | Volume 7 | Article 881
|
60
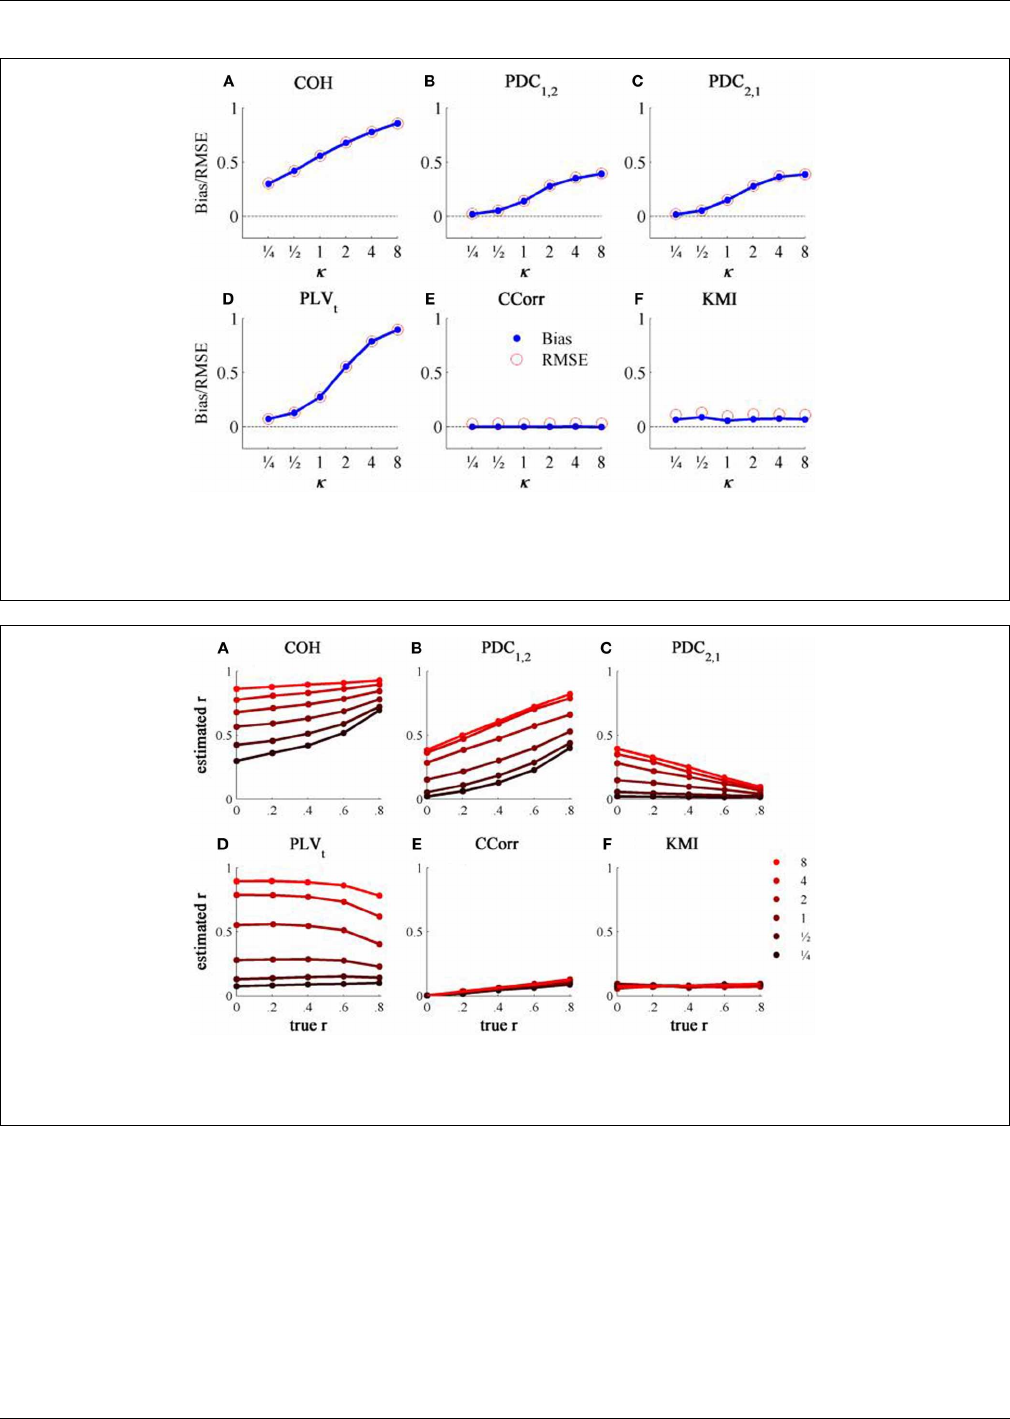
Burgess EEG hyperscanning: a cautionary note
FIGURE 6 | The bias and RMSE for each connectivity measure
estimated from the zero-lagged simulated data at different levels of
concentration, κ, when the coupling, r = 0. Blue dots i ndicate bias and
red circles RMSE. (A) Shows coherence, (B,C) partial directed coherence,
(D) time-averaged phase-locking value, (E) circular correlation coefficient
and (F) Kraskov mutual information. For COH, PDC and PLV, as all values
are >0, bias = RMSE are equal. For CCorr and KMI, where values may
be ≤ 0, bias = RMSE.
FIGURE 7 | The relationship between the true and estimated coupling
for each measure of connectivity for the 100ms-lagged simulated data at
different levels of concentration, κ .(A)Shows coherence, (B,C) partial
directed coherence, (D) time-averaged phase-locking value, (E) circular
correlation coefficient and (F) Kraskov mutual information. Concentration
values were ¼, ½, 1, 2, 4, and 8.
relationship between the phase series. This is the reason why
CCorr shows some sensitivity to increases in r, although much less
than for the zero-lagged data. Of course, each of these measures
would perform much better if they had been estimated a cross a
range of time lags.
As expected, PDC performed better on this simulation than
with the zero-lagged data. PDC
1, 2
showed a clear monotonic
increase with r correctly showing that channel 1 led channel 2.
Similarly, PDC
2, 1
showed a monotonic decrease with r, meaning
that the predictability of channel 1 given channel 2 diminished as
the predictability of channel 2 increased. However, in both cases,
the largest proportion of variance was attributable to κ,notr.
HUMAN STUDIES
Event-related changes in synchrony
The results of the hyperconnectivity analysis between pre-
stimulus and post-stimulus conditions, controlled for multiple
comparisons, are shown in Figure 8. As all the data were recorded
Frontiers in Human Neuroscience www.frontiersin.org December 2013 | Volume 7 | Article 881
|
61
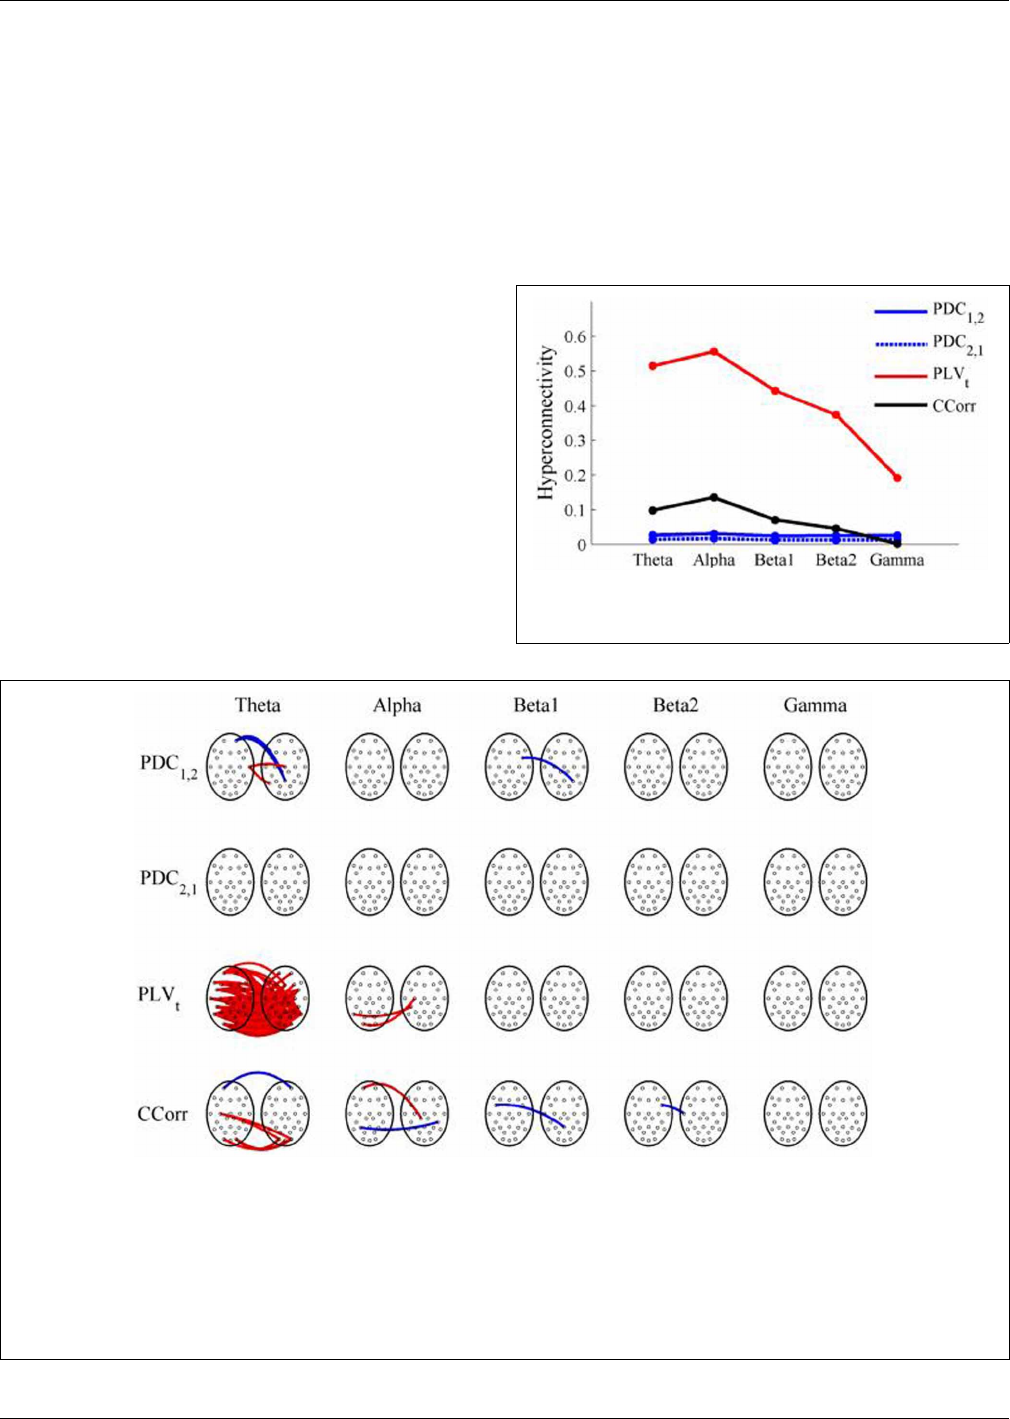
Burgess EEG hyperscanning: a cautionary note
independently, there can have been no true synchronization
between the recordings. Nevertheless, there were a small num-
ber of significant changes in synchronization between the pre-
and post-stimulus conditions identified by PDC and CCorr and a
very large number for the PLV
t
. For PDC and CCorr, the changes
in synchronizations involved both increases and decreases but
for PLV
t
, they were exclusively in the direction of increased
synchrony in the post-stimulus period. The estimates of mean
synchrony averaged across the pre- and post-stimulus periods
for each of the connectivity measures are shown in Figure 9.For
PDC, the estimated levels of synchrony were consistently very low
(range 0.01–0.03) and were also low for CCorr but m ore vari-
able (range 0.001–0.14). In contrast, the mean synchronization
was much higher for PLV with values ranging from 0.19 to 0.56.
As these data were from an event-related paradigm, it was also
possible to estimate the between-trial synchronization using PLV
n
and CCorr
n
. Figure 10 shows the significant differences in PLV
n
and CCorr
n
between the pre- and post-stimulus periods. There
were no significant differences in synchronization between condi-
tions using CCorr
n
but there were several using PLV
n
in the theta
and alpha frequency ranges. The estimates of mean synchrony
in the pre- and post-stimulus periods for PLV
n
and CCorr
n
are
shown in Figure 11. The PLV
n
and CCorr
n
were rather larger than
their time-averaged equivalents and were approximately equal
across the frequency bands (PLV
n
range 0.12–0.17; CCorr range
0.12–0.19).
Resting state
The results of the hyperconnectivity analysis between the eyes
open and eyes closed resting states, controlled for multiple com-
parisons, are shown in Figure 12. There were a number of
significant differences in hyperconnectivity between eyes open
and eyes closed using PDC. Most of these indicated that neu-
ral activity at multiple sites in pseudo-pair participant 1 was
a significantly stronger predictor of neural activity at electrode
FIGURE 9 | Mean Hyperconnectivity values for time-averaged
event-related EEG by connectivity measure and frequency band.
FIGURE 8 | Significant changes in mean time-averaged
hyperconnectivity between pre- and post-stimulus conditions by
connectivity measure and frequency band. The rows represent the
hyperconnectivity results for each of the measures used (PDC
1, 2
,PDC
2, 1
,
PLV
t
and CCorr) and the columns represent the frequency bands (theta,
alpha, beta1, beta2, and gamma). The pairs of large circles in each cell
represent the heads of the participants in a pseudo-pair. The smaller circles
indicate the topographical location of the EEG recording electrodes. For PLV
t
and CCorr, lines drawn between the heads joining electrode sites indicate
that there was a significant change in connectivity from the pre- to the
post-stimulus periods between the first member of a pseudo-pair and the
second member. Red lines indicate an increase in connectivity from the pre-
to the post-stimulus period and blue lines indicate a decrease. For PDC
1, 2
,
lines connecting electrode sites between the heads show that neural activity
in the first member of a pseudo pair was more predictive of the neural
activity of the second member of the pair in the post-stimulus period than in
the pre-stimulus period. Allocation to first or second member of the
pseudo-pair was arbitrary.
Frontiers in Human Neuroscience www.frontiersin.org December 2013 | Volume 7 | Article 881
|
62
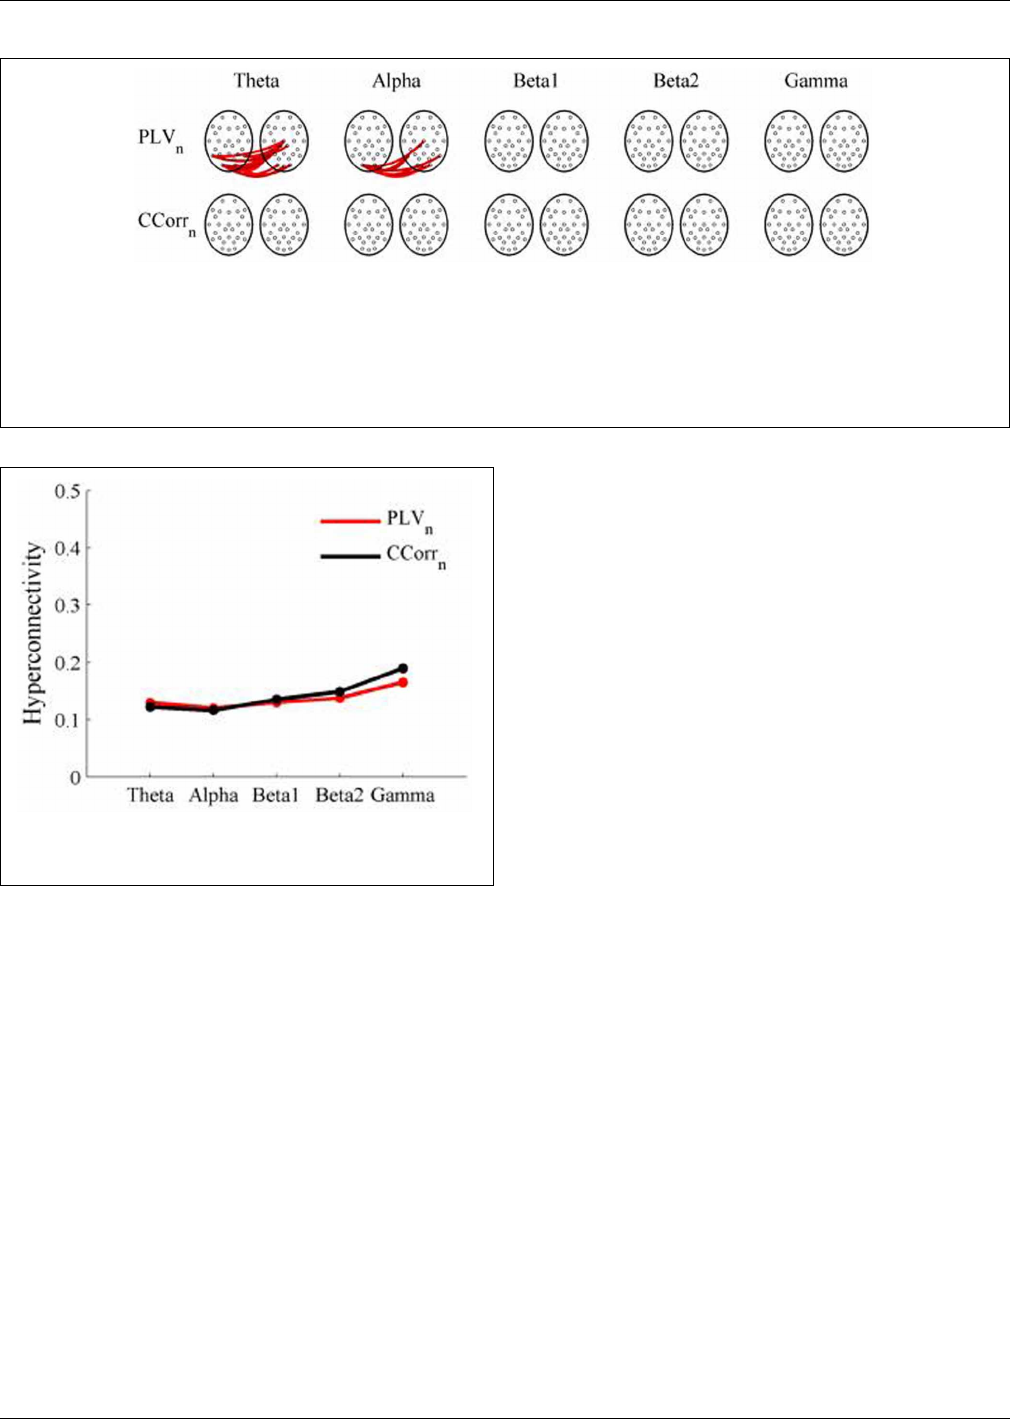
Burgess EEG hyperscanning: a cautionary note
FIGURE 10 | Significant changes in mean trial-averaged
hyperconnectivity between pre- and post-stimulus conditions by
connectivity measure and frequency band. The rows represent the
hyperconnectivity results for each of the measures used (PLV
n
and
CCorr
n
) and the columns represent the frequency bands (theta, alpha,
beta1, beta2, and gamma). The pairs of large circles in each cell
represent the heads of the participants in a pseudo-pair. The smaller
circles indicate the topographical location of the EEG recording
electrodes. Lines drawn bet ween the heads joining electrode sites
indicate that there was a significant change in connectivity from the
pre- to the post-stimulus periods between the first member of a
pseudo-pair and the second member. Red lines indicate an increase in
connectivity from the pre- to the post-stimulus period and blue lines
indicate a decrease.
FIGURE 11 | Mean Hyperconnectivity values for trial-averaged
event-related EEG by connectivity measure and frequency band.
site FP1 in participant 2 when the eyes were closed than when
they were open. There were also two links indicating/that neu-
ral activity participant 2 drove neural activity in participant 1.
There were also a small number of hyper-connections identi-
fied by CCorr, one showing significantly lower synchronization
between the participants in the eyes closed condition in theta fre-
quency range and four showing the reverse in the alpha frequency
range. However, by far the largest numbers of significant changes
in synchrony were identified by PLV
t
. In the theta frequency
range, there were multiple hyper-connections that were signifi-
cantly higher in the eyes open condition than in the eyes closed
condition. In the alpha frequency range, there was an even larger
number of hyper-connections that were greater in the eyes closed
condition. The estimates of mean synchrony in the eyes open
and eyes closed conditions for each of the connectivity measures
are shown in Figure 13 As was the case with the event-related
data, mean connectivity was low for PDC (range 0.01–0.11) and
CCorr (0.001–0.06) but was very much greater for PLV
t
(range
0.13–0.40).
DISCUSSION
The issue of how best to measure hyperconnectivity depends in
no small part on what one is trying to measure. Many hypercon-
nectivity researchers intended to measure synchronization which,
in the Huygens sense means that two oscillators (in this case,
the EEG of two people) interact in such a way that their cycles
become synchronous. However, synchronization, as defined by
the PLV, is rather different and simply means there is a consistent
phase difference between the two signals but does not necessar-
ily imply covariance between them. By this criterion, any pair of
EEG channels with a common dominant frequency would be syn-
chronized, which surely makes this definition too inclusive to be
useful. Instead, a more useful definition is that two oscillators can
be said to be synchronized if deviations from the regular oscilla-
tory cycle of one oscillator provides information about deviations
in the oscillatory cycle of the other.
By this definition, none of the commonly used measures of
connectivity fared well in the simulations. COH, PDC, and PLV
were biased measures of the co-variation between phase series
and, under a broad range of conditions provided inaccurate esti-
mates of the true hyperconnectivity. In particular, the y were each
prone to detect hyperconnectivity that didn’t exist. It is well
known that COH is a biased estimator of true coherence (Maris
et al., 2007) but using Welch’s method limits the extent of the
problem. PLV too, is a biased estimator of coupling strength and
the bias is greater when small samples of data are used, particu-
larly, as is the case with PLV
t
, when non-independent data points
areused(Vinck et al., 2012). To put the scale of the problem
in context, consider those simulations where the concentration
was close to the mean value seen in the human EEG recordings
and the true hyperconnectivity was zero (κ = 2, r = 0). Here the
estimated coupling strengths were 0.65, 0.19, and 0.58 for COH,
PDC, and PLV respectively.
These spur ious couplings are not solely due to the familiar
bias of the estimators. Rather, the coupling was driven by changes
in the variances of the indiv idual phase series (i.e., 1/κ of the
marginal distributions of deviations from the expected phase).
As Ta b le 1 shows, COH, PDC, and PLV
t
were more sensitive to
changes in the variance of the marginal distributions of deviations
Frontiers in Human Neuroscience www.frontiersin.org December 2013 | Volume 7 | Article 881
|
63
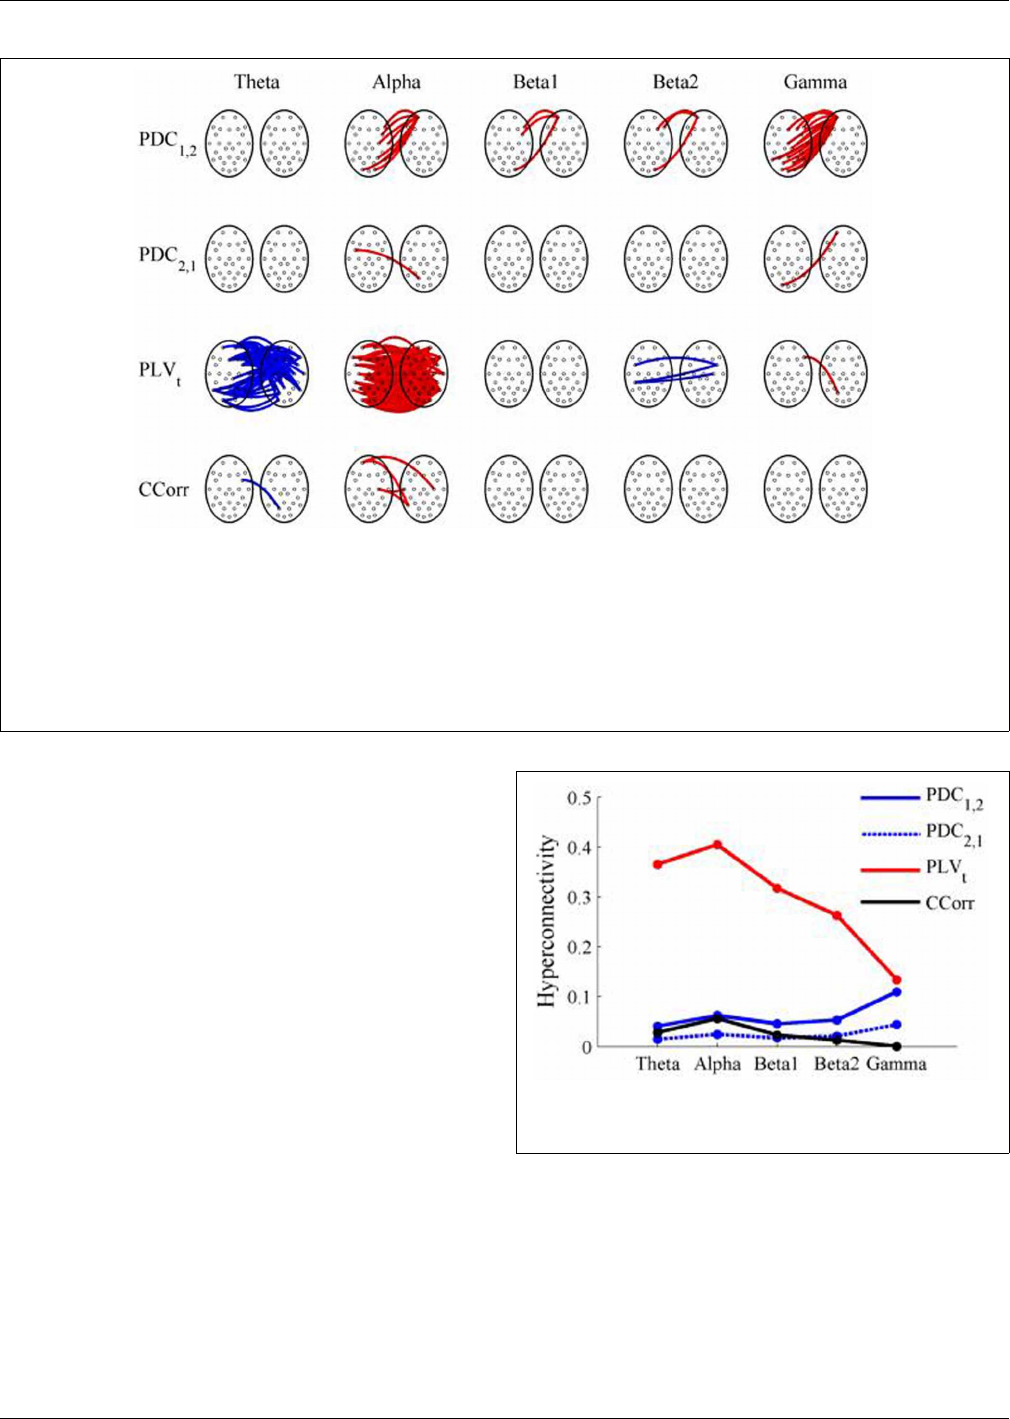
Burgess EEG hyperscanning: a cautionary note
FIGURE 12 | Significant changes in mean time-averaged
hyperconnectivity between eyes open and eyes closed resting states by
connectivity measure and frequency band. The rows represent the
hyperconnectivity results for each of the measures used (PDC
1, 2
,PDC
2, 1
,
PLV
t
, and CCorr) and the columns represent the frequency bands (theta,
alpha, beta1, beta2, and gamma). The pairs of large circles in each cell
represent the heads of the participants in a pseudo-pair. The smaller circles
indicate the topographical location of the EEG recording electrodes. For PLV
t
and CCorr, lines drawn between the heads joining electrode sites indicate
that there was a significant change in connectivity from the pre- to the
post-stimulus periods between the first member of a pseudo-pair and the
second member. Red lines indicate an increase in connectivity from the pre-
to the post-stimulus period and blue lines indicate a decrease. For PDC
1, 2
,
lines connecting electrode sites between the heads show that neural activity
in the first member of a pseudo pair was more predictive of the neural
activity of the second member of the pair in the post-stimulus period than in
the pre-stimulus period. Allocation to first or second member of the
pseudo-pair was arbitrary.
from the expected phase than to changes in the covariance of
the phases (Tabl e 1 ). The result is that any change in the vari-
ance of the marginal distributions of deviations from the expected
phase will be identified as a change in hyperconnectivity whether
or not there is any real change in the covariance of the signals.
Indeed, using PLV to measure hyperconnectivity is akin to trying
to determine the correlation between two continuous variables
by measuring the variance of the difference between them; the
difference is related to co-variance (see Equation 5), but only
indirectly so.
Instead, it may be more appropriate to use a measure that esti-
mates the co-variation of the distributions directly. Both COH
and PDC measure the co-variation between the signals (to be
precise, the cross-power spectral density) and so should be suit-
able for this purpose. However, both methods assume that the
covariance between signals is stationary throughout an epoch,
which in our simulations, it was not. The rapidly changing phase
shifts in our simulations are the most likely reason for the poor
performance of COH and PDC here. CCorr also estimates the
co-variation of the distributions directly but does not assume a
constant phase relationship across each epoch and we were able to
show in the simulations that it provides an unbiased estimate of
hyperconnectivity with a very low RMSE. In addition, we showed
that a more general measure of hyperconnectivity, which esti-
mates mutual information rather than phase-covariance, KMI,
also performs well, although there was a small positive bias
FIGURE 13 | Mean Hyperconnectivity values for time-averaged resting
state EEG by connectivity measure and frequency band.
in the estimates and the computational demands were much
greater.
The persuasiveness of simulations depends in no small mea-
sure on how realistic one perceives them to be, so it is often
helpful to supplement them with evidence from real data. By
creating pseudo-pairs of participants from EEG data recorded
in completely independent sessions, and analyzing them as if
their data had been collected during a hyperscanning study, we
Frontiers in Human Neuroscience www.frontiersin.org December 2013 | Volume 7 | Article 881
|
64

Burgess EEG hyperscanning: a cautionary note
Table 1 | Showing the proportion of variance accounted in each
connectivity measure by correlation and concentration.
Connectivity
measure
Zero-lagged data 100 ms-lagged data
source of variance (%) source of variance (%)
R κ r by κ Error R κ r by κ Error
COH 18.277.32.52.016.778.42.82.1
PDC
1, 2
1.285.81.012.039.556.90.92.7
PDC
2, 1
0.486.40.912.322.155.316.16.6
PLV
t
15.676.27.90.30.897.81.10.2
CCorr 99.00.30.20.662.72.11.433.8
KMI 95.60.00.04.40.00.10.099.9
could be confident that any hyper-connections observed would be
spurious. We considered two conditions. The first was an event-
related paradigm that might be expected to generate spurious
hyper-connections because the participants were subject to sim-
ilar sensory experiences and this comparison was designed to
emulate the case of induced synchrony (Figure 1B). The second
was a comparison of two resting states (eyes open and eyes closed)
in which there was no exogenous stimulation and this compari-
son was designed to emulate the case of co-incidental synchrony
(Figure 1D).
In both the event-related and resting-state paradigms, PDC
and CCorr each identified a small number of spurious hyper-
connections that differed between conditions. Most of these
connections were weak (<0.1) and some showed an increase
in hyperconnectivity whilst others showed a decrease and they
can easily be dismissed as Type-1 errors. The only exception
to this was the anomalous finding of multiple spurious hyper-
connections using PDC
1, 2
focusedonasingleelectrode(FP1).
A very different pattern was seen in the case of PLV
t
,however.
In the event-related data, nearly 20% of all possible connections
in the theta frequency band (n = 145) were erroneously found to
be significantly higher in the post-stimulus period. In addition,
the strength of connectivity was strong with a mean PLV
t
of 0.51.
There were also multiple spurious hyper-connections found using
the trial-averaged PLV
n
with 14 (1.8%) and 10 (1.3%) found in
the theta and alpha frequency bands although the strength of the
connections was weak, 0.13 and 0.12 respectively. In the resting
state comparisons, PLV
t
showed a decrease in hyper-connectivity
from the eyes open to the eyes closed conditions in 54 cases (7%)
whilst in alpha, there was a corresponding increase in 170 (22%)
hyper-connections and again, the strengths of the connections
were moderately strong with a mean value of 0.37 in theta and
0.41 in alpha.
This strong and systematic pattern of findings using PLV
in these very different paradigms is troubling because, in the
absence our knowledge that these hyper-connections must be
spurious, they might easily have been accepted as real. Such
a large number of hyper-connections cannot easily be dis-
missed as Type-1 errors. The problem of multiple comparisons
is well-understood by hyperconnectivity researchers and most
recent studies have included appropriate statistical mechanisms
to control the family-w ise Type-1 errors that would otherwise
ensure. In this case, a robust and well-established method for con-
trolling the family-wise Type-1 error control had been used but
the real problem is that spurious connections were found despite
these precautions. The clear implication is that statistical con-
trol of Type-1 errors is not sufficient to guard against detecting
spurious connections.
Far from being a statistical artifact, it is likely that the large
numbers of spurious hyper-connections identified by PLV
t
arose
from real similarities between the EEG recorded from different
participants. In general, any systematic difference between the
experimental conditions that affects the variance of the phase dif-
ference of the EEG recorded, will affect the PLV. This might occur
in a number of ways but would include, for example, a systematic
difference in rhythmicity between conditions. Any strong oscil-
latory component in the EEG means that the phase at any time
point is much more predictable (i.e., the phase variance is lower).
If the phase var iance in one or both EEG channels is reduced,
the variance of the phase difference will also be reduced and this
means that PLV
t
will be higher.
For this to happen, it is necessary that the change in rhyth-
micity is one that reliably occurs in most individuals but this
is not difficult to achieve. The remarkably consistent, yet reli-
ably predictable responses of the EEG to challenges attest to
this (e.g., event-related potentials and event-related desynchro-
nization). Given the same stimulation and cognitive and motor
demands, any arbitrarily chosen group of neurotypical partic-
ipants will produce event-related changes in their EEG that
look very much like those produced by any other neurotypical
group. Change the stimuli or the demands, and the topog-
raphy and time-frequency characteristics of the responses will
change in predictable ways. In short, different people pre-
sented with the same conditions will produce similar EEG
responses.
Most of our spurious hyper-connections can be explained
through this mechanism. Consider the resting state comparisons.
The difference between the eyes open and eyes closed resting
states is typically characterized in terms of the Berger effect in
which opening the eyes severely attenuates the alpha rhythm. That
is, the rhythmicity in alpha is greater when the eyes are closed than
when they are open. We should expect, therefore, that in the alpha
frequency band, PLV
t
would be higher when the eyes were closed
and this is what we observed. In addition, there is a stronger theta
rhythm in the eyes open condition than in the eyes closed condi-
tion so we should expect to find higher PLV
t
with eyes open, and
this too was seen (Figure 12).
The same phenomenon can account for the spurious hyper-
connections seen with the event-related data. The presentation
of a visual stimulus, like a face, will induce a power increase in
the theta frequency range in the post stimulus period (i.e., theta
synchronization) (Burgess and Gruzelier, 1997). The presence
of a stronger oscillatory component in the post-stimulus period
meant that phase variance was lower than in the pre-stimulus
period giving higher PLV
t
values ( Figure 8). One might also have
expected a reduction in PLV
t
in alpha because the presentation of
a visual stimulus is invariably followed by a power reduction in
that frequency range (alpha desynchronization) but this was not
seen in this case.
Frontiers in Human Neuroscience www.frontiersin.org December 2013 | Volume 7 | Article 881
|
65

Burgess EEG hyperscanning: a cautionary note
A similar mechanism can account for the spurious synchro-
nizations detected by the t rial-averaged PLV
n
. The presentation of
a visual stimulus induces a phase-re-organization of the ongoing
EEG (Burgess, 2012). In the pre-stimulus period, a cross-section
across trials at any given time point, would show that the phases
were randomly distributed. In the post-stimulus period, although
the EEG is not strictly phase-locked, the phase-variance is much
reduced and this reduction of phase-variance within each chan-
nel means that the phase difference between channels will also
be reduced. The result is the increase in PLV
n
that we observed
(Figure 10).
The important point to note is that the statistically signifi-
cant but spurious differences in PLV observed derived not from
any connection between the participants involved but from the
fact that our experimental conditions were associated with sys-
tematic differences in the rhythmicity of the EEG. This has two
important implications for the field of hyperscanning. First, it
means that spurious hyper-connections are likely to be found
under a broad range of exper imental conditions as any systematic
difference between conditions in terms of movement, stimulus
presentation or mentation could have this effect. Second, these
spurious connections are not Type-1 errors that can be overcome
using a statistical control for multiple comparisons.
Therearetwoobviouswaystotacklethisproblem:improved
experimental control and the use of a different measure of phase
synchronization. There is certainly no substitute for good exper-
imental design and if the conditions to be compared can be
matched in terms of stimulus presentation and movement, and if
appropriate control conditions are used, then much of this prob-
lem would be resolved. Indeed, this is already the case with the
better designed studies in the field. However, although it might be
possible to obtain this level of experimental control in restricted
social situations, one of the key attr actions of hyperscanning is
that it has the potential to open a window on the neural co-
ordination of people socially interacting in the real world. Not for
the first time, strict experimental control and ecological validity
stand in opposition to one another.
The other approach to tackle this problem is to adopt an alter-
native measure of phase synchronization. Any measure that is
sensitive to changes in the marginal distributions of deviations
from the expected phase is also likely to be sensitive to changes in
the rhythmicity of the EEG. Although PLV was the most problem-
atic measure in this context, at least in terms of detecting spurious
hyper-connections in human EEG, the simulations showed that
PDC and COH were also vulnerable in this respect, at least under
certain circumstances. The real problem is that, although the PLV
is widely used as a measure of phase synchronization, a high value
of PLV does not necessarily mean there is any true phase syn-
chronization at all. If we wish to claim that two time series, or,
in this case, two phase ser ies, are related to each other, we need to
show that deviations from the dominant frequency in one oscil-
lator co-vary with deviations in the other. Had the pendulums
on Huygens’s clocks simply shown a consistent phase relationship
to each other, he would never have discovered the phenomenon
of phase synchronization. What surprised him was not that the
pendulums remained in the same fixed phase relationship to each
other where they’d started, but that they progressively shifted
phase until their swings became aligned. As Pikovsky et al. (2001)
put it, “This adjustment of rhythms due to interaction is the essence
of synchronization.”
This emphasis on synchronization has been unfortunate
because what most EEG hyperscanning researchers w ish to show
is that cortical oscillations from different people are systemati-
cally related to each other in a way that depends upon their social
interactions. This means that we need to show that there is covari-
ance (or more generally, mutual information) between the EEG
of the people concerned. Synchronization is one way of doing this
but, as this study has shown, there may be advantages from using
a measure of correlation instead. Fortunately, we have at least
two candidate measures that might serve: CCorr and KMI. CCorr
is insensitive to changes in the marginal distributions of devia-
tions from the expected phase and, hence, resistant to changes in
the rhythmicity of the EEG because it measures the co-variation
between phase series. Adopting this measure, or some suitable
alternative such as KMI, may not solve the problem completely,
but it may go a long way to reducing the risk of detecting spurious
hyper-connections in future.
To conclude, existing measures of hyper-connectivity are
biasedandpronetodetectcouplingwherenoneexists.Inpartic-
ular, spurious hyper-connections are likely to be found whenever
any difference between experimental conditions induces system-
atic changes in the rhythmicity of the EEG. These spurious
hyper-connections are not Type-1 errors and cannot be con-
trolled statistically. Measures of the co-variance or mutual infor-
mation between phases-series provide more robust evidence of
true hyperconnectivity and are to be preferred in this context.
AUTHOR CONTRIBUTIONS
Adrian P. Burgess designed the study, superv ised the data collec-
tion, performed all the analysis and simulations and wrote the
paper and sang the theme tune.
ACKNOWLEDGMENTS
The author wishes to thank Kiran Hans and Betty Wong who col-
lected the EEG data and to Dr. Mario Kittenis who performed
some of the EEG data preparation.
REFERENCES
Astolfi, L., Cincotti, F., Mattia, D., De Vico Fallani, F., Salinari, S., Marciani, M. G.,
et al. (2009). Estimation of the cortical activity from simultaneous multi-subject
recordings during the prisoner’s dilemma. Conf. Proc. IEEE Eng. Med. Biol. Soc.
2009, 1937–1939. doi: 10.1109/IEMBS.2009.5333456
Astolfi, L., Cincotti, F., Mattia, D., De Vico Fallani, F., Salinari, S., Vecchiato, G.,
et al. (2010a). Simultaneous estimation of cortical activity during social interac-
tions by using EEG hyperscannings. Conf. Proc. IEEE Eng. Med. Biol. Soc. 2010,
2814–2817. doi: 10.1109/IEMBS.2010.5626555
Astolfi, L., Cincotti, F., Mattia, D., Fallani, F. D. V., Salinari, S., Vecchiato, G.,
et al. (2010b). Imag ing the social brain: multi-subjects EEG recordings dur-
ing the “Chicken’s game.” Conf. Proc. IEEE Eng. Med. Biol. Soc. 1734–1737. doi:
10.1109/IEMBS.2010.5626708
Astolfi, L., Toppi, J., De Vico Fallani, F., Vecchiato, G., Salinari, S., Mattia, D.,
et al. (2010c). Neuroelectrical hyperscanning measures simultaneous brain
activity in humans. Brain Topogr. 23, 243–256. doi: 10.1007/s10548-010-
0147-9
Astolfi, L., Toppi, J., Borghini, G., Vecchiato, G., He, E. J., Roy, A., et al. (2012).
Cortical activity and functional hyperconnectivity by simultaneous EEG record-
ings from interacting couples of professional pilots. Conf. Proc. IEEE Eng. Med.
Biol. Soc. 2012, 4752–4755. doi: 10.1109/EMBC.2012.6347029
Frontiers in Human Neuroscience www.frontiersin.org December 2013 | Volume 7 | Article 881
|
66

Burgess EEG hyperscanning: a cautionary note
Astolfi, L., Toppi, J., Borghini, G., Vecchiato, G., Isabella, R., De Vico Fallani, F., et al.
(2011a). Study of the functional hyperconnectivity between couples of pilots
during flight simulation: an EEG hyperscanning study. Conf. Proc. IEEE Eng.
Med. Biol. Soc. 2011, 2338–2341. doi: 10.1109/IEMBS.2011.6090654
Astolfi, L., Toppi, J., De Vico Fallani, F., Vecchiato, G., Cincotti, F., Wilke, C. T.,
et al. (2011b). Imaging the social brain by simultaneous hyperscanning during
subject interaction. IEEE Intell. Syst. 26, 38–45. doi: 10.1109/MIS.2011.61
Babiloni, C., Buffo, P., Vecchio, F., Marzano, N., Del Percio, C., Spada, D., et al.
(2012). Brains “in concert”: frontal oscillatory alpha rhythms and empathy in
professional musicians. Neuroimage 60, 105–116. doi: 10.1016/j.neuroimage.
2011.12.008
Babiloni, C., Vecchio, F., Infarinato, F., Buffo, P., Marzano, N., Spada, D., et al.
(2011). Simultaneous recording of electroencephalographic data in musicians
playing in ensemble. Cortex 47, 1082–1090. doi: 10.1016/j.cortex.2011.05.006
Babiloni, F., and Astolfi, L. (2012). Social neuroscience and hyperscan-
ning techniques: past, present and future. Neurosci. Biobehav. Rev.doi:
10.1016/j.neubiorev.2012.07.006. [Epub ahead of print].
Babiloni, F., Astolfi, L., Cincotti, F., Mattia, D., Tocci, A., Tarantino, A., et al.
(2007a). Cortical activity and connectivity of human brain during the prisoner’s
dilemma: an EEG hyperscanning study. Conf. Proc. IEEE Eng. Med. Biol. Soc.
2007, 4953–4956. doi: 10.1109/IEMBS.2007.4353452
Babiloni, F., Cincotti, F., Mattia, D., De Vico Fallani, F., Tocci, A., Bianchi, L., et al.
(2007b). High resolution EEG hyperscanning during a card game. Conf. Proc.
IEEE Eng. Med. Biol. Soc. 2007, 4957–4960. doi: 10.1109/IEMBS.2007.4353453
Babiloni, F., Cincotti, F., Mattia, D., Mattiocco, M., De Vico Fallani, F., Tocci, A.,
et al. (2006). Hypermethods for EEG hy perscanning. Conf. Proc. IEEE Eng. Med.
Biol. Soc. 1, 3666–3669. doi: 10.1109/IEMBS.2006.260754
Baccala, L. A., and Sameshima, K. (2001). Partial directed coherence: a new con-
cept in neural structure determination. Biol. Cyber n. 84, 463–474. doi: 10.1007/
PL00007990
Baess, P., Zhdanov, A., Mandel, A., Parkkonen, L., Hirvenkari, L., Makela,
J. P., et al. (2012). MEG dual scanning: a procedure to study real-time
auditory interaction between two persons. Front. Hum. Neurosci. 6:83. doi:
10.3389/fnhum.2012.00083
Beirlant, J., Dudewicz, E. J., Gyorfi, L., and van der Meulen, J. C. (1997).
Nonparametric entropy estimation: an over view. Int. J. Math. Stat. Sci. 6, 17–39.
Berens, P. (2009). CircStat: a MATLAB TOOLBOX for circular statistics. J. Stat.
Softw. 31, 1–21. Avilable online at: http://www.jstatsoft.org/v31/i10
Burgess, A. P. (2012). Towards a unified understanding of event-related changes in
the EEG: the firefly model of synchronization through cross-frequency phase
modulation. PLoS ONE 7:e45630. doi: 10.1371/journal.pone.0045630
Burgess, A. P., and Gruzelier, J. H. (1997). Localization of word and face recog-
nition memory using topographical EEG. Psychophysiology 34, 7–16. doi:
10.1111/j.1469-8986.1997.tb02410.x
Chung, D., Yun, K., and Jeong, J. (2008). “Neural substrates of free-riding
and cooperation during the standard public goods game,” in International
Conference of Cognitive Science, (Seoul).
Dodel, S., Cohn, J., Mersmann, J., Luu, P., Forsythe, C., and Jirsa, V. (2011). “Brain
signatures of team performance,” in Foundations of Augmented Cognition:
Directing the Future of Adaptive Systems, Vol. 6780, eds D. D. Schmorrow and
C. M. Fidopiastis (Orlando, FL: Springer), 288–297. doi: 10.1007/978-3-642-
21852-1_35
Dumas, G. (2011). Towards a two-body neuroscience. Commun. Integr. Biol. 4,
349–352. doi: 10.4161/cib.4.3.15110
Dumas, G., Chavez, M., Nadel, J., and Martinerie, J. (2012a). Anatomical con-
nectivity influences both intra- and inter-brain synchronizations. PLoS ONE
7:e36414. doi: 10.1371/journal.pone.0036414
Dumas, G., Martinerie, J., Soussignan, R., and Nadel, J. (2012b). Does the brain
know who is at the origin of what in an imitative interaction? Front. Hum.
Neurosci. 6:128. doi: 10.3389/fnhum.2012.00128
Dumas, G., Lachat, F., Martinerie, J., Nadel, J., and George, N. (2011). From social
behaviour to brain synchronization: review and p erspectives in hyperscanning.
IRBM 32, 48–53. doi: 10.1016/j.irbm.2011.01.002
Dumas, G., Nadel, J., Soussignan, R., Martinerie, J., and Garnero, L. (2010).
Inter-brain synchronization during social interaction. PLoS ONE 5:e12166. doi:
10.1371/jour
nal.pone.0012166.
F
aes, L., and Nollo, G. (2011). “Multivariate frequency domain analysis of causal
interactions in physiological time series,” in Biomedical Engineering, Trends in
Electronics, Communications and Software, ed A. N. Laskovski (Rijeka: InTech),
403–428.
Fallani, F. D., Nicosia, V., Sinatra, R., Astolfi, L., Cincotti, F., Mattia, D., et al.
(2010). Defecting or not defecting: how to “read” human behavior during coop-
erative games by EEG measurements. PLoS ONE 5:e14187. doi: 10.1371/jour-
nal.pone.0014187
Flexer, A., and Makeig, S. (2007). Independent component analysis of EEG
recorded during two-person game playing. Appl. Artif. Intell. 21, 883–894. doi:
10.1080/08839510701527127
Friston, K. J. (2011). Functional and effective connectivit y: a review. Brain Connect.
1, 13–36. doi: 10.1089/brain.2011.0008
Funane, T., Kiguchi, M., Atsumori, H., Sato, H., Kubota, K., and Koizumi, H.
(2011). Synchronous activity of two people’s prefrontal cortices during a coop-
erative task measured by simultaneous near-infrared spectroscopy. J. Biomed.
Opt. 16, 077011. doi: 10.1117/1.3602853
Gentle, J. E. (1998). Random Number Generation and Monte Carlo Methods.New
York, NY: Springer. doi: 10.1007/978-1-4757-2960-3
Hasson, U., Furman, O., Clark, D., Dudai, Y., and Davachi, L. (2008). Enhanced
intersubject correlations during movie viewing correlate with successful
episodic encoding. Neuron 57, 452–462. doi: 10.1016/j.neuron.2007.12.009
Hnizdo, V., Tan, J., Killian, B. J., and Gilson, M. K. (2008). Efficient calculation of
configurational entropy from molecular simulations by combining the mutual-
information expansion and nearest-neighbor methods. J. Comput. Chem. 29,
1605–1614. doi: 10.1002/jcc.20919
Holmes, A. P., Blair, R. C., Watson, J. D., and Ford, I. (1996). Nonparametric anal-
ysis of statistic images from functional mapping experiments. J. Cereb. Blood
Flow Metab. 16, 7–22. doi: 10.1097/00004647-199601000-00002
Jammalamadaka, S. R., and Sengupta, A. (2001). Topics in Circular Stat istics. River
Edge,NJ:WorldScientific.
Kawasaki, M., Yamada, Y., Ushiku, Y., Miyauchi, E., and Yamaguchi, Y. (2013).
Inter-brain synchronization during coordination of speech rhythm in human-
to-human social interaction. Sci. Rep. 3:1692. doi: 10.1038/srep01692
Klarreich, E. (2002). Huygens’s clocks revisited. Am. Sci. 90, 322–323. Available
online at: http://www.americanscientist.org/issues/pub/huygenss-clocks-
revisited
Konvalinka, I., and Roepstorff, A. (2012). The two-brain approach: how can mutu-
ally interacting brains teach us something about social interaction? Front. Hum.
Neurosci. 6:215. doi: 10.3389/fnhum.2012.00215
Kozachenko, L. F., and Leonenko, N. N. (1987). Sample estimate of entropy of a
random vector. Probl. Inf. Trans. 23, 95–101.
Kraskov, A., Stogbauer, H., and Grassberger, P. (2004). Estimating mutual informa-
tion. Phys. Rev. E Stat. Nonlin. Soft Matter Phys. 69, 066138. doi: 10.1103/Phys
RevE.69.066138
Lachat, F., Hugueville, L., Lemarechal, J. D., Conty, L., and George, N. (2012).
Oscillatory brain cor relates of live joint attention: a dual-EEG study. Front.
Hum. Neurosci. 6:156. doi: 10.3389/fnhum.2012.00156
Lachaux, J. P., Rodriguez, E., Martinerie, J., and Varela, F. J. (1999). Measuring phase
synchrony in brain signals. Hum. Brain Mapp. 8, 194–208.
Lindenberger, U., Li, S. C., Gruber, W., and Muller, V. (2009). Brains swinging
in concert: cortical phase synchronization while playing guitar. BMC Neurosci.
10:22. doi: 10.1186/1471-2202-10-22
Maris, E., Schoffelen, J. M., and Fries, P. (2007). Nonparametric statistical testing
of coherence differences. J. Neurosci. Methods 163, 161–175. doi: 10.1016/j.jneu
meth.2007.02.011
Montague, P. R., Berns, G. S., Cohen, J. D., McClure, S. M., Pagnoni, G., Dhamala,
M., et al. (2002). Hyperscanning: simultaneous fMRI during linked social
interactions. Neuroimage 16, 1159–1164. doi: 10.1006/nimg.2002.1150
Naeem, M., Prasad, G., Watson, D. R., and Kelso, J. A. (2012a). Electrophysiological
signatures of intentional social coordination in the 10–12 Hz range. Neuroimage
59, 1795–1803. doi: 10.1016/j.neuroimage.2011.08.010
Naeem, M., Prasad, G., Watson, D. R., and Kelso, J. A. (2012b). Functional dis-
sociation
o
f brain rhythms in social coordination. Clin. Neurophysiol. 123,
1789–1797. doi: 10.1016/j.clinph.2012.02.065
Pikovsky, A., Rosenblum, M., and Kurths, J. (2001). Synchronization: A Universal
Concept in Nonlinear Sciences. Cambridge: Cambridge University Press. doi:
10.1017/CBO9780511755743
Sanger, J., Lindenberger, U., and Muller, V. (2011). Interactive brains, social minds.
Commun. Integr. Biol. 4, 655–663. doi: 10.4161/cib.4.6.17934
Frontiers in Human Neuroscience www.frontiersin.org December 2013 | Volume 7 | Article 881
|
67

Burgess EEG hyperscanning: a cautionary note
Sanger, J., Muller, V., and Lindenberger, U. (2012). Intra- and interbrain synchro-
nization and network properties when playing guitar in duets. Front. Hum.
Neurosci. 6:312. doi: 10.3389/fnhum.2012.00312
Sanger, J., Muller, V., and Lindenberger, U. (2013). Directionality in hyperbrain net-
works discriminates between leaders and followers in guitar duets. Front. Hum.
Neurosci. 7:234. doi: 10.3389/fnhum.2013.00234
Singh, H., Hnizdo, V., and Demchuk, E. (2002). Probabilistic model for two
dependent circular variables. Biometrika 89, 719–723. doi: 10.1093/biomet/89.
3.719
Tass, P., Rosenblum, M. G., Weule, J., Kurths, J., Pikovsky, A., Volkmann, J., et al.
(1998). Detection of n: m phase locking from noisy data: application to mag-
netoencephalography. Phys. Rev. Lett. 81, 3291–3294. doi: 10.1103/PhysRevLett.
81.3291
Tognoli, E. (2008). “EEG coordination dynamics: neuromarkers of social coordi-
nation,” in Coordination: Neural, Behavioral and Social Dynamics, eds A. Fuchs
and V. K. Jirsa (Boca Raton, FL: Springer), 309–323. doi: 10.1007/978-3-540-
74479-5_15
Tognoli, E., Kovacs, A. J., Suutari, B., Afergan, D., Coyne, J., Gibson, G.,
et al. (2011a). “Behavioral and brain dynamics of team coordination
part I: task design,” in Foundations of Augmented Cognition: Directing
the Future of Adaptive Systems, Vol. 6780, eds D. D. Schmorrow and C.
M. Fidopiastis (Orlando, FL: Springer), 257–264. doi: 10.1007/978-3-642-
21852-1_32
Tognoli, E., Kovacs, A. J., Suutari, B., Afergan, D., Coyne, J., Gibson, G., et al.
(2011b). “Behavioral and brain dynamics of team coordination part II: neu-
robehavioral performance,” in Foundations of Augmented Cognition: Directing
the Future of Adaptive Systems, Vol. 6780, eds D. D. Schmorrow and C.
M. Fidopiastis (Orlando, FL: Springer), 376–382. doi: 10.1007/978-3-642-
21852-1_44
Tognoli, E., Lagarde, J., Deguzman, G. C., and Kelso, J. A. (2007). The phi complex
as a neuromarker of human social coordination. Proc. Natl. Acad. Sci. U.S.A.
104, 8190–8195. doi: 10.1073/pnas.0611453104
Vinck, M., Battaglia, F. P., Womelsdorf, T., and Pennartz, C. (2012). Improved mea-
sures of phase-coupling between spikes and the local field potential. J. Comput.
Neurosci. 33, 53–75. doi: 10.1007/s10827-011-0374-4
Yun, K., Chung, D., and Jeong, J. (2008). “Emotional interactions in human deci-
sion making using EEG hyperscanning,” in International Conference of Cognitive
Science. (Seoul).
Yun, K., Watanabe, K., and Shimojo, S. (2012). Interpersonal body and neural
synchronization as a marker of implicit social interaction. Sc i. Rep. 2, 959. doi:
10.1038/srep00959
Conflict of Interest Statement: The author declares that the research was con-
ducted in the absence of any commercial or financial relationships that could be
construed as a potential conflict of interest.
Received: 19 Septe mber 2013; paper pending published: 13 October 2013; accepted: 03
December 2013; published online: 24 December 2013.
Citation: Burgess AP (2013) On the interpretation of synchronization in EEG hyper-
scanning studies: a cautionary note. Front. Hum. Neurosci. 7:881. doi: 10.3389/fnhum.
2013.00881
This article was submitted to the journal Frontiers in Human Neuroscience.
Copyright © 2013 Burgess. This is an open-access article distributed under the terms
of the Creative Commons Attribution License (CC BY). The use, distribution or repro-
duction in other forums is permitted, provided the original author(s) or licensor are
credited and that the original publication in this journal is cited, in accordance with
accepted academic practice. No use, distribution or reproduction is per mitted which
does not comply with these terms.
Frontiers in Human Neuroscience www.frontiersin.org December 2013 | Volume 7 | Article 881
|
68

Burgess EEG hyperscanning: a cautionary note
APPENDIX: THE 2 DIMENSIONAL VON MOSES
DISTRIBUTION
The probability density function of the von Mises distribution in
given by:
f
(
φ
)
=
e
κ cos
(
φ − μ
)
2πI
0
(
κ
)
(A1)
where φ is the phase (−π < φ < π), μ and 1/κ are analogous
to the mean and variance of the normal distribution respec-
tively and I
0
(κ) is the zero-order modified Bessel function. In two
dimensions, circular variables can be represented as a probability
distribution on a torus and a convenient parallel to the bivariate
normal distribution is given by the two dimensional von Mises
distribution whose probability density function is given by Singh
et al. (2002):
f
(
φ, ψ
)
=
1
C
e
[
κ
φ
cos
[
(
φ − μ
φ
)
]
+ κ
ψ
cos
[
(
φ − μ
ψ
)
]
+ λ sin
[
(
φ − μ
φ
)
]
sin
[
(
ψ − μ
ψ
)
]]
(A2)
where C is a normalizing constant and λ is a parameter describ-
ing the statistical dependency between the two distributions φ
and ψ. Concentration values of, κ,weredefinedsothatκ
φ
= κ
ψ
and the values used in the simulations were [0.25, 0.5, 1, 2, 4,
8]—see Figure 2. The mutual information, I
φψ
,betweendistribu-
tions depended upon λ and κ and could be estimated accurately
through numerical integration (Hnizdo et al., 2008). Values of λ
were selected for each value of κ, that generated distributions with
mutual information values of [0, 0.0204, 0.0872, 0.2231, 0.5108].
For convenience, mutual information values were converted to
putative correlation values by the relationship r =
1 − e
−2I
φψ
giving values of [0, 0.2, 0.4, 0.6, 0.8] respectively.
Frontiers in Human Neuroscience www.frontiersin.org December 2013 | Volume 7 | Article 881
|
69

OPINION ARTICLE
published: January 2014
doi: 10.3389/fnhum.2013.00720
Operationalizing interdisciplinary research—a model of
co-production in organizational cognitive neuroscience
Michael J. R. Butler
*
Work and Organisational Psychology Group, Aston Business School, Aston Universit y, Birmingham, UK
*Correspondence: m.j.r.butler@aston.ac.uk
Edited by:
Sven Braeutigam, University of Oxford, UK
Keywords: neurosciences, organizational cognitive neuroscience, organizational behavior, organizational sciences, interdisciplinary communication,
co-production research
There is a biological turn in order to
understand the underlying processes con-
cerning markets and organizations. As part
of the biological turn, in 2008, I wrote
an article for the Journal of Consumer
Behavior about neuromarketing and the
perceptions of knowledge (Butler, 2008).
Theargumentputforwardinthearticleis
that there are inter-related and potentially
competing p erspectives which combine to
make up the biological turn. In order
to conceptualize these varied perspec-
tives I introduced a novel Neuromarketing
Research Model. This commentary is con-
cerned w ith updating the Model and using
it to reveal some of the current intersec-
tions between society, organizations and
the brain.
By taking this approach, I want to
supplement David Waldman’s opin-
ion article in this special issue titled
“Interdisciplinary research is the key.”
Waldman (2013) argues that organiza-
tional sciences are rapidly coming together
with neuroscience theory and methods to
provide new insights into organizational
phenomena, especially the larger prob-
lems facing organizations. I add to this
argument by identifying specific points
of how organizations and neuroscientists
are coming together, and operationalize
interdisciplinary research by propos-
ing a new Model of Co-Production in
Organizational Cognitive Neuroscience
(OCN). OCN is defined as the applica-
tion of neuroscientific methods to analyse
and understand human behavior within
the applied setting of organizations, which
may be at the individual, group, organi-
zational, inter-organizational, and societal
levels. OCN draws together all the fields
of business and management in order
to integrate understanding about human
behavior in organizations and to more
fully understand social behavior (Butler
and Senior, 2007).
I will re-introduce the purpose of the
original Neuromarketing Research Model
and state why it fits with this collection
of papers, then I will briefly describe the
Model in more detail. This will be followed
by revising the Model to capture develop-
ments in OCN since 2008, and by using
the updated Model to cohere different and
fundamental themes and directions at the
frontier of human neuroscience.
HUMAN MODES OF PERCEPTION IN
ORGANIZATIONAL COGNITIVE
NEUROSCIENCES
The purpose of connecting neuromarket-
ingandtheperceptionofknowledgewas
to address the perennial concern about
the interconnection between research and
practice, and the different perceptions
about the development and application
of knowledge about neuromarketing. This
concern is implicit in the theme of society,
organizations and the brain. Basic human
neuroscience research in the field of man-
agement and organizations is likely to be
applied to practitioners through knowl-
edge exchange processes.
I used Jacob Bronowski and Kant to
connect neuromarketing and the percep-
tion of knowledge. In 1967, Bronowski
profoundly argued that it is pointless to
talk about what the world is like when the
modes of perception of the world which
are a ccessible to us have changed so much
(Bronowski, 1978). By the role of per-
ception Bronowski (1978) took a Kantian
view which argues that our knowledge of
the outside world depends on our human
modes of perception.
Nearly fifty years on from Bronowski’s
lecture series, our modes of perception
have moved on again—neuroscience as
a field of study has emerged. As a con-
sequence, a Neuromarketing Research
Model was proposed. The Model was
developed from the work of Stokes (1997)
and Tushman et al. (2007; Tushman
and O’Reilly, 2007). Tushman et al.
(2007; Tushman and O’Reilly, 2007)
adapted Stokes’ (1997) work to inform
the debate about the role of business
school research. Tushman et al. (2007;
Tushman and O’Reilly, 2007)argue
that unlike conventional academic disci-
plines which focus on basic disciplinary
research (economics, psychology, and
sociology) and consulting firms w hich
focus on meeting clients’ needs, business
schools are about rigor and relevance.
Whilst agreeing with Tushman et al.’s
(2007; Tushman and O’Reilly, 2007)
argument, their model is problematic
because it compresses the range of busi-
ness school activity into a narrow set of
behaviors concerning research and its
application.
In its place, the Neuromarketing
Research Model interconnected different
perceptions of neuromarketing knowl-
edge. Basic research reporting satisfies
the needs of academics and applied
research reporting the needs of employers
(Doherty, 1994). Media reporting is less
definitive b ecause it satisfies the needs of
the target audience for the publication,
which could be academic or practice-
based. Similarly, power processes is less
definitive because they satisfy the needs of
dominant actors in the networks identified
here by knowledge becoming ideological
and biased in favor of particular actors
through a conflictual process (Clegg and
Palmer, 1996; Stiles, 2004). Waldman
(2013) dedicates a section in his article
to institutional and personal impediments
hindering the application of neuroscience
Frontiers in Human Neuroscience www.frontiersin.org January 2014 | Volume 7 | Article 720
|
HUMAN NEUROSCIENCE
16
70
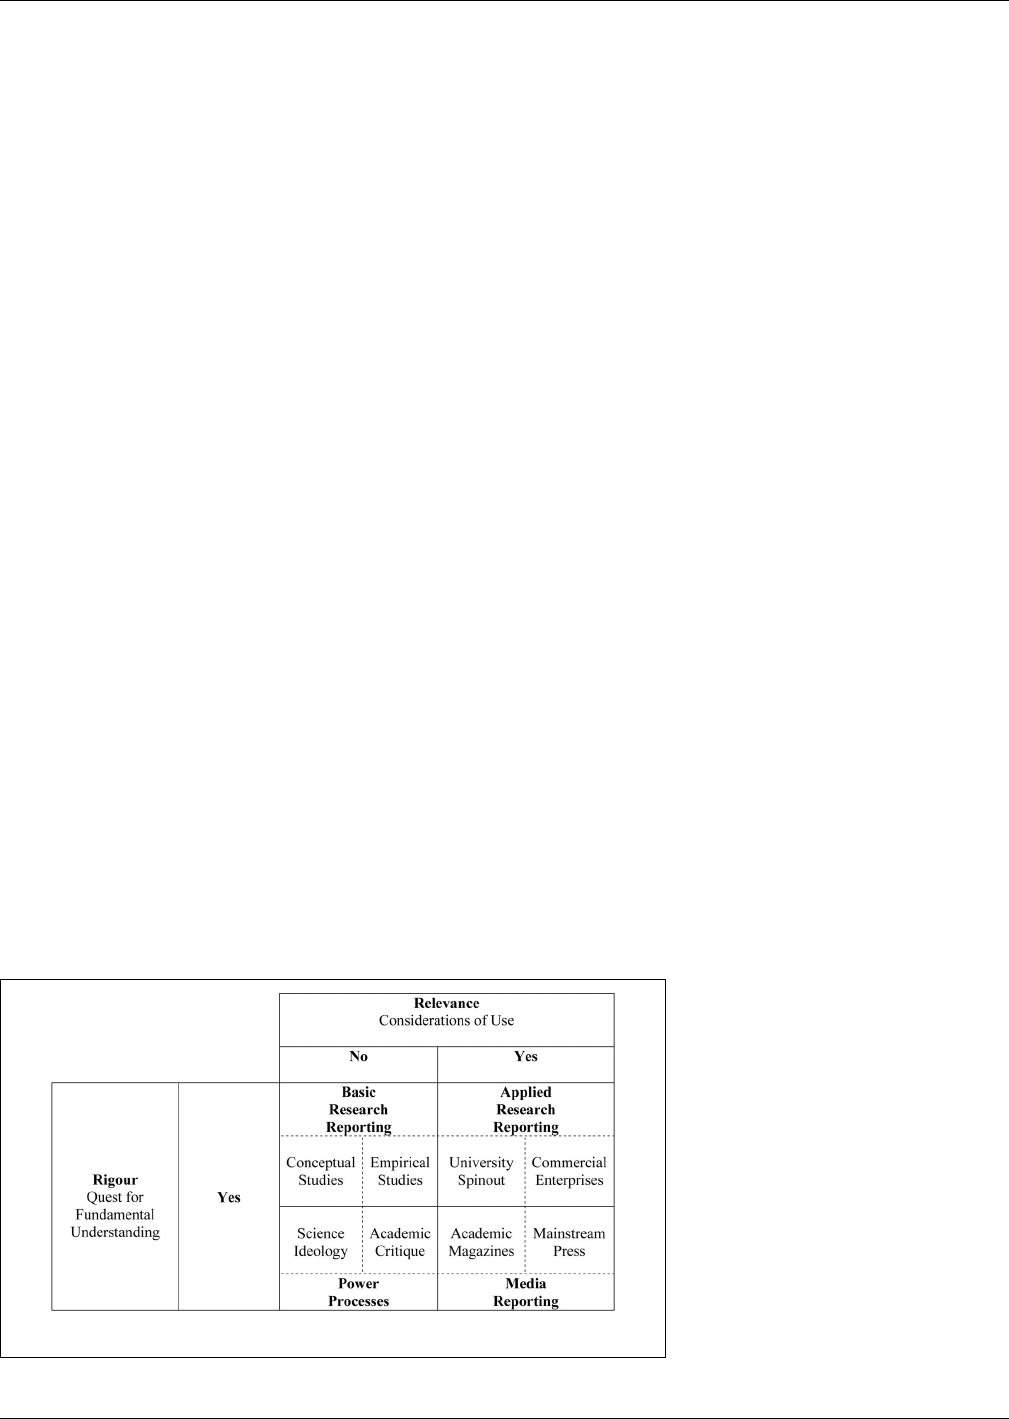
Butler Coproduction model—organizational cognitive neuroscience
to his own area of expertise, leadership in
organizations.
A MODEL OF CO-PRODUCTION IN
ORGANIZATIONAL COGNITIVE
NEUROSCIENCE
This commentary proposes a new Model
of Co-Production in OCN because our
modes of perception have moved on still
further (Figure 1). The components of
the original Model remain in place (in
boldtext).Thereare,however,foursub-
stantial changes. First, this commentary
emphasizes the rigorous quest for under-
standing OCN rather than those which
are less rigorous, in other words, the pre-
sentation of OCN work which reassures
readers that appropriate methods and
approaches have been adopted. Second,
the new Model has additional elements
to capture the emergent complexities at
the intersection between society, organi-
zations, and the brain. The new cells
have dotted line divisions to indicate that
they are sub-divisions of the four main
quadrants described in the previous sec-
tion: Basic Research Reporting, Applied
Research Reporting, Media Reporting, and
Power Processes. Third, because human
neuroscience is being applied more widely
across management and organizations,
going beyond neuromarketing and neu-
roeconomics, the examples used in the
following sections reflect this expansion
of application. Fourth, the term “co-
production” is used to describe the model.
Co-production is derived from a mode
2 approach to researching management
and organizations (Gibbons et al., 1994).
FIGURE 1 | Model of Co-Production in Organizational Cognitive Neuroscience.
Knowledgeisproducedinthecontextof
a real-world problem and the theoretical
development is co-negotiated with prac-
titioners. The Model of Co-Production
in OCN reflects this intersection, high-
lighting both rigor and relevance, or the
quest for fundamental understanding and
the conditions of use. Indeed, university-
organization relationships provide a pro-
ductive setting for knowledge exchange
research (Perkmann and Walsh, 2007).
Waldman (2013) expresses this approach
in his article stating he has had much
more success at connecting with neu-
roscientists who combine the scientist-
practitioner model, including establishing
their own firms to produce applications to
such maladies as attention deficit disorder
and sleep apnea.
Waldman’s (2013) point fits within the
Applied Research Reporting quadrant of
Figure 1, the university spinout cell. The
quadrant as a whole emphasizes that prac-
titioners are mindful of the need for sci-
entific rigor and ethical considerations in
human neuroscience work. Commercial
success, whether a university spinout or
another type of commercial enterprise,
depends on clients having confidence in
the results they are presented with and
confidence comes from rigor and ethical
practice (Brammer, 2004).
My focus is the intersection between
Basic Research Reporting and Power
Processes. In my original article, I noted
that most attention is being given to basic
research reporting because foundational
research is currently being undertaken.
The debates have become much more
nuancedoverthelast5yearsandthenew
Model of Co-Production in OCN divides
Basic Research Reporting into two fur-
ther cells to take account of the wealth of
conceptual articles and the growing empir-
ical research. Conceptual debates are now
appearing in established management and
organization journals like the Journal of
Management, and the journal web site has
dedicated space to emphasize the emerging
conversation about human neuroscience
in the context of management (see Becker
et al., 2011; Lee et al., 2012a).
In addition, special issues of highly
regarded academic journals like the
Leadership Quarterly capture specific
themes at the intersection between organi-
zations and the brain. Crucially, this allows
conversations about OCN and leadership
to involve both conceptual and empirical
studies which include rigorous data col-
lection and analysis (see Lee et al., 2012b).
An illustrative empirical piece is Boyatzis
et al. (2012), which examines the neu-
ral substrates activated in memories of
experiences with resonant and dissonant
leaders.
The intersection between the Basic
Research Reporting and the Power
Processes quadrants is crucial to the
development of frontier research. As the
number of published conceptual and
empirical studies in the field of OCN
grows, so does the academic critique of
the OCN perspective. Rigorous and rel-
evant debate advances OCN. This avoids
knowledge, including emerging science
theories like OCN, becoming ideological
andbiasedinfavorofparticularactors
through a conflictual process (Callon
et al., 1986; Clegg and Palmer, 1996; Stiles,
2004).
Edwards (2013) introduces a realist cri-
tique of OCN. The argument being that
it is important to consider how men-
tal processes interact with “context” to
produce social behavior. The Model of
Co-Production in OCN is one manifesta-
tion of the interaction between the micro
and macro levels. More generally, in the
field of strategy implementation, my work
explicitly acknowledges that different lev-
els of change are co-evolving and dynamic
(Butler, 2003; Butler and Allen, 2008).
Lindebaum and Zundel (2013a) rightly
maintain that without explicit considera-
tion of, and solutions to, the challenges of
Frontiers in Human Neuroscience www.frontiersin.org January 2014 | Volume 7 | Article 720
|
71

Butler Coproduction model—organizational cognitive neuroscience
reductionism, the possibilities to advance
leadership studies theoretically and empir-
ically are limited. By reductionism they
mean that neuroscientific approaches
identify and analyze basic mechanisms
that are assumed to give rise to high er
order organizational phenomena, for
instance, the way that inspirational lead-
ers are identified and developed. In a
lively exchange, Lindebaum (2012) and
Cropanzano and Becker (2013) discuss
the relative merits of neuro-feedback
processes for the purpose of leader
development and the ethical implications.
In terms of the Model of Co-
Production in OCN, the previous
discussion has an important implication
for Basic Research Reporting—the dan-
ger of informing organizational practice
inadequately and perhaps dangerously.
As Edwards (2013) indicates, OCN can
lend itself to over-interpretation, espe-
cially where scholars wish to find a simple
and unique truth.
There is a similar implication for Media
Reporting. The mainstream press can pop-
ularize ideas related to OCN and in
doing so over-simplify complex research.
Hannaford (2013), though, includes rel-
evant research from leading institutions
like the Max Planck Institute to support
the argument in his newspaper article.
Lindebaum and Zundel’s (2013b) recent
article in the academic magazine Times
Higher Education also helps to re-balance
popular perceptions of OCN.
CONCLUDING REMARKS
We are further along the lifecycle of the
new field of study of OCN. Fugate (2007)
argues that in order for OCN to become
legitimized, it would be necessary to con-
struct a behavioral model that would pre-
dict which stimuli provide the appropriate
brain structure with the material it needs
to accomplish its assigned task. We seem
some distance from a behavioral model.
Nevertheless, this commentary has cap-
tured how research reporting within OCN
is advancing, by proposing the Model of
Co-ProductioninOCN.Inparticular,dif-
ferent themes and directions of research
are found at the intersection between Basic
Research Reporting and Power Processes.
These debates, however, are also migrat-
ing into Applied Research Reporting and
Media Reporting. This can only advance
OCN. A variety of voices rigorously and
relevantly debating OCN will advance this
particular frontier in human neuroscience
through the critique of emergent ideas.
REFERENCES
Becker, W. J., Cropanzano, R., and Sanfey, A. G.
(2011). Organizational cognitive neuroscience:
taking organizational theory inside the neu-
ral black box. J. Manage. 37, 933–961.doi:
10.1177/0149206311398955
Boyatzis, R. E., Passarelli, A. M., Koenig, K., Lowe,
M., Mathew, B., Stoller, J. K., et al. (2012).
Examination of the neural substr ates activated in
memories of experiences with resonant and dis-
sonant leaders. Leadersh. Q. 23, 259–272. doi:
10.1016/j.leaqua.2011.08.003
Brammer, M. (2004). Correspondence—brain scam?
Nat. Neurosci. 7, 1015. doi: 10.1038/nn1004-1015
Bronowski, J. (1978). The Origins of Knowledge and
Imagination. New Haven; London: Yale University
Press.
Butler, M. J. R. (2003). Managing from the inside
out: drawing on “receptivity” to explain varia-
tion in strategy implementation. Br. J. Manage. 14,
S47–S60. doi: 10.1111/j.1467-8551.2003.00392.x
Butler, M. J. R. (2008). Neuromarketing and the
perception of knowledge. J. Consum. Behav. 7,
415–419. doi: 10.1002/cb.260
Butler, M. J. R., and Allen, P. (2008). Understanding
policy implementation processes as self-organizing
systems. Public Manage. Rev. 10, 421–440. doi:
10.1080/14719030802002923
Butler, M. J. R., and Senior, C. (2007). Towards
an organizational cognitive neuroscience.
Ann. N.Y. Acad. Sci. 1118, 1–17. doi:
10.1196/annals.1412.009
Callon, M., Law, J., and Rip, A. (eds.) (1986).
Mapping the Dynamics of Science and Technology—
Sociology of Science in the Real World.Basingstoke:
Macmillan.
Clegg, S. R., and Palmer, G. (eds.) (1996). The Politics
of Management Knowledge. London: Sage.
Cropanzano, R., and Becker, W. J. (2013). The promise
and peril of organizational neuroscience: today
and tomorrow. J. Manage. Inq. 22, 306–310. doi:
10.1177/1056492613478518
Doherty, G. (1994). Can we have a unified the-
ory of quality? High. Educ. Qual. 48, 240–255.
doi:10.1111/j.1468-2273.1994.tb01656.x
Edwards, P. (2013). Neuroscience and Reductionism:
Some Realist Reflections. Birmingham Business
School, Discussion Paper Series, 2013–2008.
Fugate, D. L. (2007). Neuromarketing: a layman’s look
at neuroscience and its potential application to
marketing practice. J. Consum. Mark. 24, 385–394.
doi: 10.1108/07363760710834807
Gibbons, M. L., Limoges, C., Nowotney, S.,
Schwartman, S., Scott, P., and Trow, M. (1994).
The New Production of Knowledge: The Dynamics
of Science and Research in Contemporary Societies.
London: Sage.
Hannaford, A. (2013). Neuromarketing: Can Scie nce
Predict What We’ll Buy? The Telegraph.13April.
[Accessed: 30 September 2013]. Available online
at: http://www.telegraph.co.uk/science/science-
news/9984498/Neuromarketing-can-science-
predict-what-well-buy.html
Lee, N. J., Senior, C., and Butler, M. J. R. (2012a).
The domain of organizational cognitive neu-
roscience: theoretical and empirical challenges.
J. Manage. 38, 921–931. doi: 10.1177/0149206312
439471
Lee, N., Senior, C., and Butler, M. J. R. (2012b).
Leadership research and cognitive neuroscience—
The state of the union. Leadersh. Q. 23, 213–218.
doi: 10.1016/j.leaqua.2011.08.001
Lindebaum, D. (2012). I rebel—Therefore we exist:
emotional standardization in organizations and
the emotionally intelligent individual. J. Manage.
Inq. 21, 262–277. doi: 10.1177/1056492611430125
Lindebaum, D., and Zundel, M. (2013a). Not quite
a revolution: scrutinizing organizational cognitive
neuroscience in leadership studies. Hum. Relat. 66,
857–877. doi: 10.1177/0018726713482151
Lindebaum, D., and Zundel, M. (2013b). Neuron
Firing and Hiring. Times Higher Education.
[Accessed: 30 September 2013]. Available online
at: http://www.timeshighereducation.co.uk/what-
makes-a-good-leader-dont-ask-aneuron-say-dirk-
lindebaum-and-mikezundel/2004183.article
Perkmann, M., and Walsh, K. (2007). University–
industr y relationships and open innovation:
towards a research agenda. Int. J. Manage. Rev.
9, 259–280. doi: 10.1111/j.1468-2370.2007.
00225.x
Stiles, D. R. (2004). Narcissus revisited: the values
of management academics and their role in busi-
ness school strategies in the UK and Canada.
Br. J. Manage. 15, 157–175. doi: 10.1111/j.1467-
8551.2004.00412.x
Stokes, D. E. (1997). Pasteur’s Quadrant: Basic Science
and Technological Innovation.Washington,DC:
Brookings Institution Press.
Tushman, M., and O’Reilly, III. C. (2007). Research
and relevance: implications of Pasteur’s quad-
rant for doctoral programs and faculty devel-
opment. Acad. Manage. J. 50, 769–774. doi:
10.5465/AMJ.2007.26279169
Tushman, M. L., O’Reilly, C. A., Fenollosa,
A., Kleinbaum, A. M., and McGrath, D.
(2007). Relevance and rigor: executive edu-
cation as a lever in shaping practice and
research. Acad. Manage. Learn. 6, 345–362.
doi: 10.5465/AMLE.2007.26361625
Waldman, D. A. (2013). Interdisciplinary research
is the key. Front. Hum. Neurosci. 7:562. doi:
10.3389/fnhum.2013.00562
Received: 01 October 2013; accepted: 17 December 2013;
published online: January 2014.
Citation: Butler MJR (2014) Operationalizing interdis-
ciplinary research—a model of co-production in organi-
zational cognitive neuroscience. Front. Hum. Neurosci.
7:720. doi: 10.3389/fnhum.2013.00720
This article was submitted to the journal Frontiers in
Human Neuroscience.
Copyright © 2014 Butler. This is an open-access article
distributed under the terms of the Creative Commons
Attribution License (CC BY). The use, distribution or
reproduction in other forums is permitted, prov ided the
original author(s) or licensor are credited and that the
original publication in this journal is cited, in accor-
dance with accepted academic practice. No use, distribu-
tion or reproduction is permitted which does not comply
with these terms.
Frontiers in Human Neuroscience www.frontiersin.org January 2014 | Volume 7 | Article 720
|
16
72

HUMAN NEUROSCIENCE
PERSPECTIVE ARTICLE
published: 24 September 2014
doi: 10.3389/fnhum.2014.00748
Dehumanization in organizational settings: some scientific
and ethical considerations
Kalina Christoff*
Department of Psychology, University of British Columbia, Vancouver, BC, Canada
Edited by:
Carl Senior, Aston University, UK
Reviewed by:
Raymond A. Mar, York University,
Canada
Anthony Ian Jack, Case Western
Reserve University, USA
*Correspondence:
Kalina Christoff, Department of
Psychology, University of British
Columbia, 2136 West Mall,
Vancouver, BC V6T 1Z4, Canada
e-mail: kchristoff@psych.ubc.ca
Dehumanizing attitudes and behaviors frequently occur in organizational settings and
are often viewed as an acceptable, and even necessary, strategy for pursuing personal
and organizational goals. Here I examine a number of commonly held beliefs about
dehumanization and argue that there is relatively little support for them in light of the
evidence emerging from social psychological and neuroscientific research. Contrary to
the commonly held belief that everyday forms of dehumanization are innocent and
inconsequential, the evidence shows profoundly negative consequences for both victims
and perpetrators. As well, the belief that suppressing empathy automatically leads to
improved problem solving is not supported by the evidence. The more general belief that
empathy interferes with problem solving receives partial support, but only in the case
of mechanistic problem solving. Overall, I question the usefulness of dehumanization in
organizational settings and argue that it can be replaced by superior strategies that are
ethically more acceptable and do not entail the severely negative consequences associated
with dehumanization.
Keywords: dehumanization, empathy, problem solving, reasoning, beliefs, ethics, medicine, decision making
INTRODUCTION
Dehumanizing attitudes and behaviors frequently occur in orga-
nizational settings and are often viewed as an acceptable, and even
necessary, strategy for pursuing personal and organizational goals.
Behind this view, there lie a number of commonly held beliefs
about dehumanization. These beliefs are culturally determined,
rather than based on scientific observation. One such belief is
that subtle forms of dehumanization, such as disrespect, conde-
scension, and neglect, are innocent and inconsequential. It is also
commonly believed that empathy interferes with problem solving
and that therefore, suppressing our naturally occurring empathy,
and the dehumanization this suppression entails, are necessary to
help us make better decisions and improve our problem solving
capacity.
Are those beliefs supported by the scientific evidence? Here
I review social psychological and neuroscientific advances on
dehumanization and show that a number of our beliefs about
dehumanization are not supported by the evidence. Although the
belief that empathy interferes with problem solving is partially
supported, the scientific evidence on this is very new and still
contentious. Overall, I question the usefulness of dehumanization
in organizational settings and argue that it can be replaced by
superior strategies that are ethically more acceptable and do not
entail the severely negative consequences that are often associated
with dehumanization.
DEHUMANIZATION AS AN EVERYDAY PHENOMENON
Early psychological theories viewed dehumanization as an
extreme phenomenon, occurring primarily in the context of
ethnic or racial intergroup conflict (Kelman, 1976; Staub,
1989; Opotow, 1990). More recently, however, an expanded
view of dehumanization has emerged. This expanded view
recognizes that dehumanization can occur in interpersonal
as well as intergroup contexts, and is not limited to condi-
tions of overt conflict (for review see, Haslam and Loughnan,
2014). Instead, dehumanization appears to be an everyday
social phenomenon, rooted in ordinary social-cognitive processes
(Haslam, 2006).
How do people dehumanize others? When someone is dehu-
manized, they are implicitly or explicitly perceived as lacking
qualities that are considered to be characteristically human.
According to Haslam’s (2006) dual model of dehumanization,
there are two forms of dehumanization corresponding to two
different forms of humanness being denied. One is an “ani-
malistic” form of dehumanization in which humans are denied
qualities that are considered to distinguish them from animals—
qualities such as refinement, self-control, intelligence, and ratio-
nality. This form of dehumanization is often discussed in the
context of ethnicity, race, and related topics such as immigra-
tion and genocide (e.g., Kelman, 1976; Chalk and Jonassohn,
1990).
Dehumanization can also take a “mechanistic” form in
which humans are likened to objects or automata and are
denied qualities such as warmth, emotion, and individual-
ity (Haslam, 2006). Such “mechanistic” dehumanization is
more likely to occur in interpersonal interactions and orga-
nizational settings. It is frequently discussed in the con-
texts of technology (Montague and Matson, 1983), medicine
Frontiers in Human Neuroscience www.frontiersin.org September 2014 | Volume 8 | Article 748 |
73

Christoff Dehumanization in organizational settings
(Szasz, 1973; Fink, 1982; Barnard, 2001), and other domains
such as sexual objectification (Fredrickson and Roberts, 1997;
Nussbaum, 1999) in which people are often perceived as inert or
instrumental.
Dehumanization can also range from blatant and severe to
subtle and relatively mild (Haslam and Loughnan, 2014). Such
relatively mild dehumanizing behaviors can manifest themselves
in the form of subtle disrespect, condescension, neglect, social
ostracism and other relational slights (Bastian and Haslam, 2011),
often only evident in looks, gestures, and tones of voices. These
subtle, everyday forms of dehumanization are often viewed as
innocent and inconsequential (e.g., Sue et al., 2007). How does
this view compare to the scientific evidence?
THE NEGATIVE CONSEQUENCES OF EVERYDAY
DEHUMANIZATION
There is overwhelming evidence for the wide-reaching nega-
tive consequences of relatively mild dehumanizing attitudes and
behaviors. Dehumanizing others leads to increased anti-sociality
towards them in the form of increased aggressive behaviors such
as bullying (Obermann, 2011) and harassment (Rudman and
Mescher, 2012), as well as hostile avoidance behaviors such as
social rejection (Martinez et al., 2011). This increased hostil-
ity and aggression are accompanied by reduced moral worth
attributed to those who are dehumanized (Opotow, 1990; Haslam
and Loughnan, 2014) and they are therefore judged less worthy
of protection from harm (Gray et al., 2007; Bastian and Haslam,
2011). The perpetrators of such interpersonal maltreatments
themselves may experience negative emotions such as guilt and
shame (Baumeister et al., 1995; Tangney et al., 1996), which
may lead to even stronger dehumanizing attitudes towards their
targets in an attempt to downplay their suffering and justify their
maltreatment. Such dehumanization in response to guilt has been
demonstrated in intergroup contexts (Castano and Giner-Sorolla,
2006). A vicious cycle may emerge, whereby dehumanization
promotes maltreatment and aggression, which further promotes
dehumanization.
The negative consequences for those who are dehumanized
are also striking. Everyday interpersonal maltreatments can leave
its victims feeling degraded, invalidated, or demoralized (Hinton,
2004; Sue et al., 2007). There is extensive research into the negative
consequences of being denied autonomy (Ryan and Deci, 2000),
betrayed (Finkel et al., 2002), humiliated (Miller, 1993), socially
excluded (Baumeister and Leary, 1995; Twenge et al., 2007), or not
recognized as a person (Honneth, 1992)—all situations that are
likely to be experienced as dehumanizing (Bastian and Haslam,
2011).
When people are mechanistically dehumanized by being
treated as objects, as means to an end, or as lacking the capacity for
feeling, they tend to enter into “cognitive deconstructive” states
that are characterized by reduced clarity of thought, emotional
numbing, cognitive inflexibility, and an absence of meaningful
thought (Twenge et al., 2003; Bastian and Haslam, 2011). Expe-
riencing this form of dehumanization leads to pervasive feelings
of sadness and anger. Also dehumanizing are status-reducing
interpersonal maltreatments such as condescension, degradation,
or being treated as embarrassing, incompetent, unintelligent, or
unsophisticated (Vohs et al., 2007), which lead to feelings of guilt
and shame (Bastian and Haslam, 2011).
Such dehumanizing maltreatments are likely to have a
detrimental effect on psychological wellbeing. According to
self-determination theory (Ryan and Deci, 2000), psycholog-
ical wellbeing requires that the basic psychological needs of
autonomy, competence, and relatedness are met. Dehuman-
izing maltreatments, however subtle, lead to impaired ability
to satisfy these needs and may therefore directly contribute
to mental illnesses such as depression, anxiety, and stress-
related disorders. In short, the scientific evidence does not
support the view of everyday dehumanization as an inno-
cent and inconsequential phenomenon; on the contrary, the
evidence clearly demonstrates a range of significant negative
consequences.
THE RELATIONSHIP BETWEEN EMPATHY AND PROBLEM
SOLVING
Another commonly held view about dehumanization concerns
the relationship between empathy and problem solving. Accord-
ing to this view, there is a trade-off between empathy and problem
solving (e.g., Haque and Waytz, 2012) and the two are mutually
incompatible; therefore, suppressing empathy is necessary for
effective problem solving. To what extent does psychological and
neuroscientific research support this view?
Human thinking and problem solving can be said to occur
in two distinct domains: the physical domain, which involves
reasoning about the mechanical properties of inanimate objects,
and the social domain, which involves thinking about the mental
states of others (Jack et al., 2012)– a process also known as “men-
talizing” (Frith et al., 1991). Psychological and neuroscientific
research shows that empathy—or our capacity to recognize other
people’s emotions—is not only compatible with problem solving
in the social domain, but that it is also crucial for it (Amodio and
Frith, 2006; Harris and Fiske, 2006). On the other hand, is there
evidence that empathy is incompatible with problem solving in
the physical domain?
A distinction between social and physical problem solving has
been suggested at the neural level. Social reasoning about the
mental states of others is associated with increased recruitment
of the brain’s “default” network and reduced recruitment of
the so called “task-positive” network; conversely, “mechanistic”
reasoning about physical objects appears to be associated with
increased recruitment of the “task-positive” network and reduced
recruitment of the “default” network (Jack et al., 2012). Although
these two networks are involved in multiple processes and the
specificity of their function is still under much debate, they appear
to be frequently anti-correlated during conditions of “rest” (Fox
et al., 2005) and during many standard cognitive tasks (Shulman
et al., 1997).
Anti-correlations between the “default” and the “task-positive”
networks were originally interpreted to indicate that the two
networks function in opposition to each other and are marked
by a negative reciprocal relationship (e.g., Fox et al., 2005). More
recently however, neuroscientists have realized that the exact
nature of the neural relationship between these two networks is
much more complex than a simple obligatory negative reciprocity
Frontiers in Human Neuroscience www.frontiersin.org September 2014 | Volume 8 | Article 748 |
74

Christoff Dehumanization in organizational settings
(e.g., Spreng et al., 2010; Boyatzis et al., 2014). Positive corre-
lations or lack of anti-correlations between the two networks
have been observed during creative thinking (Ellamil et al., 2011),
mind-wandering (Christoff et al., 2009), and naturalistic film
viewing (Golland et al., 2007). Furthermore, it has become appar-
ent that reduced recruitment in one network does not necessarily
lead to increased recruitment in the other. With specific relevance
to dehumanization, reductions in “default” network recruitment
have been observed in the absence of change in recruitment of
“task-positive” regions (Jack et al., 2013). While this field is new
and still growing, the neuroscientific evidence so far does not
support the notion that reduced empathy (or dehumanization)
automatically and necessarily leads to improved mechanistic rea-
soning at the cognitive level.
There is some evidence, however, that the social and physical
domains may become incompatible at higher levels of reason-
ing complexity. The process of relational integration, or con-
sidering multiple relations simultaneously, characterizes complex
forms of reasoning (Halford et al., 2010) and is specifically
associated with increased recruitment of rostrolateral prefrontal
cortex (RLPFC) during problem solving in both the physical
(e.g., Christoff et al., 2001) and social (Raposo et al., 2011)
domains. Problem solving in the two domains may, therefore,
become incompatible at higher levels of reasoning complexity
due to competition for access to the same neural and cognitive
resources.
In short, scientific evidence suggests that the distinction
between reasoning in the social and physical domains may be
crucial for determining the relationship between empathy and
problem solving. In the social domain, empathy is not only
compatible with problem solving; it is a crucial component of
reasoning about other people’s mental states. In the physical
domain, on the other hand, there is some suggestive evidence
that empathy and mechanistic problem solving may interfere,
especially at higher levels of reasoning complexity (see also Dixon
et al., 2014). However, the notion that reductions in empathy
automatically lead to improved mechanistic problem solving is
not supported by the evidence.
QUESTIONING THE USEFULNESS AND ETHICS OF
DEHUMANIZING STRATEGIES
Dehumanization is sometimes presented as both necessary and
beneficial. For example, it has been argued that dehumanization
and moral disengagement allows physicians to inflict pain on their
patients—pain which is sometimes necessary for diagnosis and
treatment (Lammers and Stapel, 2011; Haque and Waytz, 2012).
This argument has been extended beyond medical contexts, to
argue that dehumanization in general helps people in position
of power to make “tough” decisions that may cause pain and
suffering for others; it helps by allowing such decisions to be
made in a more distant, cold, and rational manner (Lammers
and Stapel, 2011). It has also been argued that by dehumanizing
patients, health care workers can “protect” themselves against
“burnout” from the emotional demands of working with suf-
fering patients (Vaes and Muratore, 2013), and that mechanistic
dehumanization of patients in the form of “decomposing people
and their symptoms into physiological systems and subsystems” is
necessary for “higher level” medical problem solving (Haque and
Waytz, 2012).
Whether such “functional” dehumanization is a truly ben-
eficial strategy, however, is highly questionable. It is true that
physicians sometimes need to inflict pain on their patients
through diagnosis and treatment, but if this pain is necessary
for the reduction in the patient’s overall suffering, physicians
could mentally focus on this overall improvement as a way of
coping. Dehumanizing their patients seems, in comparison, a
much more negative and, arguably, much more dysfunctional way
of coping—especially considering the profoundly negative conse-
quences it can have for the doctor-patient relationship (Benedetti,
2011). Similarly, avoiding burnout in health care workers can be
achieved without requiring them to dehumanize their patients;
instead, health care workers could be provided with reduced
workload and better support. Furthermore, continually having
to suppress their naturally occurring empathic response may
create an additional form of stress in some health care workers.
Alternative forms of emotional regulation (Gross, 1998; Grandey,
2000) may help reduce health care workers’ stress with fewer
costs to themselves and their patients. Overall, the argument that
dehumanization helps health care workers provide “better care”
(Vaes and Muratore, 2013) only makes sense if “care” itself is
understood in a dehumanized mechanistic sense.
It is also true that people in position of power sometimes have
to make “tough” decisions that may cause pain and suffering
for others. The difficulty in such “tough” decisions, however,
comes from their moral nature and the ethical dilemmas they
present. Moral reasoning and decisions making by definition
require that we use our emotions and our experiences of being
human—emotional and otherwise. Dehumanizing those about
whom we are making a moral decision would of course eliminate
the moral elements of the decision making process (and therefore
make it “easier” for the decision maker), but it should also
raise some serious ethical concerns. A much more constructive
and ethically acceptable way to ease the burden of such diffi-
cult moral decisions would be to relieve the person in power
of the decision making responsibility and to place it where it
rightfully belongs: with the person who will bear the greatest
consequences of the decision. In medical contexts, this person
would be the patient (or the patient’s chosen substitute decision
maker). On the rare occasions when a patient is unable to make
such decisions and there is no available substitute decision maker,
physicians could seek moral support and advice from others and
could allow the necessary time and emotional expenditure it
takes to respect the moral and ethical nature of medical decision
making.
As well, the argument that mechanistic dehumanization, in
the sense of reducing patients to their symptoms and body
parts, is necessary for medical problem solving rests on an
outdated and largely discredited “biomedical” model of dis-
ease. The narrow, exclusive focus on anatomical, physiologi-
cal, and molecular mechanisms within this “biomedical” model
has been criticized and rejected in favor of the much broader
“biopsychosocial” model of disease and recovery (Engel, 1977;
Benedetti, 2011), which requires that psychological and social fac-
tors are included alongside biological factors in medical diagnosis
Frontiers in Human Neuroscience www.frontiersin.org September 2014 | Volume 8 | Article 748 |
75

Christoff Dehumanization in organizational settings
and decision making. Within this newer model, dehumaniza-
tion would be expected to impair medical problem solving by
causing the relevance of psychological and social factors to be
neglected.
Thus, viewing dehumanization as “functional” and beneficial
only makes sense within a very narrow and mechanistic context.
What appears “functional” within this narrow context, appears
clearly dysfunctional from a broader and more humanized per-
spective. Far from being necessary, dehumanization in medical
contexts can be replaced by superior strategies that are ethically
much more acceptable and do not entail the negative consequence
that become apparent when dehumanization is viewed from a
broader perspective.
CONCLUSIONS
Many of our beliefs about the role of dehumanization are based
on implicit empirical claims that can be examined in light of the
scientific evidence. Here I examined a number of such beliefs
and found relatively little support for them. First, contrary to
the commonly held belief that everyday forms of dehumanization
are innocent and inconsequential, the evidence shows profoundly
negative consequences of such milder forms of dehumanization
for both victims and perpetrators. Second, the belief that reduc-
tions in empathy automatically lead to improved mechanistic
problem solving is not supported by the evidence. Third, the
belief that empathy is incompatible with problem solving is par-
tially supported by the evidence, but only if “problem solving”
is equated with mechanistic reasoning about inanimate objects
in the physical domain. If problem solving is instead equated
with mentalizing, or social reasoning about other people’s mental
states, this belief is contradicted by the evidence which shows that
empathy is a necessary and a crucial element of problem solving
in the social domain. Overall, there seems to be a need to reassess
our beliefs about the role of dehumanization in organizational
settings.
Dehumanization in organizational settings is a highly complex
phenomenon with far-reaching implications, from individual,
to societal, to global environmental levels. Although scientific
evidence can be brought to bear in examining the validity of
commonly held beliefs in this area, the present analysis also shows
that many of those beliefs carry significant moral and ethical
implications. Furthermore, those beliefs may also have implicit
normative aspects that have remained unexamined so far.
An interesting case of a complex mixture of an empirical
claim and an implicit normative statement may be presented by
the argument that suppressing empathy is necessary for problem
solving in organizational settings. There is empirical evidence in
support of this argument, but only if “problem solving” is reduced
to problem solving in the physical domain (i.e., mechanistic
problem solving about inanimate objects). Therefore, this argu-
ment privileges the value of mechanistic problem solving over the
value of problem solving in the social domain, thus making an
implicit normative statement. In other words, when employees
are encouraged to suppress empathy and focus on “getting the job
done”, they are also given the message that mechanistic problem
solving is more efficient at getting the job done than empathy or
mentalizing. Such implicit normative statements may sometimes
lie at the basis of what may appear to be empirically-based
arguments.
Recognizing the co-existence of empirical and normative bases
of our beliefs about dehumanization can help us develop a
more effective approach to their critical examination. While the
empirical basis of our beliefs, when identified, can be exam-
ined in light of findings from scientific research, the normative
aspects of our beliefs are beyond the scope of scientific evidence.
Instead, they need to be assessed from ethical, philosophical, and
legalistic perspectives. Only an integrated approach that brings
together these multiple levels of analysis can help us achieve what
seems to be an insurmountable and yet a vitally important task:
the humanization of our organizations and, ultimately, the re-
humanization of our society.
REFERENCES
Amodio, D. M., and Frith, C. D. (2006). Meeting of minds: the medial frontal
cortex and social cognition. Nat. Rev. Neurosci. 7, 268–277. doi: 10.1038/nrn
1884
Barnard, A. (2001). “On the relationship between technique and dehumanization,”
in Advancing Technology, Caring and Nursing, ed R. C. Locsin (Westport, CT:
Auburn House), 96–105.
Bastian, B., and Haslam, N. (2011). Experiencing dehumanization: cognitive and
emotional effects of everyday dehumanization. Basic Appl. Soc. Psychol. 33, 295–
303. doi: 10.1080/01973533.2011.614132
Baumeister, R. F., and Leary, M. R. (1995). The need to belong: desire for
interpersonal attachments as a fundamental human motivation. Psychol. Bull.
117, 497–529. doi: 10.1037//0033-2909.117.3.497
Baumeister, R. F., Stillwell, A. M., and Heatherton, T. F. (1995). Personal narratives
about guilt: role in action control and interpersonal relationships. Basic Appl.
Soc. Psychol. 17, 173–198. doi: 10.1207/s15324834basp170100026;2_10
Benedetti, F. (2011). The Patient’s Brain: The Neuroscience behind the Doctor-Patient
Relationship. Oxford: Oxford University Press.
Boyatzis, R. E., Rochford, K., and Jack, A. I. (2014). Antagonistic neural networks
underlying differentiated leadership roles. Front. Hum. Neurosci. 8:114. doi: 10.
3389/fnhum.2014.00114
Castano, E., and Giner-Sorolla, R. (2006). Not quite human: infrahumanization in
response to collective responsibility for intergroup killing. J. Pers. Soc. Psychol.
90, 804–818. doi: 10.1037/0022-3514.90.5.804
Chalk, F., and Jonassohn, K. (1990). The History and Sociology of Genocide: Analyses
and Case Studies. New Haven, CT: Yale University Press.
Christoff, K., Gordon, A. M., Smallwood, J., Smith, R., and Schooler, J. W. (2009).
Experience sampling during fMRI reveals default network and executive system
contributions to mind wandering. Proc. Natl. Acad. Sci. U S A 106, 8719–8724.
doi: 10.1073/pnas.0900234106
Christoff, K., Prabhakaran, V., Dorfman, J., Zhao, Z., Kroger, J. K., Holyoak,
K. J., et al. (2001). Rostrolateral prefrontal cortex involvement in relational
integration during reasoning. Neuroimage 14, 1136–1149. doi: 10.1006/nimg.
2001.0922
Dixon, M. L., Fox, K. C., and Christoff, K. (2014). A framework for under-
standing the relationship between externally and internally directed cognition.
Neuropsychologia doi: 10.1016/j.neuropsychologia.2014.05.024. [Epub ahead of
print].
Ellamil, M., Dobson, C., Beeman, M., and Christoff, K. (2011). Evaluative and
generative modes of thought during the creative process. Neuroimage 59, 1783–
1794. doi: 10.1016/j.neuroimage.2011.08.008
Engel, G. L. (1977). The need for a new medical model: a challenge for biomedicine.
Science 196, 129–136. doi: 10.1126/science.847460
Fink, E. B. (1982). Psychiatry’s role in the dehumanization of health care. J. Clin.
Psychiatry 43, 137–138.
Finkel, E. J., Rusbult, C. E., Kumashiro, M., and Hannon, P. A. (2002). Dealing with
betrayal in close relationships: does commitment promote forgiveness? J. Pers.
Soc. Psychol. 82, 956–974. doi: 10.1037//0022-3514.82.6.956
Fox, M. D., Snyder, A. Z., Vincent, J. L., Corbetta, M., Van Essen, D. C., and
Raichle, M. E. (2005). The human brain is intrinsically organized into dynamic,
Frontiers in Human Neuroscience www.frontiersin.org September 2014 | Volume 8 | Article 748 |
76

Christoff Dehumanization in organizational settings
anticorrelated functional networks. Proc. Natl. Acad. Sci. U S A 102, 9673–9678.
doi: 10.1073/pnas.0504136102
Fredrickson, B. L., and Roberts, T.-A. (1997). Objectification theory: toward under-
standing women’s lived experiences and mental health risks. Psychol. Women Q.
21, 173–206. doi: 10.1111/j.1471-6402.1997.tb00108.x
Frith, U., Morton, J., and Leslie, A. M. (1991). The cognitive basis of a biological
disorder: autism. Trends Neurosci. 14, 433–438. doi: 10.1016/0166-2236(91)
90041-r
Golland, Y., Bentin, S., Gelbard, H., Benjamini, Y., Heller, R., Nir, Y., et al. (2007).
Extrinsic and intrinsic systems in the posterior cortex of the human brain
revealed during natural sensory stimulation. Cereb. Cortex 17, 766–777. doi: 10.
1093/cercor/bhk030
Grandey, A. A. (2000). Emotion regulation in the workplace: a new way to
conceptualize emotional labor. J. Occup. Health Psychol. 5, 95–110. doi: 10.
1037//1076-8998.5.1.95
Gray, H. M., Gray, K., and Wegner, D. M. (2007). Dimensions of mind perception.
Science 315:619. doi: 10.1126/science.1134475
Gross, J. J. (1998). The emerging field of emotion regulation: an integrative review.
Rev. Gen. Psychol. 2, 271–299. doi: 10.1037//1089-2680.2.3.271
Halford, G. S., Wilson, W. H., and Phillips, S. (2010). Relational knowledge: the
foundation of higher cognition. Trends Cogn. Sci. 14, 497–505. doi: 10.1016/j.
tics.2010.08.005
Haque, O., and Waytz, A. (2012). Dehumanization in medicine: causes, solu-
tions and functions. Perspect. Psychol. Sci. 7, 176–186. doi: 10.1177/
1745691611429706
Harris, L. T., and Fiske, S. T. (2006). Dehumanizing the lowest of the low: neu-
roimaging responses to extreme out-groups. Psychol. Sci. 17, 847–853. doi: 10.
1111/j.1467-9280.2006.01793.x
Haslam, N. (2006). Dehumanization: an integrative review. Pers. Soc. Psychol. Rev.
10, 252–264. doi: 10.1207/s15327957pspr1003_4
Haslam, N., and Loughnan, S. (2014). Dehumanization and infrahumanization.
Annu. Rev. Psychol. 65, 399–423. doi: 10.1146/annurev-psych-010213-115045
Hinton, E. L. (2004). Microinequities: when small slights lead to huge problems in
the workplace. DiversityInc Magazine.
Honneth, A. (1992). Integrity and disrespect: principles of a conception of moral-
ity based on the theory of recognition. Polit. Theory 20, 187–192. doi: 10.
1177/0090591792020002001
Jack, A. I., Dawson, A. J., Begany, K. L., Leckie, R. L., Barry, K. P., Ciccia, A. H., et al.
(2012). fMRI reveals reciprocal inhibition between social and physical cognitive
domains. Neuroimage 66C, 385–401. doi: 10.1016/j.neuroimage.2012.10.061
Jack, A. I., Dawson, A. J., and Norr, M. E. (2013). Seeing human: distinct and
overlapping neural signatures associated with two forms of dehumanization.
Neuroimage 79, 313–328. doi: 10.1016/j.neuroimage.2013.04.109
Kelman, H. (1976). “Violence without restraint: reflections on the dehumanization
of victims and victimizers,” in Varieties of Psychohistory, ed L. R. G. Kren (New
York: Springer), 282–314.
Lammers, J., and Stapel, D. A. (2011). Power increases dehumanization. Group
Process. Intergroup Relat. 14, 113–126. doi: 10.1177/1368430210370042
Martinez, A. G., Piff, P. K., Mendoza-Denton, R., and Hinshaw, S. P. (2011).
The power of a label: mental illness diagnoses, ascribed humanity and social
rejection. J. Soc. Clin. Psychol. 30, 1–23. doi: 10.1521/jscp.2011.30.1.1
Miller, W. I. (1993). Humiliation: and other Essays on Honor, Social Discomfort and
Violence. Ithaca, NY: Cornell University Press.
Montague, A., and Matson, F. (1983). The Dehumanization of Man. New York:
McGraw-Hill.
Nussbaum, M. C. (1999). Sex and Social Justice. Oxford, England: Oxford University
Press.
Obermann, M. (2011). Moral disengagement in self-reported and peer-nominated
bullying. Aggress. Behav. 37, 133–144. doi: 10.1002/ab.20378
Opotow, S. (1990). Moral exclusion and injustice: an introduction. J. Soc. Issues 46,
1–20. doi: 10.1111/j.1540-4560.1990.tb00268.x
Raposo, A., Vicens, L., Clithero, J. A., Dobbins, I. G., and Huettel, S. A.
(2011). Contributions of frontopolar cortex to judgments about self, oth-
ers and relations. Soc. Cogn. Affect. Neurosci. 6, 260–269. doi: 10.1093/scan/
nsq033
Rudman, L. A., and Mescher, K. (2012). Of animals and objects: men’s
implicit dehumanization of women and likelihood of sexual aggres-
sion. Pers. Soc. Psychol. Bull. 38, 734–746. doi: 10.1177/014616721243
6401
Ryan, R. M., and Deci, E. L. (2000). Self-determination theory and the facilitation
of intrinsic motivation, social development and well-being. Am. Psychol. 55, 68–
78. doi: 10.1037/0003-066x.55.1.68
Shulman, G. L., Fiez, J. A., Corbetta, M., Buckner, R. L., Miezin, F. M., Raichle,
M. E., et al. (1997). Common blood flow changes across visual tasks: II.
Decreases in cerebral cortex. J. Cogn. Neurosci. 9, 648–663. doi: 10.1162/jocn.
1997.9.5.648
Spreng, R. N., Stevens, W. D., Chamberlain, J. P., Gilmore, A. W., and Schacter,
D. L. (2010). Default network activity, coupled with the frontoparietal control
network, supports goal-directed cognition. Neuroimage 53, 303–317. doi: 10.
1016/j.neuroimage.2010.06.016
Staub, E. (1989). The Roots of Evil: The Origins of Genocide and Other Group
Violence. New York: Cambridge University Press.
Sue, D. W., Capodilupo, C., Torino, G. C., Bucceri, J. M., Holder, A. M. B.,
Nadal, K. L., et al. (2007). Racial microaggressions in everyday life: implications
for clinical practice. Am. Psychol. 62, 271–286. doi: 10.1037/0003-066x.62.
4.271
Szasz, T. S. (1973). Ideology and Insanity: Essays on the Psychiatric Dehumanization
of Man. London: Calder and Boyards.
Tangney, J. P., Wagner, P. E., Hill-Barlow, D., Marschall, D. E., and Gramzow, R.
(1996). Relation of shame and guilt to constructive versus destructive responses
to anger across the lifespan. J. Pers. Soc. Psychol. 70, 797–809. doi: 10.1037//0022-
3514.70.4.797
Twenge, J. M., Baumeister, R. F., DeWall, C. N., Ciarocco, N. J., and Bartels, J. M.
(2007). Social exclusion decreases prosocial behavior. J. Pers. Soc. Psychol. 92,
56–66. doi: 10.1037/0022-3514.92.1.56
Twenge, J. M., Catanese, K. R., and Baumeister, R. F. (2003). Social exclusion
and the deconstructed state: time perception, meaninglessness, lethargy, lack of
emotion and self-awareness. J. Pers. Soc. Psychol. 85, 409–423. doi: 10.1037/0022-
3514.85.3.409
Vaes, J., and Muratore, M. (2013). Defensive dehumanization in the medical
practice: a cross-sectional study from a health care worker’s perspective. Br. J.
Soc. Psychol. 52, 180–190. doi: 10.1111/bjso.12008
Vohs, K. D., Baumeister, R. F., and Chin, J. (2007). Feeling duped: emotional,
motivational and cognitive aspects of being exploited by others. Rev. Gen.
Psychol. 11, 127–141. doi: 10.1037/1089-2680.11.2.127
Conflict of Interest Statement: The author declares that the research was conducted
in the absence of any commercial or financial relationships that could be construed
as a potential conflict of interest.
Received: 04 June 2014; accepted: 05 September 2014; published online: 24 September
2014.
Citation: Christoff K (2014) Dehumanization in organizational settings: some
scientific and ethical considerations. Front. Hum. Neurosci. 8:748. doi: 10.3389/
fnhum.2014.00748
This article was submitted to the journal Frontiers in Human Neuroscience.
Copyright © 2014 Christoff. This is an open-access article distributed under the terms
of the Creative Commons Attribution License (CC BY). The use, distribution or
reproduction in other forums is permitted, provided the original author(s) or licensor
are credited and that the original publication in this journal is cited, in accordance with
accepted academic practice. No use, distribution or reproduction is permitted which
does not comply with these terms.
Frontiers in Human Neuroscience www.frontiersin.org September 2014 | Volume 8 | Article 748 |
77

HUMAN NEUROSCIENCE
REVIEW ARTICLE
published: 01 April 2014
doi: 10.3389/fnhum.2014.00184
Cognitive requirements of competing neuro-behavioral
decision systems: some implications of temporal horizon
for managerial behavior in organizations
Gordon R. Foxall*
Cardiff Business School, Cardiff University, Cardiff, UK
Edited by:
Nick Lee, Aston University, UK
Reviewed by:
Richard Eleftherios Boyatzis, Case
Western Reserve University, USA
William Becker, Texas Christian
University, USA
M. J. Kirton, Occupational Research
Centre, UK
*Correspondence:
Gordon R. Foxall, Cardiff Business
School, Cardiff University, Aberconway
Building, Colum Drive, Cardiff CF10
3EU, UK
e-mail: foxall@cf.ac.uk
Interpretation of managerial activity in terms of neuroscience is typically concerned with
extreme behaviors such as corporate fraud or reckless investment (Peterson, 2007; Wargo
et al., 2010a). This paper is concerned to map out the neurophysiological and cognitive
mechanisms at work across the spectrum of managerial behaviors encountered in more
day-to-day contexts. It proposes that the competing neuro-behavioral decisions systems
(CNBDS) hypothesis (Bickel et al., 2012b) captures well the range of managerial behaviors
that can be characterized as hyper- or hypo-activity in either the limbically-based impulsive
system or the frontal-cortically based executive system with the corresponding level of
activity encountered in the alternative brain region. This pattern of neurophysiological
responding also features in the Somatic Marker Hypothesis (Damasio, 1994) and in
Reinforcement Sensitivity Theory (RST; Gray and McNaughton, 2000; McNaughton and
Corr, 2004), which usefully extend the thesis, for example in the direction of personality.
In discussing these theories, the paper has three purposes: to clarify the role of cognitive
explanation in neuro-behavioral decision theory, to propose picoeconomics (Ainslie, 1992)
as the cognitive component of competing neuro-behavioral decision systems theory
and to suggest solutions to the problems of imbalanced neurophysiological activity
in managerial behavior. The first is accomplished through discussion of the role of
picoeconomics in neuro-behavioral decision theory; the second, by consideration of
adaptive-innovative cognitive styles (Kirton, 2003) in the construction of managerial teams,
a theme that can now be investigated by a dedicated research program that incorporates
psychometric analysis of personality types and cognitive styles involved in managerial
decision-making and the underlying neurophysiological bases of such decision-making.
Keywords: organizational management, decision-making, neuro-behavioral decisions systems, cognitive style,
adaption-innovation, picoeconomics
INTRODUCTION
Organizational dysfunction has numerous outcomes, from the
lack of an appropriate fit between the organization and its
environment, through the inappropriate composition of task-
based management teams, to the incompatible predispositions
and behavioral styles of individual managers. This paper is con-
cerned with the neurophysiological underpinnings of managerial
behaviors, in particular with the implications these have for the
styles of decision-making and problem-solving managers adopt
and their appropriateness for the tasks in hand. Although the neu-
rophysiological basis of behavior in organizations has attracted
considerable research attention of late (e.g., Butler and Senior,
2007a,b; Lee et al., 2007; Lee and Chamberlain, 2007), there has
been some tendency to address particular aspects of managerial
behavior such as trust, cooperation and conflict, reward process-
ing and social interaction rather than to seek a broader frame-
work of conceptualization and analysis for this central aspect
of organizational functioning. Worthy as these themes are, this
paper proposes that the competing neuro-behavioral decision
systems hypothesis (Bickel and Yi, 2008) captures the neurological
bases of forms of managerial excess that engender a pathological
tendency to avoid risk on one hand and a more reckless tendency
to discount the future consequences of current actions on the
other.
Theories of managerial behavior and, in particular,
prescriptions that derive from them, require a cognitive
understanding of the nature of decision-making. The competing
neuro-behavioral decisions systems (CNBDS), in common with
other neurophysiological accounts of behavior, tend not to have a
well-developed cognitive level of exposition. The paper, therefore,
examines picoeconomics (Ainslie, 1992), which is similarly
couched in terms of temporal discounting, as a candidate
for the cognitive component of neuro-behavioral decision
theory. Although there is a strong fit, however, picoeconomics
provides prescriptions for dealing with the excesses of managerial
behavior which befit clinical interventions but are not easily
Frontiers in Human Neuroscience www.frontiersin.org April 2014 | Volume 8 | Article 184 |
78

Foxall Cognitive requirements of neurobehavioral decision theory
implementable in the context of organizational functioning. In
order to overcome this problem, two complementary areas of
cognitive-behavioral interaction are examined with a view to
increasing understanding of the cognitive component of behavior
and suggesting managerial prescriptions, especially for team-
building. These are RST (Corr, 2008a) and Adaption-Innovation
Theory of cognitive style (Kirton, 1976, 2003), both of which
rest on neurophysiological bases that overlap with those on
which neuro-behavioral decision theory rests and contribute
to the cognitive articulation of the CNBDS hypothesis and the
suggestion of meliorating action.
Section Management, Decisions and Cognition discusses the
different kinds of management decision and relates them to
their possible underlying neurophysiological bases. It also raises
the need for clarification of the cognitive dimension of existing
theories of neuro-behavioral decision systems and the necessity
for managerial application. Section Competing Decision Sys-
tems describes the CNBDS hypothesis in detail and relates it
to RST and the relevance to managerial decision-making of
managers’ temporal horizons. Section The Cognitive Dimension
introduces in detail the necessity of a cognitive component of
the CNBDS hypothesis and the philosophical implications of
speaking of cognition. It lays out criteria for a suitable cog-
nitive component including the necessity of a cognitive theory
that proceeds at the personal level of exposition, an inten-
tional account, and potential integration with the economic
bases of CNBDS theory, and a close relationship to the basic
disciplines in terms of which the theory is couched. Section
The Cognitive Dimension also proposes picoeconomics (Ainslie,
1992) as a suitable basis for the cognitive component of neuro-
behavioral decision theory and evaluates it in terms of these
criteria.
The question of appropriate prescriptions for organizational
management is raised in Section Organization-Level Strategies
for Changing Managerial Behavior. Although picoeconomics pro-
vides insight into the nature of dysfunctional decision-making,
its prescriptions are couched in clinical terms and are directed
towards the amelioration of addictive behavior. The paper turns,
therefore, to the conceptualization of managerial behavior in
terms of adaptive-innovative cognitive style (Kirton, 2003) which
has broadly similar neurophysiological foundations but which
comes equipped with clearer implications for organizational
team-building and management. The theory also has implications
which are discussed for the understanding of commonplace terms
such as strategy, innovation and structure. Overall, the integra-
tion of neuro-behavioral decision systems with picoeconomics,
RST and adaptive-innovative cognitive style suggests a theory of
managerial behavior in organizations which comprehends and
proposes means of overcoming problems of dysfunction due to
inappropriate temporal horizons (Foxall, 2010).
MANAGEMENT, DECISIONS AND COGNITION
KINDS OF MANAGEMENT DECISION
Some managerial behaviors patently fail to achieve the goals of
the organization in which they are performed, leading often to
the downfall of the managers who are responsible for them and
sometimes to the failure of the entire organization in which the
arise. The hasty shredding of documents of forensic significance,
for instance, which has recently figured in more than one dramatic
wind-up of a corporation is maladaptive not only for the stake-
holders but for the firm itself as a continuing legal entity. For
the managers employed by the organization, whether or not they
were involved in the termination with extreme prejudice of the
documents involved, the maladaptive actions of a few may mean
at the very least the interruption of careers. The apparent greed
and excessive seeking of immediate reward that accompanied
and partially caused the financial crisis of 2008 provides another
graphic illustration of the catastrophic effects of maladaptive
managerial behavior (Wargo et al., 2010a). This extreme form of
maladaptive managerial behavior illustrates vividly the immedi-
acy that motivates some actions within organizations (Peterson,
2007). The informed planning of long-term business operations,
in the absence of intrusions caused by short-term concerns, and
the timely implementation of strategic intentions, represent the
opposite extreme.
It is most probable that neither of these scenarios will figure
in the careers of most managers but temporal horizons never-
theless are the hallmark of most managerial activities. Some are
most accurately characterized as impulsive; others as planned.
This categorization does not correspond exactly to the idea of
functional decisions on the one hand, those that meet the goals of
the organization and its members, versus dysfunction decisions
on the other, those that have outcomes that are contrary to
such goals. But it seems reasonable to argue that the majority
of impulsive decisions have some dysfunctional consequences,
while the majority of planned decisions are functional in the
sense defined. It is not helpful to write off the dysfunctional
behavior as simply “irrational”: it has its own logic and we should
seek its causes just as we seek those of its antithesis. A unified
neuroscientific framework within which to pursue these ends is
required. First, however, it is necessary to define more closely the
range of decisions with which we are concerned.
Two classifications of decisions have proved remarkably
resilient and are particularly relevant to the present discussion
because they are closely related to temporal horizons: administra-
tive, operating and strategic decisions (Ansoff, 1965) and Simon’s
(1965) distinction between programmed and non-programmed
decisions. Administrative decisions tend to be routine and to
have short time frames. Strategic decisions are, by contrast, long-
term and concern the product-market scope of the enterprise,
which involves such considerations as diversification policy, the
definition of the business, the nature of customer behavior
now and in the future, and the integration of the key busi-
ness areas, namely marketing and innovation (Drucker, 2007).
Operating decisions are derived from strategic decisions that
have been taken and entail the implementation not only of
current interfaces with the business environment, such as the
management of marketing mixes, but also the implementation
and management of appropriate administrative practices. Pro-
grammed decisions are those that are sufficiently routine to
have attracted tried and tested, rule-of-thumb decisions sys-
tems; so predictable and delegable are these matters that some
authorities question whether they entail decision-making at all.
Non-programmed decisions are those that arise de novo in
Frontiers in Human Neuroscience www.frontiersin.org April 2014 | Volume 8 | Article 184 |
79

Foxall Cognitive requirements of neurobehavioral decision theory
the wake of required responses to unstructured situations: new
governmental regulations, novel market requirements, radical
changes in a competitor’s behavior, and so on. These are generally
top-management responsibilities.
Although it is true that most administrative decisions are
well-programmed, most strategic decisions non-programmed,
and operating decisions a mixture of the two, there are pro-
grammed and non-programmed aspects of all three types of
decision identified by Ansoff. The key question is what level of
management is likely to be involved in each decision type. By
and large, administrative decisions can be delegated and taken
therefore by relatively junior managers. The repetitiveness that
characterizes them suggests that they entail a limited temporal
purview which recurs each time they are taken. Indeed, given
the extent to which they can be programmed, it is arguable
that they are not decisions at all. Strategic decisions are almost
by definition unprogrammable and are the domain of senior
managers responsible for the overall policy, strategic scope and
strategic direction of the enterprise. These decisions, which entail
very long-term perspectives on how the firm will develop are
almost by definition made in a context of uncertainty. They of
course have implications for the administrative and operating
decisions that flow from them. Operating decisions are typically
the province of middle managers. Although they refer to a time
period when relatively accurate assumptions can be made about
the product and factor markets in which the firm operates, they
are subject to unpredictable fluctuations, e.g., in the behavior
of competitors, which necessitate one-off tactical decisions. The
temporal horizons of such decisions may vary from the immediate
future to short market cycles.
Another way of looking at these decisions is that administrative
and to a large extent operating decisions have a pre-existing
framework of conceptualization and analysis within which they
can be resolved as they arise; in the case of genuinely strategic
decisions, it is necessary to construct such a framework cotermi-
nously with the initial decision process. It also has to be recog-
nized that once strategic decisions have been made and a suitable
decision framework established, the managerial work involved in
such decisions takes on an increasingly routine aspect. It is a myth
to think that strategic decision-making involves a root and branch
analysis of opportunities and capabilities with each planning
cycle: many strategic decisions are made recurrently with only
small changes in managerial outlook involved on each occasion.
This is of course, given the changing market, technological and
competitive environments that are the context of such decisions,
a source of danger if the firm fails to monitor its strategic space.
From the point of view of the organization, the overall object
with respect to decision-making will be to reach an acceptable
balance among administrative, operating, and strategic decision-
making so that each kind of decision is made in a timely manner
and coordinated with the taking of the other kinds of decision.
This state of affairs will ensure that conflict between short-term
and long-term organizational goals is minimized. Most analy-
ses of managerial decision-making take this purview. But the
social cognitive neuroscience approach to organizational behavior
makes it possible to discuss the tensions arising within individual
managers’ behavior patterns that makes them more or less suited
to undertake the decision tasks we have identified. This does not
of course mean anything so simplistic as that there are some
managers who are predisposed by their limbic systems to make
programmed decisions while others have a propensity to make
strategic decisions because of their advanced executive functions
(EFs). But what the explanation of managerial behavior in terms
of the CNBDS hypothesis (Bickel et al., 2012b) has in common
with work on extreme behaviors like addiction, etc., is a will-
ingness to embrace the idea that managers’ activities reflect the
degree of balance shown by their impulsive and executive systems
especially when hypoactivity of the latter permits hyperactivity of
the former. It is to this hypothesis that we now turn.
COMPETING NEURO-BEHAVIORAL DECISION SYSTEMS
The neuroscientific and especially the neuroeconomic account of
managerial behavior in organizations has often concentrated on
such matters as trust (Zak, 2004, 2007; Zak and Nadler, 2010),
cooperation and conflict (Levine, 2007; Tabibnia and Lieberman,
2007), reward processing (Wargo et al., 2010b); and social inter-
action (Caldú and Dreher, 2007). All of these have some bearing
on the kinds of functional and dysfunctional behavior with which
we are concerned.
However, this paper seeks an additional explanation for these
behaviors in the competing impulsive and executive decision
systems associated with the operations of separate, though related,
brain regions in the context of corporate problem solving. These
neural areas are also associated with differences of temporal
horizon, emotional response to circumstances and the cognitive
control of behavior. Much of the work inspired by the CNBDS
hypothesis involves addictive behavior, influenced by activity
located at the impulsive end of the neural spectrum, in contrast
to the more calculated behavior that is associated with the EFs,
located towards the other pole, which manifest in planning,
foresight and evaluation (Bickel et al., 2006, 2012b). Each neural
decision system generates its own rewards, relatively immediate
and strongly-emotional in the case of the impulsive system,
relatively long-term, considered and cognitive in the case of the
executive system (Moll and Grafman, 2011). Could it be that the
explanation of maladaptive and adaptive organizational decision-
making is to be found in the operation of these systems too?
The suspicion that CNBDS might be implicated in managers’
maladaptive behaviors is especially significant in the case of small
entrepreneurial businesses which rely largely on the endeavors
of a single prime-mover. That person’s tendency towards either
impulsiveness or self-control is likely to be a dominant influ-
ence on the effectiveness of the enterprise. A tendency towards
impulsiveness is likely to manifest in unplanned responses to
momentarily appearing opportunities which are implemented
without consideration of the long-term consequences for the firm.
Unless such instant reactions are constrained by the exercise of
EFs which engender planning, foresight, weighing of the relevant
consequences, the balance required to build and maintain a suc-
cessful organization is unlikely to be forthcoming. Conversely, an
exaggerated emphasis on strategic thinking and planning which
does not express itself in action to launch business ventures will
stymie enterprise. The possibility of imbalance arises in a different
manner in the large-scale organization. Large firms face similar
Frontiers in Human Neuroscience www.frontiersin.org April 2014 | Volume 8 | Article 184 |
80

Foxall Cognitive requirements of neurobehavioral decision theory
imperatives requiring the coordination of strategic planning and
operational decision-making but the coordination is considerably
more complex since different managers are responsible for these
tasks. Complications arise because managers charged with mak-
ing administrative and operational decisions may show cognitive
and managerial styles that are incompatible with those of man-
agers charged with strategic planning.
The clearest operational measure of balance/imbalance
between the neural systems is the extent of temporal discounting
apparent in the manager’s behavior (Bickel and Yi, 2008; see also
Baumesiter and Tierney, 2011). The organization-level goal of
achieving and maintaining balance among administrative deci-
sions which are predominantly programmed in Simon’s sense,
strategic decisions which are relatively unprogrammed, and oper-
ating decisions which are predominantly programmed, but some-
times contain unprogrammed elements, has to be accomplished
through managers who are typically responsible for a single kind
of decision but who bring a particular personal time horizon
to it. While the avoidance of conflict between short-term and
long-term objectives is an organizational goal, it is not necessarily
within the competence or interests of individual managers.
THE NEED FOR CONCEPTUAL CLARIFICATION
The CNBDS hypothesis per se has not previously been applied to
managerial concerns. However, the distinction it makes between
the functioning of an impulsive system based on the limbic
and paralimbic systems and an executive system based on the
prefrontal cortex (PFC), together with the possibility that an
imbalance between the operations of the two systems may lead
to dysfunctional behavior, is strongly represented in the emerging
literature of the neuroeconomics of organizations (e.g., Senior
and Butler, 2007a,b; Stanton et al., 2010). What we may refer to
as neuro-behavioral decision theory, which includes the CNBDS
hypothesis, other models such as the somatic marker hypothe-
sis (Damasio, 1994), and the application of similar thinking in
management (e.g., Wargo et al., 2010a), appears to be emerging
as a research paradigm within which to understand dysfunctional
behavior (Klein and D’Esposito, 2007; Michl and Taing, 2010).
The first purpose of this paper is to examine and suggest a
solution to a conceptual problem that arises in these analyses, a
solution which may have a bearing on the kinds of problem of
dysfunctional management mentioned above. Like the CNBDS
model itself, the discussion of competing neural systems in the
context of organizational management tends to conflate events
taking place at the neurophysiological level with the cognitive
processes ascribed in order to explain and interpret behavior.
We are often assured, for instance, that this part of the brain
“evaluates”, “plans”, or “decides”. These terms all describe cog-
nitive operations that belong at a level of exposition that refers
to the person as a whole rather than the sub-personal level of
neurobiology. Each level is properly described in its own language
that obeys particular rules and which points to a separate kind of
explanation. To draw this distinction between levels of exposition
is not to make ontological distinctions or to invite a dualistic
approach: it is simply to make clear that we must speak in quite
different ways of the rate of firing of neurons from those we
employ in speaking of the way in which a consumer evaluates
alternative brands. The argument is that while ontologically we
have nothing to work with but material events, in accounting
for behavior we need to maintain the distinction between what
is happening at the sub-personal level of exposition and how we
account for behavior at the personal level.
Part of the difficulty arises from a failure to delineate a cogni-
tive component of neuro-behavioral decision theory and to show
how it is related to the sub-personal level of neurophysiological
events and the super-personal level of behavioral reinforcement.
This paper proposes that Picoeconomics (Ainslie, 1992), which
analyses the interaction of motivational states that refer to com-
peting temporal horizons, provides the necessary cognitive level
of exposition. If this incorporation of picoeconomics as a cog-
nitive level of exposition for neuro-behavioral decision theory
is successful, it suggests a means of overcoming problems of
dysfunctional managerial behavior that are due to hyperactivity
of the impulsive system aided and abetted by hypoactivity of the
executive system.
THE NEED FOR MANAGERIAL APPLICATION
The kind of extreme decision-making involved in corporate
fraud or the reckless investing that brings whole economic
systems low is comparatively rare. In any case, while neuro-
physiological processes can explain the behavior of individual
participants in such dramas, the opportunity so to act and the
far-reaching consequences of such decision-making are likely to
be determined by structural factors and special events that lie
perhaps beyond the immediate purview, and certainly beyond
the control, of the decision-makers themselves (Bailey, 2007;
Yeats and Yeats, 2007). An important focus of this paper is on
understanding better the nature of decision-making by managers
who are, by comparison, involved in more day-to-day corporate
management.
The decisions that managers are required to make vary in
terms of the cognitive level they demand, including level of
intelligence and capacity to cope with complexity. They differ
also in terms of their paradigmatic context: at the extremes,
some decisions are solvable within the framework of assumption,
behavioral norms and market structure that has prevailed hith-
erto while others require that assumption, behaviors, structures
and other variables be reconceptualized and perhaps even re-
created. We cannot take all of these factors into consideration
but we can speak in terms of the decision styles of managers
which have a bearing on their likelihood of success in tackling
the various kinds of decision with which they are confronted.
Our task is to understand better the causal fabric of the environ-
ment within which managers operate (the “super-personal level
of exposition”) and the influence of neurophysiology on their
behaviors (the “sub-personal level”).
The paper next examines the CNBDS thesis in greater depth,
relating it as appropriate to managerial behavior and concerns
(Section Competing Decision Systems). This is a prelude to
its discussing the cognitive requirements of the model and
evaluate picoeconomics as its cognitive component (Section The
Cognitive Dimension). Once that is achieved, it is possible
to consider the application of the insights of picoeconomics
and adaption—innovation theory in addressing problems of
Frontiers in Human Neuroscience www.frontiersin.org April 2014 | Volume 8 | Article 184 |
81

Foxall Cognitive requirements of neurobehavioral decision theory
managerial dysfunction and the research agenda that emerge
from these approaches (Section Organization-Level Strategies for
Changing Managerial Behavior).
COMPETING DECISION SYSTEMS
OVERVIEW OF THE HYPOTHESIS
The CNBDS hypothesis rests on the somewhat simplifying
assumption that a “limbic system” can be coherently identi-
fied which is differentially implicated in emotional responding
and that a cortical area, differentially implicated in judgment,
planning and other cognitive activities, can also be identified.
Although the reality is undoubtedly more complicated than this—
neural activations are seldom exclusive to one part of the brain—
the dichotomy is retained here for ease of exposition with regard
to the CNBDS hypothesis and for the sake of continuity with a
wider literature (cf. however Lawrence and Calder (2004) with
Ross (2012)). Bickel’s hypothesis suggests that the degree of addic-
tiveness exhibited in behavior reflects the balance of activity in
these two broadly defined brain regions, the first of which, based
on the amygdala and ventral striatum, involves the distribution of
dopamine (DA) during reinforcement learning, while the second,
residing in the PFC, is implicated in the evaluation of rewards
and their outcomes (Walton et al., 2011; see also Dayan, 2012;
Symmonds and Dolan, 2012).
The impulsive system inheres in the amygdala and ventral stria-
tum, a midbrain region concerned with the valence of immediate
results of action, and is liable to become hyperactive as a result
of “exaggerated processing of the incentive value of substance-
related cues” (Bechara, 2005, p. 1459; see also Delgado and
Tricomi, 2011). Drug-induced behaviors correlate with enhanced
response in this region when the amygdala displays increased sen-
sitization to reward (London et al., 2000; Bickel and Yi, 2008). The
executive system, located in the PFC is normally associated with
planning and foresight but is hypothesized to become hypoactive
in the event of addiction; the absence of its moderating function
is responsible for the exacerbation of the effects of the hyperactive
dopaminergic reward pathway; this imbalance is then viewed as
the cause of dysfunctional behavior (Bickel et al., 2011b, 2013).
In summary, the CNBDS hypothesis posits that drug seeking
results from “amplified incentive value bestowed on drugs and
drug-related cues (via reward processing by the amygdala) and
impaired ability to inhibit behavior (due to frontal cortical dys-
function)” (Bickel and Yi, 2010, p. 2; see also Jentsch and Taylor,
1999; Rolls, 2009).
THE IMPULSIVE SYSTEM
Before considering the CNBDS hypothesis, it is useful to note
Damasio’s (1994) somatic marker hypothesis which bases a model
of decision-making systems on similar neurophysiological foun-
dations but emphasizes the role of emotion and feelings, down-
playing economic considerations. Decision-making reflects the
marker signals laid down in bioregulatory systems by conscious
and non-conscious emotion and feeling; hence, Bechara and
Damasio (2005; see also Bechara et al., 2000) argue that in
dealing with decision-making economic theory ignores emotion.
Economics is exclusively concerned with “rational Bayesian max-
imization of expected utility, as if humans were equipped with
unlimited knowledge, time, and information processing power”.
They point, by contrast, to neural evidence which shows that
“sound and rational” decision-making requires antecedent accu-
rate emotional processing (Bechara and Damasio, 2005, p. 336;
see also Phelps and Sokol-Hessner, 2012).
Damasio’s (1994) hypothesis is the outcome of brain lesion
studies in which damage to the ventromedial prefrontal cortex
(vmPFC) was found to be associated with behaving in ways that
were personally harmful, especially insofar as they contributed to
injury to the social and financial status of the individual and to
their social relationships. Although many aspects of these patients’
intellectual functioning such as long-term memory were unim-
paired, they were notably disadvantaged with respect to learning
from experience and responding appropriately to emotional sit-
uations. Moreover, their general emotional level was described
as “flat”. Damasio’s observation on these findings was that “the
primary dysfunction of patients with vmPFC damage was an
inability to use emotions in decision making, particularly decision
making in the personal, financial and moral realms” (Naqvi et al.,
2006, p. 261). Thus was born the central assumption of the
somatic marker hypothesis that “emotions play a role in guiding
decisions, especially in situations in which the outcomes of one’s
choices, in terms of reward and punishment, are uncertain” (ib.;
see also Bechara, 2011). Of relevance here is the finding that
the vmPFC may be implicated in activity of the parasympathetic
nervous system (PNS), which in contrast to the sympathetic
nervous system (SNS) is involved in the explorative monitoring
of the environment and the discovery of novelty (Eisenberger and
Cole, 2012). This is corroborative of both Damasio’s view and the
nature and behavior of the innovative manager discussed below.
Inherent in the somatic marker hypothesis is the attempt to
describe not only the separate functions of the brain regions
involved in emotional processing but also the interconnections
between them (Haber, 2009). The starting point is operant
behavior, particularly the mechanisms of reinforcement learning
(Daw, 2013; Daw and Tobler, 2013). Specific behaviors even-
tuate in rewards as a result of which the amygdala triggers
emotional/bodily states. These states are then associated via a
learning process to the behaviors that brought them about by
means of mental representations. As each behavioral alternative is
subsequently deliberated upon in the course of decision-making,
the somatic state corresponding to it is re-enacted by the vmPFC.
After being brought to mind in the course of decision-making the
somatic states are represented in the brain by sensory processes in
two ways. First, emotional states are related to cortical activation
(e.g., insular cortex) in the form of conscious “gut feelings” of
desire or aversion that are mentally attributed to the behavioral
options as they are considered. Secondly, there is an unconscious
mapping of the somatic states at the subcortical level—e.g., in the
mesolimbic dopaminergic system; in this case, individuals choose
the more beneficial option without knowingly feeling the desire
for it or the aversiveness of a less beneficial alternative (Ross et al.,
2008; see also Di Chiara, 2002; Robbins and Everitt, 2002; Tobler
and Kobayashi, 2009).
The rapidity with which the impulsive system acts in pro-
pelling behavior is underlined by Rolls’s (2005) theory of emotion
in which the reinforcing stimuli consequent on a behavioral act as
Frontiers in Human Neuroscience www.frontiersin.org April 2014 | Volume 8 | Article 184 |
82

Foxall Cognitive requirements of neurobehavioral decision theory
conditioned stimuli that elicit emotion feelings. The automaticity
of this interaction of operant and Pavlovian conditioning may
account for behavior in two ways. The emotion feeling may
function as an internal discriminative stimulus to increase the
probability of the behavior that produced it being reprised; it
is equally likely that the emotion feeling is the ultimate reward
of the behavior in question and that, by definition, it performs
a reinforcing role (Foxall, 2011). Either way, the effects of basic
emotions on subsequent responding is immediate and uninflu-
enced by reflection at the cognitive level. While the criticism
of economics shown by the authors of the somatic marker
hypothesis appears to rule an economic orientation out of their
purview, the CNBDS approach actively builds on insights from
operant behavioral economics (Bickel et al., 1999, 2010, 2011a,b;
Bickel and Vuchinich, 2000; Bickel and Marsch, 2001; Bickel and
Johnson, 2003).
While the somatic marker hypothesis relied in its inaugural
stages on lesion studies, the central research technique of cognitive
neuropsychology, the work of Rolls (2005) offers confirmation of
the role of operant behavior in the emerging paradigm. Recording
single neurons’ activity levels, Rolls (2005, 2008) reports that
vmPFC neurons respond to the receipt of primary reinforcers
such as pleasant-tasting foods. The integrity of the condition-
ing paradigm is evinced by the finding that devaluation of the
reinforcer, for example through satiety, reduced the responses of
such areas to these primary reinforcers. fMRI studies also offer
corroboration. Gottfried et al. (2003) report that when a predicted
primary reinforcer is devalued then vmPFC activity engendered
by that reinforcer is reduced. Hence, the vmPFC contributes to the
prediction of the reward values of alternative behaviors by refer-
ence to their capacity to generate rewarding consequences in prior
occasions. Schoenbaum et al. (2003) used lesion and physiological
studies to show that this capacity to encode predictive reward value
depends on an intact amygdala.
The CNBDS model differs in emphasis from Damasio’s
somatic marker hypothesis. Their underlying similarity inheres
in an acknowledgement that separate functions are performed
within the overall impulsive-executive system. But Bickel draws
attention to the interconnected operations of the impulsive system
and the executive system in the production of behavior (Bickel
et al., 2007). The CNBDS hypothesis is open, moreover, to the
incorporation of economic analysis in the form of behavioral
economics and neuroeconomics (Bickel et al., 2011a). Impulsive
action, defined as the choice of a smaller but sooner reward (SSR)
over a larger but later reward (LLR), is certainly associated with
the over- activation of the older limbic and paralimbic areas, while
the valuation and planning of future events and outcomes engages
the relatively new (in evolutionary terms) PFC. However, it is the
interaction of these areas, which are densely inter-meshed, that
generates overt behaviors. The CNBDS hypothesis thus stresses
the continuity of the components of the neurophysiologically-
based decision system and Bickel’s conception is therefore one of
a continuum on which the impulsive and executive systems are
arrayed theoretically as polar opponents (Porcelli and Delgado,
2009).
Specifically, Bickel et al. (2012a) identify, in addition to
trait impulsivity, four kinds of state impulsivity: behavioral
disinhibition, attentional deficit impulsivity, reflection
impulsivity and impulsive choice. Trait impulsivity is associated
with mesolimbic OFC and correlates with medial PFC,
pregenual anterior cingulate cortex (ACC) and ventrolateral PFC;
venturesomeness (sensation-seeking) correlates with right lateral
orbitofrontal cortex, subgenual anterior cingualate cortex, and
left caudate nucleus activations. The concept of trait impulsivity
recognizes behavioral regularities that are cross-situationally
resilient. Within this broad construct, sensation-seeking or
venturesomeness is widely known to be related to a need to reach
an optimum stimulation level. Bickel et al. (2012a) associate
it with sensitivity to reinforcement, the theory of which has
been extensively developed by Corr (2008b) and is discussed in
greater detail below. Of the four state impulsivities discussed by
Bickel et al. (2012a), behavioral disinhibition is associated with
deficiencies in the anterior cingulate and prefrontal cortices,
attentional deficit impulsivity with impairments of caudate
nuclei, ACC, and parietal cortical structures, and with strong
activity in insular cortex; reflection impulsivity with impaired
frontal lobe function; and impulsive choice with increased
activation in limbic and paralimbic regions in the course of the
selection of immediate rewards.
This latter is again strongly predicted by RST (McNaughton
and Corr, 2008). It is debatable whether the state impulsivities
mentioned here are anything other than the behavioral man-
ifestations of trait impulsivity in particular contexts. The four
state impulsivities that Bickel et al. (2012a) note are probably
outcomes of a general tendency to act impulsively from which
they are predictable. Behavioral disinhibition is the inability to
arrest a pattern of behavior once it has started; it is also evinced in
acting prematurely with deleterious outcomes. Attentional deficit
impulsivity is failure to concentrate, to persevere with salient
stimuli. Again, the outcome is the adoption of risky behavioral
modes with poor consequences. Reflection impulsivity is failure to
gather sufficient information before deciding and acting; inability
to get an adequate measure of the situation leads to unrewarding
behaviors. Impulsive choice is a behavioral preference for a SSR
over a LLR for which the individual must wait. All of these state
impulsivities are actually behaviors, the outcomes of trait impul-
sivity. More relevant to the present discussion is preference reversal
in which a longer-term, more advantageous goal is preferred (e.g.,
verbally) at the outset only to decline dramatically in relative value
as the delivery of the earlier less advantageous reward becomes
imminent.
THE EXECUTIVE SYSTEM
Bickel et al. (2012a) define EFs as “behavior that is self-directed
toward altering future outcomes” (p. 363; see also Barkley, 2012)
and point out that EFs are consensually associated with activity
in the PFC. PFC is generally recognized as implicated in the
integration of motivational information and subsequent decision-
making (Wantanabe, 2009), exerting a supervisory function that
governs the regulation of behavior (Bickel et al., 2012a); hence,
Bickel et al. (2012a) point out, its designation as a supervisory
attentional system (SAS; Shallice and Cooper, 2011).
While some authors emphasize a single element of EFs such
as the attentional control of behavior or working memory or
Frontiers in Human Neuroscience www.frontiersin.org April 2014 | Volume 8 | Article 184 |
83

Foxall Cognitive requirements of neurobehavioral decision theory
inhibition, others stress groups of elements: planning, working
memory, attentional shifting or valuing future events, emo-
tional aspects of decision-making. Addiction can then be viewed
as a breakdown in the operations of the EFs or as impaired
response inhibition leading to the increased salience of addiction-
orientated cues. Bickel et al. (2012a) concentrate on Attention,
Behavioral flexibility, Planning, Working memory, Emotional
activation and self regulation (EASR) which they group into three
major categories: (1) the cross-temporal organization of behavior
(CTOB) which is concerned with the awareness of the future con-
sequences of current or contemplated behavior and therefore with
planning for events that will occur later; (2) EASR which involves
the processing of emotion-related information and “initiating
and maintaining goal-related responding”; and (3) metacognition
which includes social cognition and insight, empathy, and theory
of mind (ToM).
The CTOB comprises attention (closely related to dorsolat-
eral prefrontal cortex (DLPFC), behavioral flexibility (frontal
gyrus activity; lesioning of PFC is well-known to be associated
with the diminution of behavioral flexibility (Damasio, 1994;
Bechara, 2011), behavioral inhibition (right inferior frontal cortex
and insula are activated during behavioral inhibition which is
also associated with reduced activity in left DLPFC, the right
frontal gyrus, right medial gyrus, left cingulate, left putamen,
medial temporal, and inferior parietal cortex), planning (in which
DLPFC the VMPFC, parietal cortex, and striatum are implicated),
valuing future events (in the case of previewing and selecting
immediate rewards: limbic and paralimbic regions; in the case
of long-term decisions: prefrontal regions; see McClure et al.,
2004); and working memory (DLPFC, VMPFC, dorsal cingulate,
frontal poles, medial inferior parietal cortex, frontal gyrus, medial
frontal gyrus, and precentral gyrus; Bickel et al., 2012a, pp. 363–
367).
EASR concerned with the management of emotional responses
is implemented in Medial PFC, lateral PFC, ACC, OFC. Metacog-
nitive processes (MP) involve recognition of one’s own motivation
and that of others which is implemented in the case of insight
or self-awareness by the insula and ACC, and in the case of
social cognition by medial PFC, right superior temporal gyrus,
left temporal parietal junction, left somatosensory cortex, right
DLPFC; moreover, impaired social cognition follows lesions to
VMPFC (Damasio, 1994; Bechara, 2005; Bickel et al., 2012a, pp.
367–368).
REINFORCEMENT SENSITIVITY AND PERSONALITY
RST (Gray, 1982; Corr, 2008b; Smillie, 2008) includes the excita-
tory (impulsivity) and inhibition (executive) components of the
CNBDS model but also permits us to make extensions relating
to the expected behavior patterns that follow from each and
the way in which individual differences can be summed up
in terms of an ascription of personality types.
1
RST proposes
that the basic behavioral processes of approach and avoidance
are differentially associated with reinforcement and punishment
1
There are several versions of RST. The present paper makes use of the
fundamental elements of the version of the theory developed by Gray and
McNaughton (2000), McNaughton and Corr (2004) and Corr (2008a).
and that individuals show variations in their sensitivity to these
stimuli.
2
Approach is behavior under the control of positively reinforc-
ing or appetitive stimuli and is mediated by neurophysiologi-
cal reward circuitry that the theory categorizes as a Behavioral
Approach System or BAS. The BAS consists in the basal ganglia,
especially in the mesolimbic dopaminergic system that projects
from the ventral tegmental area (VTA) to the ventral striatum
(notably the nucleus accumbens) and mesocortical DA PFC
(Smillie, 2008; cf. Pickering and Smillie, 2008). For recent dis-
cussion of the role of the striatum in decision-making and the
processing of rewards, see Delgado and Tricomi (2011). Recent
research demonstrating the role of this dopaminergic system in
formulating “reward prediction errors” is consonant with this
understanding. Unpredicted reward is followed by increase in
phasic dopaminergic activity whereas unpredicted non-reward is
followed by a decrease and unchanged when reward is entirely
predicted (Schultz, 2000, 2002; Schultz and Dickinson, 2000;
Schultz et al., 2008). Unpredicted reward instantiates the activity
of the BAS, therefore, and predicted reward maintains its opera-
tion. Moreover, BAS activity increases positive reward (pleasure)
and motivates approach to reinforcing stimuli and stimuli that
predict reinforcement. Such approach is characteristic of the
extraverted personality; Corr (2008b, p. 10) sums up the person-
ality type as “optimism, reward-orientation and impulsivity” and
notes that it maps clinically on to addictive behaviors.
These emotional and motivational outcomes represent one
pole of a continuum of individual differences that manifest dif-
ferential BAS and Behavioral Inhibition System (BIS) reactions to
stimuli. There is a corresponding though antithetical explanation
of avoidance in RST. Avoidance is shaped by sensitivity to stimuli
of punishment and threat and mediated by two bio-behaviorally
based systems of emotion and motivation. The first of these, the
Fight-Flight-Freeze system (FFFS), is triggered by aversive stimuli
and the resulting feeling of fear, what Corr (2008b, p. 10) refers
to as the “get me out of here emotion”; the FFFS’s motivational
output is a behavior pattern characterized as “defensive avoid-
ance”. However, if the consequential stimuli involved are mixed in
terms of their emotional valence then the BIS, which is involved
generally in the resolution of goal-conflict is activated; in this
case, the emotional output is anxiety, the “watch out for danger”
emotion Corr (2008b, p. 11) and the behavioral outputs are risk
evaluation and cautiousness which are described as manifesting
defensive approach. Hence, in summary, reward sensitivity leads
to positive emotion and approach and a response pattern that
is characterized as “extraversion” via behavioral observation or
psychometric testing; by contrast, punishment sensitivity leads to
2
RST uses the term “reinforcement” to include both rewarding and punishing
stimuli. This usage can be confusing in view of the confinement of “reinforce-
ment” to instances in which consequential stimuli strengthen (i.e., increase)
the rate at which a response is emitted and “punishment” to instances in which
consequential stimuli reduce that rate, a usage common in behavior analysis in
terms of which the CNBDS hypothesis is generally formulated. I have therefore
tried to use “reinforcement” and “punishment” consistently in their behavior
analytical definitions. However, it is not always possible to do justice to RST
by adhering to this rule and on occasion I have used “reward” rather than
“reinforcement” where this is clearer.
Frontiers in Human Neuroscience www.frontiersin.org April 2014 | Volume 8 | Article 184 |
84

Foxall Cognitive requirements of neurobehavioral decision theory
negative emotion and avoidance and a personality characterized
in terms of neuroticism (Smillie, 2008).
RST also relates the FFFS and BIS to specific neurophysiolog-
ical systems. In the case of the FFFS this is the periaquedital gray,
which is implicated in acute or proximal threat, and the medial
hypothalamus, amygdala and interia cingulate cortex, implicated
in distal threats. The BIS comprises the septo-hippocampal system
and the amygdala. The emotional output of the FFFS is fearfulness
while that of the BIS is anxiety. In either case, the emotional
outputs are negative and most forms of RST relate this to neuroti-
cism. The value of employing explanatory constructs referring to
personality types such as extraversion and neuroticism is that they
summaries individual differences in reinforcement sensitivity,
adding both to the interpretation of behavior and to its prediction
in novel environments.
MANAGERIAL BEHAVIOR RECONSIDERED: THE INFLUENCE OF
TEMPORAL HORIZON
Dysfunctional behaviors are those dominated by either the impul-
sive system or the executive system. The impulsive system evolved
because it was evolutionarily-adaptive as far as inclusive fitness
was concerned. Its preoccupation with short-term goals and its
immediate response to opportunities ensured its contribution to
survival of the individual and thereby to its biological fitness. It
is closely related to the kinds of modular functioning posited by
Fodor (1983) which allows rapid responses to environmental con-
cerns. It is closely related also to the emotion-feelings associated
with such response capacity, pleasure in particular but also arousal
and dominance. These are the ultimate rewards of instrumentally
conditioned behavior (Rolls, 2008; Foxall, 2011).
When we speak of the dysfunctional consequences of a hyper-
active impulsive system in seeking to understand and explain a
manager’s behavioral repertoire we are referring to hyperactivity
in these emotional-reward systems which leads, for instance, to
preoccupation with short-term goals at the expense of under-
taking longer-term planning, the reckless taking of investment
decisions promising rapid high returns and a consequent over-
cautiousness, and an unwillingness to invest in future. Another
manifestation is rigidity in the pursuit of a previously selected goal
even though the environment has changed and flexibility is called
for. We are also suggesting that it is unlikely that this impulsive-
hyperactivity occurs in isolation from hypoactivity of the exec-
utive system. Hence, imbalance occurs because managers place
disproportionate importance on the emotional highs resulting
from activities that result in immediate or near-immediate rein-
forcement at the expense of the pursuit of considered action that
would be under the control of the executive system. Moreover,
both utilitarian reinforcement and informational reinforcement
are engendered which brings about high levels of pleasure and
arousal, and in a context that permits the emotion-feeling of high
dominance (Kringelbach, 2010; Foxall, 2011). This is probably
the strongest combinations of interacting reinforcement for the
maintenance of managerial behavior. From the organization’s
point of view, if this behavioral style becomes characteristic of a
function, department or even of the firm as a whole, the outcome
will be an overconcentration on administrative and operational
activities at the expense of a strategic perspective which embraces
and anticipates the opportunities and threats of the changing
market-competitive environment.
However, dysfunctional behavior may also result from hypoac-
tivity of the impulsive system and hyperactivity of the execu-
tive system (Mojzisch and Schultz-Hardt, 2007). The intellectual
rewards of a preoccupation with long-term planning, obtaining
and analyzing information, mulling over strategic possibilities,
may lead to a lack of strategic implementation so that the short-
term decisions necessary for the day-to-day operations of the
firm are neglected, working capital is lacking, the firm cannot
continue. The pleasures and arousal resulting from cognitive
activity and the feeling of dominance that this provides can
manifest in organizational sclerosis which over-values intellectual
engagement with marker structures, competition and, especially,
the strategic scope of the organization. From the organization’s
viewpoint, if this behavioral style becomes widespread, there will
be an imbalance in favor of strategic planning and decision-
making at the expense of the day-to-day imperatives of the firm’s
response to the tactical behavior of competitors and the vagaries
of consumer choice. The executive system also evolved because it
favored biological fitness. Its operation is much like that of the
central cognitive function posited by Fodor (1983).
In view of the importance of avoiding a general tendency
towards either kind of imbalance in the behavior of the firm, it
might be argued that our unit of analysis should be the organi-
zation as a whole since it is presumably structural elements in
the organization’s culture that require attention if the problem
is to be overcome. This is undeniably correct but our present
objective is less to overcome problems of imbalance, which are
anyway the subject of innumerable management texts, and more
to understand how individual managers may be prone to one or
other behavioral style. The central factor involved in diagnosing
either extreme at the individual level is the temporal horizon
of the manager since this correlates highly with the influence of
the impulsive and/or executive systems. This is best considered,
however, after the way in which cognitive language is used in
neuro-behavioral decision theory, which brings further under-
standing of the role of temporal horizon in decision-making.
It also suggests a means of overcoming problems of impulsive-
hyperactivity and executive-hypoactivity at the individual level
which must be evaluated before an organization-level solution can
be proposed and appraised.
THE COGNITIVE DIMENSION
SPEAKING OF COGNITION
Neuroscience and behavioral science employ extensional lan-
guage, the third-personal mode which is taken as the hallmark of
science (Dennett, 1969). The truth value of extensional sentences
is preserved when co-designative terms are substituted for one
another. The phrase, “the fourth from the sun” can be substituted
for “Mars” in the sentence “That planet is Mars” without surren-
dering the truth value of the sentence. However, the truth value
of a sentence containing intentional language, such as “believes”,
“desires” or “feels”, is not maintained when co-designatives are
substituted. Given the sentence, “John believes that that planet
is Mars”, we are not at liberty to say, “John believes that planet
is the fourth from the sun”, since John may not know that Mars
Frontiers in Human Neuroscience www.frontiersin.org April 2014 | Volume 8 | Article 184 |
85

Foxall Cognitive requirements of neurobehavioral decision theory
is the fourth planet. Intentional sentences have another unique
property: the intensional inexistence of their subjects. The truth-
value of my saying “I am driving to Edinburgh this weekend”, an
extensionally-expressed statement, is established by there being
a place called Edinburgh to which I can travel. But if I say that
I am seeking the golden mountain, looking for the fountain of
youth or yearning for absolute truth, none of the entities named
in these intentional expressions need actually exist for the truth
value of the sentences to be upheld. Finally, it is not possible
to translate intentional sentences into extensional ones without
altering their meaning. Intentional sentences usually take the
form of an “attitude” or verb such as believes, desires or wants
followed by a proposition such as “that today is Tuesday” or
“that eggs are too expensive”; hence, such sentences are known
as “propositional attitudes” (Chisholm, 1957).
The proposed development of the CNBDS hypothesis involves
more than terminological clarification. The principles just
described govern not only linguistic usage but also the kinds of
theories we invoke in order to explain our subject matter and
care must be taken to ensure that each is confined to the level of
explanation or interpretation to which it is appropriate. Cognitive
terminology is intentional and belongs only at the level of the
person (Bennett and Hacker, 2003).
LEVELS OF EXPOSITION
Dennett (1969) distinguishes the sub-personal level of explanation,
that of “brains and neuronal functioning” from the personal level
of explanation, that of “people and minds”. The sub-personal level
thus entails a separate kind of scientific purview and approach to
explanation: by encompassing neuronal activity it is the domain
of the neuroscientist and leads to an extensional account. The
personal level which is the domain of mental phenomena is that
of the psychologist; it requires an intentional account. A third
level of explanation is required, however, in order to cover the
whole range of phenomena and sciences that deal with them
in a comprehensive approach to the explanation of behavior
(Foxall, 2004). This is the super-personal level of explanation which
encompasses operancy,
3
the respect in which the rate of behavior
is contingent upon its reinforcing and punishing consequences;
this is the field of extensional behavioral science.
Care is necessary to maintain the separation of these three
levels since the mode of explanation which each entails is unique
and cannot be combined with the others in a simple fashion.
The fundamental difference in mode of explanation which must
be constantly recognized is as follows. The sub- and super-
personal levels, which are based on the neuro- and behavioral-
sciences respectively, require the use of extensional language
and explanation. Both of which are in principle amenable to
experimental (“causal”) analysis, or failing this to the quasi-
causal analysis made possible by statistical inference. They differ
from one another in terms of the kind of stimuli and responses
(independent and dependent variables) that must be taken into
3
This neologism refers to the effect on behavior of environmental contingen-
cies of reinforcement and punishment. “Operancy”, which refers specifically
to the process of reinforcement and punishment of behavior, avoids the
theoretical notion of “conditioning” and is therefore more consistent with an
extensional portrayal.
consideration in empirical testing of the hypotheses to which
they give rise. They differ more fundamentally from the personal
level of explanation, which attracts a wholly different mode of
analysis, namely that of intentional psychology; the approach to
explanation in this case relies on the ascription of beliefs, desires
and feelings on the basis of non-causal criteria.
The proposed development of the CNBDS hypothesis involves
more than terminological clarification. The principles just
described govern not only linguistic usage but also the kinds of
theories we invoke in order to explain our subject matter and
care must be taken to ensure that each is confined to the level of
explanation or interpretation to which it is appropriate. Cognitive
terminology is intentional and belongs only at the level of the
person (Bennett and Hacker, 2003).
The critique of the CNBDS hypothesis takes the form therefore
of conceptual development. The CNBDS hypothesis is described
by Bickel and colleagues in neuroscientific, cognitive and behav-
ioral terms without regard to the domains of explanation to which
each of these categories belongs. For example, although they offer
what purports to be a behavioral definition of EF, they define
several of its component parts in terms that are cognitive. Follow-
ing Barkley (1997a,b), they define EF as “as behavior that is self-
directed toward altering future outcomes” (Bickel et al., 2012a,
p. 363), but they list among those of its elements which suggest
“CTOB”: attention, planning, valuing future events and working
memory. These clearly are or involve cognitive events. Similarly,
among the elements that make up “emotional and activation self-
regulation”, they list: “the processing of emotional information”
and “initiating and maintaining goal-related responding”. Finally,
as elements of “MP” they list: “social cognition” or “ToM” and
“insight”. Bickel et al. (2012a) define impulsivity behaviorally
in terms of actions prematurely performed that eventuate in
disadvantageous outcomes. They go on, however, to describe
impulsivity as consisting in the trait of impulsiveness, a structural
personality variable that incorporates sensation-seeking, deficits
in attention and reflection impulsivity which is an inability to
collect and evaluate information prior to taking a decision. All
of these are intensional.
COGNITIVE REQUIREMENTS OF NEURO-BEHAVIORAL DECISION
SYSTEMS
So far we have advocated that behavioral and neuroscientists
maintain the appropriate syntax in speaking of intentional con-
cepts such as beliefs and desires as opposed to extensional objects
such as neurons and behavior patterns. This means understanding
and maintaining the sub-personal, personal and super-personal
levels of exposition and employing only the appropriate language
at each level. A more satisfying outcome for neuro-behavioral
decision theory would be to incorporate a level of cognitive
exposition the content of which complemented the extensional
sciences we have discussed. This section sets out the criteria that
such an account should fulfill; the following section evaluates
picoeconomics (Ainslie, 1992) as that cognitive component.
There are four requirements of any candidate for the cognitive
component of neuro-behavioral decision theory. It must first be
capable of filling the need for a personal level account of the causes
of behavior. Second, it must provide an intentional explanation.
Frontiers in Human Neuroscience www.frontiersin.org April 2014 | Volume 8 | Article 184 |
86

Foxall Cognitive requirements of neurobehavioral decision theory
Third, it should be capable of linking to the behavioral economics
and neuroeconomics analyses that are found in the hypothesis.
And, finally, it must relate philosophically to broader disciplinary
concerns including neurophysiology and operancy.
A personal level theory
A cognitive account is required to provide understanding of the
ways in which individuals subjectively respond to the circum-
stances which influence their behavior towards rewards that may
have short-term benefits but which entail longer-term deleterious
consequences. Being able to characterize what individuals desire
and believe in these situations, what they perceive and how
they feel, provides an indication of their underlying disposition
to respond in a particular way to rewards and punishments
occurring at different times. This is of course a highly theoretical
enterprise; in order to avoid undue speculation and conjecture,
therefore, it is important that the cognitive requirements of
neuro-behavioral decision theory are provided by a coherent body
of knowledge relating personal level factors to situations that
promote consumption.
An intentional account
The required personal level exposition must indicate the particu-
lar intentional terms that are applicable to the explanation of nor-
mal and addictive behaviors within the framework of an overall
theory that can systematically relate the two antipodal behavior
patterns. It must also be capable of explaining how intentional
entities like beliefs and desires, perceptions and emotions would
act upon the impulsion towards fulfillment of immediate wants,
such as consumption of an addictive substance, in order to bring
about a more advantageous long-term result. This calls for a well-
worked out theory of human behavior over the continuum of
normal to addictive behaviors rather than an ad hoc application
of intentional language on the basis of rapid observation of an
individual’s behavior.
An integrative economic account
The CNBDS hypothesis relies heavily on operant behavioral eco-
nomics and neuroeconomics in order to explain the reinforcer
pathologies that underlie addictive patterns of behavior. It would
be advantageous, therefore, for the cognitive component of the
model to link to the basic exposition in economic terms. The
usefulness of the cognitive account might be questioned because
of its inherently theoretical nature; this objection can be overcome
if its explanation of behavior can be specified in language that
is consonant with the provisions of consumption in the face of
extremely high elasticity of demand and temporal discounting of
the consequences of behavior.
Relationship to basic disciplines
A broader relationship between the cognitive account of behav-
ior and the underlying neuroscience and behavioral science
that comprise the CNBDS hypothesis is necessary that goes
beyond economic integration. Although a major point of the
present argument is that cognitive accounts differ fundamen-
tally from those provided by the extensional sciences, the inten-
tional component must be consistent with what is known of the
neurophysiological basis of addiction and also with its relation-
ship to the reinforcers and punishers that follow behavior.
PICOECONOMICS: PREFERENCE REVERSAL AND INTERTEMPORAL
CONFLICT
Herrnstein’s (1997) matching law suggests that the value of a
reinforcer is inversely proportional to its delay, i.e., as the delay
becomes shorter, the value increases dramatically. This is the
essence of hyperbolic discounting. The key difference between
exponential and hyperbolic discounting is that in the former the
LLR is always preferable to the SSR, regardless of time elapsed,
whereas in the latter there is a period during which the SSR
is so highly valued (because the time remaining to its possible
realization is so short) that it is preferred to the LLR (Ainslie,
1992; Ainslie and Monterosso, 2003). This is clearly not because
of its objective value which is by definition less than that which
can be obtained through patience, but because the time remaining
to its possible realization is now so short, that it is preferred
to the later but larger reward. Ainslie notes that these findings
harmonize with Freud’s observations that an infant behaves as if
expecting immediate gratification but becomes, with experience,
willing to wait for the longer-term alternative. In other words,
still paraphrasing Freud, if the pleasure principle is resisted,
the outcome will be the exercise of the reality principle. In the
terminology of behavioral psychology, the operants relevant to
each of these principles are shaped by their respective outcomes.
Ainslie argues that the two principles can be represented as two
interests, each of which seems to employ devices that undermine
the other.
In discussing what these devices are, Ainslie (1992) gives a clue
as to how we may speak of the operations of mental mechanisms
and also how they are organized to produce phenomena in a
cognitive account, i.e., one that conforms to the use of cognitive
logic as we have defined it and to the strictures of grounded
modularity as they were developed above. His first device, for
instance, is precommitment, in which for instance one joins a
slimming club in order to be able to call upon social pressures
in order to reach long term goals. The very language of this
account indicates the relevance of the models of cognition we
have developed. The processes are unobservable, adopted in order
to make behavior intelligible once the extensional accounts of
behavioral and neuro-science have been exhausted. Secondly, the
interests may hide information from one another, e.g., about the
imminence of rewards. Thirdly, the emotions that control short-
term responding may be incapable of suppression once they are in
train or they may be foreshortened by long-term interests. Finally,
current choices may be used as predictors of the whole pattern of
behavior, consisting in a sequence of multiple behaviors belonging
to the same operant class, that the individual will engage in future.
An individual may, that is, see her present choice of a chocolate
éclair as indicative that she will make this selection repeatedly
and often in the future. Individual choices are thus perceived as
precedents. The resulting strategy is what Ainslie later described
as bundling, in which the outcomes of a series of future events are
seen cumulatively as giving rise to a single value. When this value,
rather than that of a single future event, is brought into collision
with the value of the single immediate choice, the long-term
Frontiers in Human Neuroscience www.frontiersin.org April 2014 | Volume 8 | Article 184 |
87

Foxall Cognitive requirements of neurobehavioral decision theory
interest is thereby strengthened (see also Baumeister and Vohs,
2003).
Subsequent behavior that serves the longer rather than the
shorter term interest is apparently rule governed rather than con-
tingency shaped (Skinner, 1969). However, the “rules” exist only
in the mind of the individual who may not have encountered the
contingencies. It is intellectually dishonest to refer to them as rules
in the sense proffered by radical behaviorists which require empir-
ical confirmation that the individual has previously encountered
similar contingencies or whose rule following behavior from
others of similar kind to the present has been reinforced. Since we
have no empirical, in particular, experimental indication of this
nature, we would more accurately refer to them as beliefs. Our use
of intentional language indicates the nature of our explanation or,
better perhaps, interpretation. Ainslie himself refers to bundling
as the basis of “personal rules” but we can have no this- personal
evidence of even the existence of such, let alone their efficacy.
Better to characterize our account as interpretation and make this
explicit by using intentional language.
In sum, Ainslie’s picoeconomics portrays the conflict between
a smaller reward that is available sooner and a larger reward
available later in terms of clashing intrapersonal interests. We can
now proceed to evaluate picoeconomics in terms of the criteria set
out above.
PICOECONOMICS AS THE REQUIRED COGNITIVE COMPONENT
A personal level account
Ainslie’s picoeconomics portrays the conflict between a smaller
reward that is available sooner and a larger reward available later
in terms of clashing intrapersonal interests. These are personal
level events because their purpose is to render intelligible the
behavior of an individual when it is no longer obvious how the
contingencies of reinforcement/punishment and his neurophysi-
ology are affecting his behavior. The behavior we are attempting
to understand is often a single instance of activity (we are taking
a molecular perspective) but the behavior which we employ to
generate and justify the intentional interpretation we have to
make is a pattern of behavior: here we are taking a molar stand-
point. There must also be a pattern of neurophysiological activity
which supports the strategic assumptions we are making about
the individual. In addition, the pattern of reinforcement (Foxall,
2013) is of crucial importance in interpreting his behavior. We are
ascribing interests and their effects in determining behavior but
we employ constructs in order to accomplish this that are unob-
servable posits: they cannot enter into an experimental analysis.
We use the molar behavior pattern, the pattern of reinforcement
and neurophysiology to underpin these strategic assumptions
and to justify our interpretation. The language of picoeconomics
consists therefore in strategic assumptions that derive from an
interpretation of the behavior and neurophysiology of the indi-
vidual. The strategic assumptions we make and the way we use
them must be consistent with the evolution of the species by
natural selection, the ontogenetic development of the individual’s
behavior through operancy, and the evolutionary psychology of
the prevalent behavior of the species. We need to show how the
behavioral sensitivity to patterns of reinforcement (which are the
subject of our studies of operancy and evolutionary psychology)
are in turn related to evolution by natural selection via synaptic
plasticity.
An intentional exposition
Picoeconomics accounts for behavior using intentional lan-
guage, specifically the cognitive language of decision-making
and problem-solving. In particular, as a theory of “the strategic
interaction of successive motivational states within the person”
(Ainslie, 1992), it is dynamically concerned with the inter-
nal weighing of information about the outcomes of alternative
courses of action and the motivational states they engender.
An economic account
Can the actions of the interests themselves be economically mod-
eled at the intentional level? Is Ainslie’s picoeconomics entirely
a cognitive theory or does it lend itself to microeconomic anal-
ysis? In fact, Ross (2012) puts forward an array of economic
models of the strategic interactions proposed by picoeconomics
among competing preferences. Analysis of behavior in terms of
the pattern of reinforcement it has previously resulted in draws
upon operant behavioral economics which is central to the CNBDS:
specifically, the analysis of discounting relates behavior to its
consequences, but operant behavioral economics also establishes
that individuals maximize utility and the particular combinations
of reinforcement that constitute utility.
Related to a broader disciplinary base
It is particularly important from the point of view of the research
program within which the current investigation is being per-
formed (see Foxall, 2007a) that the cognitive interpretation of
behavior, here picoeconomics, can be defended philosophically
in terms of the underlying behavioral and neuroscience (Foxall,
2004). This is clearly the case with picoeconomics (Foxall, 2007b).
Now that picoeconomics has been established as a cogni-
tive component for neuro-behavioral decision theory, its use-
fulness as a means of overcoming managerial dysfunction with
respect to temporal horizon can be evaluated. As Section
Organization-Level Strategies for Changing Managerial Behavior
indicates, the general thrust of picoeconomics is towards clini-
cal application that may not fit most managerial situations. In
that case, alternative approaches to management are discussed,
notably adaption-innovation theory, which are founded on sim-
ilar neurophysiological bases but which suggest more practicable
solutions.
ORGANIZATION-LEVEL STRATEGIES FOR CHANGING
MANAGERIAL BEHAVIOR
STRATEGIES OF CHANGE BASED ON PICOECONOMICS
An advantage of picoeconomics in the current context is that
it suggests means of overcoming the managerial problems likely
to arise when individual managers are strongly motivated by
the goals and behavioral patterns that reflect hyperactivity in
the impulsive system and hypoactivity in the executive system.
Ainslie (1992) proposes a number of strategies through which
the individual might overcome the temporal discounting that
is the hallmark of this tendency. It is here that RST underpins
the current analysis by providing neurophysiological systems that
Frontiers in Human Neuroscience www.frontiersin.org April 2014 | Volume 8 | Article 184 |
88

Foxall Cognitive requirements of neurobehavioral decision theory
underlie not only the more extreme impulsive—approach ten-
dency (BAS) the fear—engendered escape—avoidance tendency
(FFFS), but the goal-resolving tendency that seeks to reconcile the
alternative courses of action (BIS). The strategies of self-control
suggested by Ainslie can be seen as attempts to aid the BIS in its
attempts at conflict-resolution.
Ainslie (1992) proposes four personal strategies, allusion to
some of which was made above, by which the individual might
make a larger, albeit longer-term, outcome more probable: pre-
commitment, control of attention, preparation of emotion and
reward bundling. Precommitment involves using external com-
mitments to preclude the irrational choice. The individual seeks
to manipulate the external environment in order to make behav-
ior leading to the LLR more likely. Ulysses lashed himself to the
mast before temptations arose. But precommitment need not
be so dramatic. An addict may imbibe a substance that induces
nausea when alcohol is drunk. A student might arrange for
friends to take her to the library before a favorite TV program
begins. Control of attention restricts information processing with
respect to the SSR. For example, taking a route home from the
office that avoids bars or fast-food restaurants; thinking about the
car one can buy if you eliminate cigarette smoking. Preparation
of emotion may take the form of inhibiting emotions that are
customarily connected with the SSR or of increasing incompatible
emotions. Hence, graphically recalling the health risks of over-
eating, smoking or excessive alcohol consumption, thinking of the
displeasure others will show, engage cognitive reasoning in order
to eliminate the emotional anticipation that customarily lead to
consumption.
Perhaps the principal strategy, reward bundling requires the
individual to make personal rules about the perception of the
smaller-sooner and larger-later choices available. Instead of imag-
ining the present choice and its exciting outcomes (drinking
alcohol to excess) as opposed to a single somewhat amorphous
outcome of sobriety (“longer life”), reward bundling involves
bring a whole sequence of larger- later rewards to oppose rewards
of the immediately-available behavior. In the absence of such
bundling, the individual is likely to undergo repeated preference
reversals but viewing the choice as between two streams of behav-
iors and outcomes makes self-control more possible. Self-control
results from perceiving a single choice between an aggregation
of LLRs and a competing aggregation of SSRs. The sum of the
LLRs is always greater than that of the SSRs. Decision making is
then a matter of imaginatively bringing the LLRs forward in time
to the present. The personal rules necessary to ensure this self-
control take the form of private “side-bets” in which the current
choice predicts future choices. The important point in viewing
the reward sequences in this way is that the LLR is at all times
superior to the SSR even when an SSR is immediately available:
preference reversal is therefore not predictable. The rule is a side
bet that the current choice will predict future choices. If the SSR
is resisted, the bet is won: the expectation of future reward is thus
enhanced and the individual’s probability of success in resisting
temptation is increased. Selection of the SSR indicates that the
individual has lost the bet, however: the individual’s self-image
is weakened, along with his or her expectation of resisting the
temptation in the future.
The relevance of these strategies to managerial decision-
making of the kind we have been discussing is evident though
it is unclear whether a manager would be able to recognize and
change his or her behavior in the absence of detailed one-on-one
counseling. While this methodology obviously has applications
in therapeutic contexts, and Ainslie’s prescriptions fit well the
needs of substance and behavioral addicts, an application that is
more attuned to the social-structural demands of organizational
management is called for in the context with which we are here
concerned.
ADAPTION-INNOVATION THEORY
There exists an alternative approach to managerial application
of the neuropsychological work that has been reviewed in this
paper, though the following comments are indicative and call
for a dedicated research program. Adaption-innovation theory
(Kirton, 2003) suggests a means of structuring decision-making
groups that reflects competing neuro-behavioral systems and so
avoids reliance on an individual-level prescription for manage-
rial behavior. “Cognitive style” refers to a person’s persistent
preferred manner of making decisions, the characteristic way
in which they approach problems, information gathering and
processing, and the kinds of solution they are likely to work
towards and attempt to implement. As such, it is orthogonal
to cognitive level, that is intelligence or capacity. Kirton (2003)
proposes that individuals’ cognitive styles can be arrayed on
a continuum from those that predispose “doing better” (the
adaptive pole) to those that predispose “doing differently” (the
innovative pole). Adaption-innovation is measured by the Kirton
Adaption-Innovation Inventory (KAI) which evinces high levels
of reliability and validity and scores correlate with a number of
personality variables including extraversion and impulsivity. Gen-
eral population samples indicate that trait adaption-innovation
is approximately normally distributed and general population
scores, including of course those of managers, are arrayed over
a limited continuum which falls within the theoretical spectrum
of scores posited by adaption-innovation theory. In line with
the purview of this paper, therefore, the managers of whom we
speak are not extreme in their behaviors, though they some of
them may exhibit scores towards the extremes of the bipolar
construct of adaption-innovation. The behavior of the extreme
adaptor is generally characterized by a tendency towards caution
in decision-making and problem-solving, use of tried-and-tested
methods, efficiency, rule-conformity and limited quantitative cre-
ativity manifesting in the generation of relatively few, workable
solutions. The extreme innovator is, in contrast, more outlandish
in selecting decisions, more likely to propose novel solutions to
problems (many of which are impracticable), less efficient and
more likely to modify or even break the rules. Although extraver-
sion (measured, for example, by Eysenck’s E scale) emerges as
more highly correlated with adaption-innovation (measured in
the direction of the innovativeness pole), little is known about
the underlying personality profiles of adaptive and innovative
decision-makers in relation to the contingencies of reinforcement
that shape and maintain their preferred behavioral styles. RST
(Gray and McNaughton, 2000; McNaughton and Corr, 2004;
Corr, 2008a) offers a means of investigating the personality
Frontiers in Human Neuroscience www.frontiersin.org April 2014 | Volume 8 | Article 184 |
89

Foxall Cognitive requirements of neurobehavioral decision theory
profiles of decision-makers and the role of reward and punish-
ment in their development and maintenance. This all suggests that
a psychometric research program concerned with the integration
of a number of fields could provide indicators for the prescription
to the problems of extreme managerial style. The program would
need to encompass the neurophysiology of cognition together
with the psychometric measurement of personality dimensions
that underlie cognitive style. Enough has been said to indicate
that we understand these fields and their interactions sufficiently
to embark on such a program. In the meantime, the following
remarks are indicative of the work that needs to be undertaken.
RECOGNIZING INDIVIDUAL DIFFERENCES IN TEAM-BUILDING
In contradistinction to innovators, adapters are typically prudent,
using tried and tested methods, cautious, apparently impervious
to boredom and unwilling to bend, let alone break, the rules.
They seek the kind of efficiency that manifests in accomplishing
known tasks more effectively. An extremely adaptive cognitive
style suggests hyperactivity of the executive system coupled with
hypoactivity of the impulsive system. Moreover, those aspects
of the executive system that involve ToM, the observation of
social conventions, meta-cognition, and some facets of behavioral
flexibility might be adaptor characteristics that would confirm
this categorization. The tentative conclusion is that adaptors
would cope well and perform advantageously when involved in
the intellectual, long-term, detailed thinking that strategic plan-
ning requires. The downside to their over-involvement in this
kind of decision-making derives from the demands that strategic
planning and commitment sometimes exert upon the ability to
undertake “outside-the-paradigm” thinking. Such demands are
likely to be, relatively, occasional but they are equally likely to arise
at times of crisis in the market and competitive environments of
firms and to benefit most from the kind of thinking which char-
acterizes a more innovative cognitive style. In contradistinction
to adaptors, innovators typically proliferate ideas that require the
relatively radical change that can modify strategic direction, the
product-market scope of the firm, and possibly diversification.
At its extreme however, this cognitive style, suggests hypoactivity
of the executive system, hyperactivity of the impulsive system.
The impulsive system is geared to the rapid identification and
evaluation of opportunities and threats, the capacity to envis-
age far-reaching, possibly disruptive, change which, in refocus-
ing the entire strategic scope of the enterprise carries with it
upheaval in working practices and both the working and non-
working lives of managers and other employees. To the extent
that these are innovator-traits, it is clear that decision groups
need to be balanced by adaptors who can supply the capacity for
sounder decision-making and the facilitators who can explain to
innovators the rationale behind the behavior of adaptors, who
are otherwise likely to be seen as too slow-moving to respond
appropriately to the crisis, and to adaptors that which underpins
the behavior of innovators who would otherwise be perceived
as too outlandish to preserve the values of the organization.
Innovators supply strengths in organizational decision-making:
they are more likely to think outside the paradigm within which
a problem has arisen, unconfined by the tried and tested methods
currently in place, and to take risks. These are all relevant when
the organization faces grave uncertainties and requires radical
strategic reorganization. But innovators may be unsuited to more
short-term decision-making which requires the skills of prudence
and caution which are the hallmark of the adapter.
Normally, strategic thinking and planning require the adven-
turous outlook of the innovator, tempered by the prudence of the
adapter. But, without top management vigilance and the planning
of the teams that participate in decision-making, it might well
attract a preponderance of extreme adapters. If this cognitive
style dominates the strategic function, there is likely to be a
dysfunctional emphasis on the planning of strategy at the expense
of the taking of strategic decisions and the implementation of
appropriate policies at the operational and administrative levels.
Insofar as strategic decisions are unprogrammed, they therefore
require the inputs of innovators. So a prolonged predominance
of adapters in this role will lead to organizational imbalance.
Normally, operational (and administrative) functions require
the efficient involvement of the adapter, tempered by the more
outward-looking tendency of the innovator. But, again without
top management vigilance, they might attract the extreme inno-
vator who seeks to take risks for short-term benefits. This will
interfere with the strategic management of the enterprise and
could jeopardize the overall operation of the firm.
LEVEL, STYLE AND STRUCTURE
“Strategic” decisions do not necessarily arise at a managerial level
that is automatically higher than that of any other kind of deci-
sion, nor do strategic decisions inherently involve the breaking
of paradigms, and innovativeness. Just because strategy involves
long-range planning does not preclude its occurring within a
paradigm, albeit of grand scope, that is nevertheless known
and generally-accepted; equally, the innovativeness of eroding
boundaries between small-scale organizational systems should
not be automatically diminished (Jablokow, 2005). Adaptive
and innovative styles of cognition and creativity are constantly
required, alongside one another, in the solving of problems.
That which predominates appropriately in any given situation
depends entirely on the specific context. Organizational problems
arise when current strategies no longer fit the demands of the
organizational environment: when markets, reflecting demand
and competition, are no longer adequately served by the norms
of organizational behavior (Jablokow and Kirton, 2009). Such
changing circumstances have two vital components. The first
is the changing environment must be perceived as involving
precipitating events, i.e., the need for change by the organization’s
leaders; it is adaptors rather than innovators who are more adept
at detecting unforeseen developments that require managerial
action. The second is the exploitation of the opportunities such
external change is prompting, or the defensive action needed to
avoid the threats that the environment contains; these tasks of
advancing the required action are more likely taken effectively
by the more innovative (Tubbs et al., 2012). This is a matter of
cognitive style, not of cognitive or decision level.
This point is summarized by the “paradox of structure”
(Kirton, 2003, pp. 126–134): while people require structure what-
ever their cognitive style, but that structure is ultimately stultify-
ing as persons, organizations and environments exhibit dynamic
Frontiers in Human Neuroscience www.frontiersin.org April 2014 | Volume 8 | Article 184 |
90

Foxall Cognitive requirements of neurobehavioral decision theory
behaviors. All the more reason for founding managerial teams and
behavior patterns on the contributions of all cognitive styles.
NEUROPHYSIOLOGICAL BASIS OF ADAPTION—INNOVATION
van der Molen (1994) notes on the basis of evolutionary logic
that social animals are motivated by two counterposed tendencies:
first, to find satisfaction in the company of conspecifics which
requires a degree of cooperation and conformity; secondly, to
compete with conspecifics for limited resources, such as food,
sexual partners, and territory, on which individual survival and
biological fitness rely. The personality characteristics which reflect
these motivational forces are, in turn, “strongly intercorrelated”
traits such as “self-will, thing-orientation, individualism and
innovative creativity on the one pole and compliance, person-
orientation, sociability, conformity and creative adaptiveness on
the other. Individuals differ from one another as far as the balance
between these polarities [is] concerned. This variation between
individuals must have genetic components” (van der Molen, 1994,
p. 140).
Drawing on the work of Cloninger (1986, 1987), van der
Molen (1994, pp. 150–152; see also Skinner and Fox-Francoeur,
2013) makes a strong case for the evolutionary and genetic com-
ponents of adaption—innovation. Cloninger’s “novelty-seeking”
and “reward dependence” dimensions of personality are espe-
cially pertinent. The former is driven predominantly by the
neurotransmitter DA which manifests in behavior that seeks to
alleviate boredom and monotony, to deliver the sense of exhilara-
tion and excitement that is generally termed “sensation-seeking”
(Zuckerman, 1994); these individuals demonstrate a tendency
to be “impulsive, quick-tempered and disorderly. . . quickly dis-
tracted or bored. . . easily provoked to prepare for flight or fight”
(van der Molen, 1994, p. 151). “Reward dependent” individuals
are, in contrast, highly dependent on “social reward and approval,
sentiment and succour”; they are “eager to help and please others,
persistent, industrious, warmly sympathetic, sentimental, and
sensitive to social cues, praise and personal succour, but also able
to delay gratification with the expectation of eventually being
socially rewarded” (ibid). These individuals’ behavior is strongly
controlled by the monoamine neuromodulator norepinephrine.
Which of these bundles of attributes manifests in behavior
that marks out some individuals as leaders depends entirely on
the demands of the managerial situation: retail banking, relying
for the most part on the implementation of standard operating
procedures, may have a natural tendency to encourage and reward
those behaviors that reflect an adaptive cognitive style; pharma-
ceutical companies, whose technological, demand and competi-
tive environments reflect a greater dynamism than is ordinarily
the norm for retail banking, requires for a much larger part of its
activities the presence of individuals whose cognitive and creative
styles are predominantly innovative. Investment banking which
is expected to reflect a large adaptively-creative style of operation
but which attracts innovators is in danger of becoming the kind
of “casino banking” that has been so deleterious to both corporate
and general social welfare in the last decade. But the inability
of an organization to achieve the right cognitive and creative
accommodation to its environment will predictably culminate in
catastrophe. For the retail bank whose leaders fail to perceive and
respond appropriately to the changing international competition
in high-street banking, the pharmaceutical firm that becomes
over-involved in the development and marketing of drugs that
are novel in the extreme, and for the investment bank that
over-emphasizes innovative creativity to the point where reckless
decisions are made, catastrophe is equally probable. Predominant
organizational climate, adaptive or innovative, can be disastrous
if either of these cognitive styles comes to predominate.
These behavioral styles are remarkably consonant the innova-
tive and adaptive cognitive/creative styles, respectively, described
by Kirton (2003). Their prevalence and likely genetic basis is
borne out by their consistency with the RST described above
(Corr, 2008a; see also Eysenck, 2006), though the terminology
may vary. The incorporation of adaption-innovation theory into
the framework of conceptualization and analysis also suggests a
wider search for the neurophysiological basis of styles of creativity.
But these are matters for further research.
SUMMARY AND CONCLUSIONS
Analyses of managerial behavior in neurophysiological terms raise
two difficulties. The first is conceptual: such accounts conflate
cognitive processes with neurophysiological events; the second
relates to practical management: such accounts offer little by way
of solution to the personal and organizational problems that result
from behavior that is motivated by excess influence of either man-
agers’ impulsive systems or their executive systems. This paper has
sought to contribute to the resolution of the conceptual prob-
lem, by introducing a cognitive dimension, picoeconomics, into
neuro-behavioral decision theory, and the adaption—innovation
theory of cognitive styles to that of the practical problem by
deriving prescriptions for changing managerial behavior.
The prime conclusion is that the use of neurophysiologi-
cal theory and research in the conceptualization of managerial
decision-making and in approaching the solution of problems
that arise therein is entirely justified but needs to be qualified
by practical considerations suggested by the nature of managerial
work and the ways in which managerial behavior can be modified
especially in the context of large-scale organizations. Prior to such
activity, however, is the resolution of conceptual problems in the
explanation of individual behavior on the basis of neurophysio-
logical events. This paper has pursued a central requirement of
neuro-behavioral decision theory’s use of intentional terminology
to explain human behavior: the role of cognitive terminology
and its implication for the shape of the overall theory. It has
argued that picoeconomics provides a valuable means of incul-
cating a cognitive level of explanation into the theory and that
one of its advantages is that it suggests solutions to hyperac-
tivity in one or other of the impulsive and executive systems
identified by the theory which is exacerbated by hypoactivity
in the alternative system. The solutions proposed by picoeco-
nomics may, however, be most suitable for remedial action in
clinical settings rather than in organizational settings. The quest
for solutions to managerial problems is more readily achieved
through organization-level models of managerial activity that
incorporate as fully as possible neurophysiological understand-
ings of behavior that are compatible with those found in neuro-
behavioral decision theory. One possibility in the present context
Frontiers in Human Neuroscience www.frontiersin.org April 2014 | Volume 8 | Article 184 |
91

Foxall Cognitive requirements of neurobehavioral decision theory
is the application of adaption-innovation theory, dimensions of
which are known to map reliably on to the neurophysiological
and cognitive/personality factors that underpin impulsive and
executive systems. The proposal that managerial teams be built
and managed in ways that reflect these considerations suggests the
most relevant applications of neuro- and behavioral science, with
cognitive psychology, for the remediation of certain managerial
excesses. These conclusions lead predictably to a call for further
research along the lines indicated.
The advantage of this emphasis on cognitive style is that it
differentiates managers on the basis of their susceptibility to
hyper- or hypo-activity of either the impulsive or executive sys-
tems; and recognizing that the managerial functions with which
we are concerned are populated by managers of widely differ-
ing cognitive styles should reduce our tendencies to stereotype
managers on the basis of their broadly-defined functional roles
(Foxall and Hackett, 1994; Foxall and Minkes, 1996). The neu-
rophysiological foundations of adaption-innovation as presented
here do not map directly on to those of RST or neuro-behavioral
decision theory. But there is sufficient overlap to motivate further
investigation.
ACKNOWLEDGMENTS
Extracts from this paper are to appear in a book chapter: Foxall,
G. R. Neurophilosophy of explanation in economic psychology:
an exposition in terms of neuro-behavioral decision systems.
In: Moutinho, L., Bigne, E. and Manrai, A. K. (Eds) Routledge
Companion to the Future of Marketing. London and New York:
Routledge. The author gratefully acknowledges the permission of
the editors and the publisher to use this material.
REFERENCES
Ainslie, G. (1992). Picoeconomics: The Strategic Interaction of Successive Motivational
States within the Person. Cambridge: Cambridge University Press.
Ainslie, G., and Monterosso, J. (2003). “Hyperbolic discounting as a factor in
addiction: a critical analysis,” in Choice, Behavioral Economics and Addiction, eds
R. E. Vuchinich and N. Heather (Pergamon: Oxford), 35–70.
Ansoff, H. (1965). Corporate Strategy. New York: McGraw Hill.
Bailey, C. E. (2007). Cognitive accuracy and intelligent executive function in the
brain and in business. Ann. N Y Acad. Sci. 1118, 122–141. doi: 10.1196/annals.
1412.011
Barkley, R. A. (1997a). Behavioral inhibition, sustained attention and executive
functions: constructing a unified theory of ADHD. Psychol. Bull. 121, 65–94.
doi: 10.1037//0033-2909.121.1.65
Barkley, R. A. (2012). Executive Functions: What They are, How They Work and Why
They Evolved. New York: The Guilford Press.
Barkley, R. A. (1997b). ADHD and the Nature of Self-control. New York: Guilford.
Baumeister, R. F., and Vohs, K. D. (2003). “Willpower, choice and self-control,”
in Time and Decision: Economic and Psychological Perspectives on Intertemporal
Choice, eds G. Lowenstein, D. Read and R. Baumeister (New York: Russell Sage
Foundation), 201–216.
Baumesiter, R. F., and Tierney, J. (2011). Willpower: Why Self-Control is the Secret
of Success. London: Penguin.
Bechara, A. (2005). Decision-making, impulse control and loss of willpower to
resist drugs: a neurocognitive perspective. Nat. Neurosci. 8, 1458–1463. doi: 10.
1038/nn1584
Bechara, A. (2011). “Human emotions in decision making: are they useful or
disruptive?,” in Neuroscience of Decision Making, eds O. Vartanian and D. R.
Mandel (New York and Hove: Psychology Press), 73–95.
Bechara, A., and Damasio, D. R. (2005). The somatic marker hypothesis: a neural
theory of economic decision. Games Econ. Behav. 52, 336–372. doi: 10.1016/j.
geb.2004.06.010
Bechara, A., Damasio, H., and Damasio, A. R. (2000). Emotion, decision making
and the orbitofrontal cortex. Cereb. Cortex 10, 295–307. doi: 10.1093/cercor/10.
3.295
Bennett, M. R., and Hacker, P. M. S. (2003). Philosophical Foundations of Neuro-
science. Oxford: Blackwell.
Bickel, W. K., and Johnson, M. W. (2003). “Delay discounting: a fundamental
behavioral process in drug dependence,” in Time and Decision: Economic and
Psychological Perspectives on Intertemporal Choice, eds G. Lowenstein, D. Read
and R. Baumeister (New York: Russell Sage Foundation), 419–440.
Bickel, W. K., and Marsch, L. A. (2001). Toward a behavioral economic under-
standing of drug dependence: delay discounting processes. Addiction 96, 73–86.
doi: 10.1046/j.1360-0443.2001.961736.x
Bickel, W. K., and Vuchinich, R. E. (Eds) (2000). Reframing Health Behavior Change
with Behavioral Economics. Mahwah, NJ: Erlbaum.
Bickel, W. K., and Yi, R. (2010). “Neuroeconomics of addiction: the contribution
of executive dysfunction,” in What is Addiction?, eds D. Ross, H. Kincaid, D.
Spurrett and P. Collins (Cambridge, MA: MIT Press), 1–25.
Bickel, W. K., Jarmolowicz, D. P., MacKillop, J., and Epstein, L. H. (2013). “What is
addiction?,” in Addictions: A Comprehensive Guidebook, eds B. S. McCrady and
E. E. Epstein, 2nd Edn. (New York: Oxford University Press), 3–16.
Bickel, W. K., Jarmolowicz, D. P., Mueller, E. T., and Gatchalian, K. M. (2011a). The
behavioral economics and neuroeconomics of reinforcer pathologies: implica-
tions for etiology and treatment of addiction. Curr. Psychiatry Rep. 13, 406–415.
doi: 10.1007/s11920-011-0215-1
Bickel, W. K., Jarmolowicz, D. P., Mueller, E. T., Gatchalian, K. M., and McClure,
S. M. (2012a). Are executive function and impulsivity antipodes? A conceptual
reconstruction with special reference to addiction. Psychopharmacology (Berl)
221, 361–387. doi: 10.1007/s00213-012-2689-x
Bickel, W. K., Jones, B. A., Landes, R. D., Christensen, D. R., Jackson, L., and
Mancino, M. (2010). Hypothetical intertemporal choice and real economic
behavior: delay discounting predicts voucher redemptions during contingency-
management procedures. Exp. Clin. Psychopharmacol. 18, 546–552. doi: 10.
1037/a0021739
Bickel, W. K., Kowal, B. P., and Gatchalian, K. M. (2006). Understanding addiction
as a pathology of temporal horizon. Behav. Anal. Today 7, 32–47.
Bickel, W. K., Landes, R. D., Christensen, D. R., Jackson, L., Jones, B. A., Kurth-
Nelson, Z., et al. (2011b). Single- and cross-commodity discounting among
cocaine addicts: the commodity and its temporal location determine discount-
ing rate. Psychopharmacology (Berl) 217, 177–187. doi: 10.1007/s00213-011-
2272-x
Bickel, W. K., Miller, M. L., Yi, R., Kowal, B. P., Lindquist, D. M., and Pitcock, J. A.
(2007). Behavioral and neuroeconomics of drug addiction: competing neural
systems and temporal discounting processes. Drug Alcohol Depend. 90, S85–S91.
doi: 10.1016/j.drugalcdep.2006.09.016
Bickel, W. K., Mueller, E. T., and Jarmolowicz, D. P. (2012b). “The behavioral
economics of reinforcer pathologies: novel approaches to addictive disorders,”
in APA Addiction Syndrome Handbook, ed H. J. Shaffer (Washington, DC:
American Psychological Association), 333–363.
Bickel, W. K., Odum, A. L., and Madden, G. J. (1999). Impulsivity and cigarette
smoking: delay discounting in current, never and ex-smokers. Psychopharma-
cology (Berl) 146, 447–454. doi: 10.1007/pl00005490
Bickel, W. R., and Yi, R. (2008). Temporal discounting as a measure of executive
function: insights from the competing neuro-behavioral decisions systems
hypothesis of addiction. Adv. Health Econ. Health Serv. Res. 20, 289–309. doi: 10.
1016/s0731-2199(08)20012-9
Butler, M. J. R., and Senior, C. (2007a). Toward an organizational cogni-
tive neuroscience. Ann. N Y Acad. Sci. 1118, 1–17. doi: 10.1196/annals.14
12.009
Butler, M. J. R., and Senior, C. (2007b). Research possibilities in organizational
cognitive neuroscience. Ann. N Y Acad. Sci. 1118, 206–210. doi: 10.1196/annals.
1412.010
Caldú, X., and Dreher, J.-C. (2007). Hormonal and genetic influences on processing
reward and social information. Ann. N Y Acad. Sci. 1118, 43–73. doi: 10.
1196/annals.1412.007
Chisholm, R. (1957). Perceiving: A Philosophical Study. Ithaca, NY: Cornell Univer-
sity Press.
Cloninger, C. R. (1986). A unified biosocial theory of personality and its role in the
development of anxiety states. Psychiatr. Dev. 4, 167–226.
Frontiers in Human Neuroscience www.frontiersin.org April 2014 | Volume 8 | Article 184 |
92

Foxall Cognitive requirements of neurobehavioral decision theory
Cloninger, C. R. (1987). A systematic method for clinical description and clas-
sification of personality variants. Arch. Gen. Psychiatry 44, 573–588. doi: 10.
1001/archpsyc.1987.01800180093014
Corr, P. J. (2008b). “Reinforcement sensitivity theory (RST): introduction,” in
The Reinforcement Sensitivity Theory of Personality, ed P. J. Corr (Cambridge:
Cambridge University Press), 1–43.
Corr, P. J. (Ed) (2008a). The Reinforcement Sensitivity Theory of Personality. Cam-
bridge: Cambridge University Press.
Damasio, A. R. (1994). Descartes’ Error: Emotion, Reason and the Human Brain.
New York: Putnam.
Daw, N. D. (2013). “Advanced reinforcement learning,” in Neuroeconomics:
Decision-Making and the Brain, eds P. W. Glimcher and E. Fehr, 2nd Edn.
(London: Elsevier), 299–320.
Daw, N. D., and Tobler, P. N. (2013). “Value learning through reinforcement: the
basics of dopamine and reinforcement learning,” in Neuroeconomics: Decision-
Making and the Brain, eds P. W. Glimcher and E. Fehr, 2nd Edn. (London:
Elsevier), 283–298.
Dayan, P. (2012). “Models of value and choice,” in Neuroscience of Preference
and Choice: Cognitive and Neural Mechanisms, eds R. J. Dolan and T. Sharot
(Amsterdam: Academic Press), 33–52.
Delgado, M. R., and Tricomi, E. (2011). “Reward processing and decision making
in the human striatum,” in Neuroscience of Decision Making, eds O. Vartanian
and D. R. Mandel (New York and Hove: Psychology Press), 145–172.
Dennett, D. C. (1969). Content and Consciousness. London: Routledge and Kegan
Paul.
Di Chiara, G. (2002). “Dopamine and reward,” in Dopamine in the CNS II, ed G. di
Chiara (Berlin: Springer), 265–319.
Drucker, P. F. (2007). The Practice of Management. 2nd Edn. London: Routledge.
Eisenberger, N. I., and Cole, S. W. (2012). Social neuroscience and health: neuro-
physiological mechanisms linking social ties with physical health. Nat. Neurosci.
15, 669–674. doi: 10.1038/nn.3086
Eysenck, H. J. (2006). The Biological Basis of Personality. 2nd Edn. New Brunswick:
Transaction.
Fodor, J. A. (1983). The Modularity of Mind. Cambridge, MA: MIT Press.
Foxall, G. R. (2004). Context and Cognition: Interpreting Complex Behavior. Reno,
NV: Context Press.
Foxall, G. R. (2007a). Explaining Consumer Choice. London and New York:
Macmillan.
Foxall, G. R. (2007b). Explaining consumer choice: coming to terms with
intentionality. Behav. Processes 75, 129–145. doi: 10.1016/j.beproc.2007.
02.015
Foxall, G. R. (2010). Accounting for consumer choice: inter-temporal decision-
making in behavioral perspective. Mark. Theory 10, 315–345. doi: 10.1177/
1470593110382823
Foxall, G. R. (2011). Brain, emotion and contingency in the explanation of
consumer behavior. Int. Rev. Ind. Organ. Psychol. 26, 47–91. doi: 10.1002/978
1119992592.ch2
Foxall, G. R. (2013). Interpreting Consumer Choice: The Behavioral Perspective
Model. New York: Routledge.
Foxall, G. R., and Hackett, P. (1994). Styles of managerial creativity: a com-
parison of adaption-innovation in the United Kingdom, Australia and the
United States. Br. J. Manag. 5, 85–100. doi: 10.1111/j.1467-8551.1994.tb0
0070.x
Foxall, G. R., and Minkes, A. L. (1996). Beyond marketing: the locus of
entrepreneurship in the modern corporation. J. Strateg. Mark. 4, 71–94. doi: 10.
1080/096525496346902.
Gottfried, J. A., O’Doherty, J., and Dolan, R. J. (2003). Encoding predictive reward
value in human amygdala and orbitofrontal cortex. Science 301, 1104–1107.
doi: 10.1126/science.1087919
Gray, J. A. (1982). The Neuropsychology of Anxiety: An Enquiry into the Functions of
the Septo-Hippocampal System. Oxford: Oxford University Press.
Gray, J. A., and McNaughton, N. (2000). The Neuropsychology of Anxiety. Oxford:
Oxford University Press.
Haber, S. N. (2009). “Anatomy and connectivity of the reward circuit,” in Handbook
of Reward and Decision Making, eds J.-C. Dreher and L. Tremblay (Amsterdam:
Academic Press), 1–27.
Herrnstein, R. J. (1997). The Matching Law. Cambridge, MA: Harvard University
Press.
Jablokow, K. W. (2005). The catalytic nature of science: implications for scientific
problem solving in the 21st Century. Technol. Soc. 27, 531–549. doi: 10.1016/j.
techsoc.2005.08.006
Jablokow, K. W., and Kirton, M. J. (2009). “Problem solving, creativity and the
level-style distinction,” in Perspectives on the Nature of Intellectual Styles, eds L.-F.
Zhang and R. J. Sternberg (New York: Springer), 137–168.
Jentsch, J. D., and Taylor, J. R. (1999). Impulsivity resulting from frontostriatal
dysfunction in drug abuse: implications for the control of behavior by reward-
related stimuli. Psychopharmacology 146, 373–390. doi: 10.1007/pl00005483
Kirton, M. J. (1976). Adaptors and innovators: a theory and measure. J. Appl.
Psychology 61, 622–629. doi: 10.1037/0021-9010.61.5.622
Kirton, M. J. (2003). Adaption-Innovation in the Context of Diversity and Change.
London and New York: Routledge.
Klein, H. E., and D’Esposito, M. (2007). Neurocognitive inefficacy of the strat-
egy process. Ann. N Y Acad. Sci. 1118, 163–185. doi: 10.1196/annals.14
12.012
Kringelbach, M. L. (2010). “The hedonic brain: a functional neuroanatomy of
human pleasure,” in Pleasures of the Brain, eds M. L. Kringelbach and K. C.
Berridge (Oxford: Oxford University Press), 202–221.
Lawrence, A. D., and Calder, A. J. (2004). “Homologizing human emotions,” in
Emotion, Evolution and Rationality, eds D. Evans and P. Cruse (Oxford: Oxford
University Press), 15–47.
Lee, N., Broderick, A. J., and Chamberlain, L. (2007). What is “neuromarketing”?
A discussion and agenda for future research. Int. J. Psychophysiol. 63, 199–204.
doi: 10.4324/9780203255124
Lee, N., and Chamberlain, L. (2007). Neuroimaging and psychophysiological mea-
surement in organizational research: an agenda for research in organizational
cognitive neuroscience. Ann. N Y Acad. Sci. 1118, 18–42. doi: 10.1196/annals.
1412.003
Levine, C. (2007). Neural correlates of corporate camaraderie and teamwork. Ann.
N Y Acad. Sci. 1118, 102–108. doi: 10.1196/annals.1412.008
London, E. D., Ernst, M., Grant, S., Bonson, K., and Weinstein, A. (2000).
Orbitofrontal cortex and human drug abuse: functional imaging. Cereb. Cortex
10, 334–342. doi: 10.1093/cercor/10.3.334
McClure, S. M., Laibson, D. L., Loewenstein, G., and Cohen, J. D. (2004). Separate
neural systems value immediate and delayed monetary rewards. Science 306,
503–507. doi: 10.1126/science.1100907
McNaughton, N., and Corr, P. J. (2004). A two-dimensional neuropsychology of
defense: fear/anxiety and defence distance. Neurosci. Biobehav. Rev. 28, 285–305.
doi: 10.1016/j.neubiorev.2004.03.005
McNaughton, N., and Corr, P. J. (2008). “The neuropsychology of fear and anxiety:
a foundation for Reinforcement Sensitivity Theory,” in The Reinforcement Sen-
sitivity Theory of Personality, ed P. J. Corr (Cambridge: Cambridge University
Press), 44–94.
Michl, T., and Taing, S. (2010). “An economic and neuroscientific comparison of
strategic decision-making,” in Neuroeconomics and the Firm, eds A. A. Stanton,
M. Day and I. M. Welpe (Cheltenham, Glos: Edward Elgar), 173–198.
Mojzisch, A., and Schultz-Hardt, S. (2007). Being fed-up: a social cognitive neuro-
science approach to mental satiation. Ann. N Y Acad. Sci. 1118, 186–205. doi: 10.
1196/annals.1412.006
Moll, J., and Grafman, J. (2011). “Well, what do you want to do? A cognitive
neuroscience view of plan decision making,” in Neuroscience of Decision Making,
eds O. Vartanian and D. R. Mandel (New York and Hove: Psychology Press),
285–309.
Naqvi, N., Shiv, B., and Bechara, A. (2006). The role of emotion in decision making.
Curr. Dir. Psychol. Sci. 15, 260–264. doi: 10.1111/j.1467-8721.2006.00448.x
Peterson, R. L. (2007). Inside the Investor’s Brain: The Power of Mind over Money.
Hoboken, NJ: Wiley.
Phelps, E. A., and Sokol-Hessner, P. (2012). “Social and emotional factors in
decision-making: appraisal and value,” in Neuroscience of Preference and Choice:
Cognitive and Neural Mechanisms, eds R. J. Dolan and T. Sharot (Amsterdam:
Academic Press), 207–223.
Pickering, A. D., and Smillie, L. D. (2008). “The behavioral activation system: chal-
lenges and opportunities,” in The Reinforcement Sensitivity Theory of Personality,
ed P. J. Corr (Cambridge: Cambridge University Press), 120–154.
Porcelli, A. J., and Delgado, M. R. (2009). “Reward processing in the human brain:
insights from fMRI,” in Handbook of Reward and Decision Making, eds J.-C.
Dreher and L. Tremblay (Amsterdam: Academic Press), 165–184.
Frontiers in Human Neuroscience www.frontiersin.org April 2014 | Volume 8 | Article 184 |
93

Foxall Cognitive requirements of neurobehavioral decision theory
Robbins, T. W., and Everitt, B. J. (2002). “Dopamine – its role in behavior and
cognition in experimental animals and humans,” in Dopamine in the CNS II, ed
G. di Chiara (Berlin: Springer), 173–211.
Rolls, E. T. (2005). Emotion Explained. Oxford: Oxford University Press.
Rolls, E. T. (2008). Memory, Attention and Decision-Making. Oxford: Oxford
University Press.
Rolls, E. T. (2009). “From reward value to decision-making: neuronal and com-
putational principles,” in Handbook of Reward and Decision Making, eds J.-C.
Dreher and L. Tremblay (Amsterdam: Academic Press), 97–133.
Ross, D. (2012). “The economic agent: not human, but important,” in Philosophy of
Economics, ed U. Mäki (Amsterdam: Elsevier), 691–736.
Ross, D., Sharp, C., Vuchinich, R. E., and Spurrett, D. (2008). Midbrain Mutiny. The
Picoeconomics and Neuroeconomics of Disordered Gambling. Cambridge, MA:
MIT Press.
Schoenbaum, G., Setlow, B., Saddoris, M. P., and Gallagher, M. (2003). Encoding
predicted outcome and acquired value in orbitofrontal cortex during cue
sampling depends upon input from basolateral amygdala. Neuron 39, 855–867.
doi: 10.1016/s0896-6273(03)00474-4
Schultz, W. (2000). Multiple reward signals in the brain. Nat. Rev. Neurosci. 1, 199–
207. doi: 10.1038/35044563
Schultz, W. (2002). Getting formal with dopamine and reward. Neuron 36, 241–
263. doi: 10.1016/s0896-6273(02)00967-4
Schultz, W., and Dickinson, A. (2000). Neuronal coding of prediction errors. Annu.
Rev. Neurosci. 23, 473–500. doi: 10.1146/annurev.neuro.23.1.473
Schultz, W., Preuschoff, K., Camerer, C., Hsu, M., Fiorillo, C. D., Tobler, P. N., et al.
(2008). Explicit neural signals reflecting reward uncertainty. Philos. Trans. R.
Soc. Lond. B Biol. Sci. 363, 3801–3811. doi: 10.1098/rstb.2008.0152
Senior, C., and Butler, M. J. R. (Eds) (2007a). The social cognitive neuroscience
of organizations. Ann. N Y Acad. Sci. 1118, 1–210. doi: 10.1196/annals.1412.
auindex_1
Senior, C., and Butler, M. J. R. (2007b). Research possibilities for organizational
cognitive neuroscience. Ann. N Y Acad. Sci. 1118, 206–210. doi: 10.1196/annals.
1412.010
Shallice, T., and Cooper, R. P. (2011). The Organisation of Mind. Oxford: Oxford
University Press.
Simon, H. A. (1965). “The new science of management decision,” in The Shape of
Automation for Men and Management, ed H. A. Simon (New York: Harper and
Row), 51–79.
Skinner, B. F. (1969). Contingencies of Reinforcement: A Theoretical Analysis. Engle-
wood Cliffs, NJ: Prentice-Hall.
Skinner, N., and Fox-Francoeur, C. (2013). Personality implications of adaption-
innovation: VI. Adaption-innovation as a predictor of disease proneness. Soc.
Behav. Pers. 41, 223–227. doi: 10.2224/sbp.2013.41.2.223
Smillie, L. D. (2008). What is reinforcement sensitivity? Neuroscience paradigms
for approach-avoidance processes theories of personality. Eur. J. Pers. 22, 359–
384. doi: 10.1002/per.674
Stanton, A. A., Day, M., and Welpe, I. M. (2010). Neuroeconomics and the Firm.
Cheltenham, Glos: Edward Elgar.
Symmonds, M., and Dolan, R. J. (2012). “The neurobiology of preferences,” in
Neuroscience of Preference and Choice: Cognitive and Neural Mechanisms, eds R. J.
Dolan and T. Sharot (Amsterdam: Academic Press), 3–31.
Tabibnia, G., and Lieberman, M. D. (2007). Fairness and cooperation are reward-
ing: evidence from social cognitive neuroscience. Ann. N Y Acad. Sci. 1118, 90–
101. doi: 10.1196/annals.1412.001
Tobler, P. N., and Kobayashi, S. (2009). “Electrophysiological correlates of reward
processing in dopamine neurons,” in Handbook of Reward and Decision Making,
eds J.-C. Dreher and L. Tremblay (Amsterdam: Academic Press), 29–50.
Tubbs, S. L., Jablokow, K. W., and Kirton, M. J. (2012). Addressing the need for
problem solving and creativity by integrating adaption-innovation theory with
leadership competencies theory. J. Curr. Res. Glob. Bus. 15, 1–19.
van der Molen, P. P. (1994). “Adaption-innovation and changes in social struc-
ture: on the anatomy of catastrophe,” in Adaptors and Innovators: Styles of
Creativity and Problem Solving, ed M. J. Kirton (London: Routledge), 137
–172.
Walton, M. E., Rudeback, P. H., Behrens, E. J., and Rushworth, M. F. A. (2011).
“Cingulate and orbitofrontal contributions to valuing knowns and unknowns
in a changeable world,” in Decision Making, Affect and Learning: Attention and
Performance XXIII, eds M. R. Delgado, E. A. Phelps and T. W. Robbins (Oxford:
Oxford University Press), 235–261.
Wantanabe, M. (2009). “Role of the primate lateral prefrontal cortex in integrating
decision-making and motivational information,” in Handbook of Reward and
Decision Making, eds J.-C. Dreher and L. Tremblay (London: Academic Press),
79–96.
Wargo, D. T., Baglini, N. A., and Nelson, K. A. (2010a). “The new millennium’s
first global financial crisis: the neuroeconomics of greed, self-interest, deception,
false trust, overconfidence and risk perception,” in Neuroeconomics and the Firm,
eds A. A. Stanton, M. Day and I. M. Welpe (Cheltenham, Glos: Edward Elgar),
78–98.
Wargo, D. T., Baglini, N. A., and Nelson, K. A. (2010b). “Dopamine, expected
utility and decision-making in the firm,” in Neuroeconomics and the Firm, eds
A. A. Stanton, M. Day and I. M. Welpe (Cheltenham, Glos: Edward Elgar),
151–170.
Yeats, R. M., and Yeats, M. F. (2007). Business change process, creativ-
ity and the brain: a practitioner’s reflective account with suggestions for
future research. Ann. N Y Acad. Sci. 1118, 109–121. doi: 10.1196/annals.141
2.004
Zak, P. J. (2004). “Neuroeconomics,” in Law and the Brain, eds S. Zeki and O.
Goodenough (Oxford: Oxford University Press), 133–153.
Zak, P. J. (2007). “The neuroeconomics of trust,” in Renaissance in Behavioral
Economics: Essays in Honor of Harvey Leibenstein, ed R. Franz (London and New
York: Routledge), 17–33.
Zak, P. J., and Nadler, A. (2010). “Using brains to create trust: a manager’s toolbox,”
in Neuroeconomics and the Firm, eds A. A. Stanton, M. Day and I. M. Welpe
(Cheltenham, Glos: Edward Elgar), 69–77.
Zuckerman, M. (1994). Behavioral Expressions and Biological Bases of Sensation-
Seeking. Cambridge: Cambridge University Press.
Conflict of Interest Statement: The author declares that the research was con-
ducted in the absence of any commercial or financial relationships that could be
construed as a potential conflict of interest.
Received: 29 November 2013; accepted: 12 March 2014; published online: 01 April
2014.
Citation: Foxall GR (2014) Cognitive requirements of competing neuro-behavioral
decision systems: some implications of temporal horizon for managerial behav-
ior in organizations. Front. Hum. Neurosci. 8:184. doi: 10.3389/fnhum.2014.
00184
This article was submitted to the journal Frontiers in Human Neuroscience.
Copyright © 2014 Foxall. This is an open-access article distributed under the terms
of the Creative Commons Attribution License (CC BY). The use, distribution or
reproduction in other forums is permitted, provided the original author(s) or licensor
are credited and that the original publication in this journal is cited, in accordance with
accepted academic practice. No use, distribution or reproduction is permitted which
does not comply with these terms.
Frontiers in Human Neuroscience www.frontiersin.org April 2014 | Volume 8 | Article 184 |
94

REVIEW ARTICLE
published: 02 July 2014
doi: 10.3389/fnhum.2014.00472
The marketing firm and consumer choice: implications of
bilateral contingency for levels of analysis in organizational
neuroscience
Gordon R. Foxall
*
Cardiff Business School, Cardiff University, Cardiff, UK
Edited by:
Nick Lee, Loughborough University,
UK
Reviewed by:
Paul Martyn William Hackett,
Emerson College, USA
Vijay Viswanathan, Northwestern
University, USA
*Correspondence:
Gordon R. Foxall, Cardiff Business
School, Cardiff University,
Aberconway Building, Colum Drive,
Cardiff, CF10 3EU, UK
e-mail: foxall@cardiff.ac.uk
The emergence of a conception of the marketing firm (Foxall, 1999a) conceived within
behavioral psychology and based on a corresponding model of consumer choice,
(Foxall, 1990/2004) permits an assessment of the levels of behavioral and organizational
analysis amenable to neuroscientific examination. This paper explores the ways in
which the bilateral contingencies that link the marketing firm with its consumerate
allow appropriate levels of organizational neuroscientific analysis to be specified. Having
described the concept of the marketing firm and the model of consumer behavior
on which it is based, the paper analyzes bilateral contingencies at the levels of (i)
market exchange, (ii) emotional reward, and (iii) neuroeconomics. Market exchange
emerges as a level of analysis that lends itself predominantly to the explanation of
firm—consumerate interactions in terms of the super-personal level of reinforcing and
punishing contingencies: the marketing firm can be treated as a contextual or operant
system in its own right. However, the emotional reward and neuroeconomic levels of
analysis should be confined to the personal level of analysis represented by individual
managers on the one hand and individual consumers on the other. This also entails a level
of abstraction but it is one that can be satisfactorily handled in terms of the concept of
bilateral contingency.
Keywords: consumer behavior analysis, behavioral perspective model, marketing firm, bilateral contingency,
emotion, neuroeconomics, levels of explanation, organizational neuroscience
INTRODUCTION
LEVELS OF ANALYSIS IN ORGANIZATIONAL NEUROSCIENCE
An important issue for the emergent discipline of organizational
neuroscience is to determine the levels of analysis at which its
explanations of behavior may be properly directed. Four such lev-
els may be proposed as appropriate to the explanation of behavior
in terms of neurophysiological and environmental (reinforcing
and punishing) events: the sub-personal level of exposition refers
to neurophysiological events; the personal level, to the beliefs,
desires and other intentional idioms that are ascr ibed to the indi-
vidual to account for his/her behavior; the super-personal level to
the environmental influences that shape and maintain behavior
(i.e., reinforcers and punishers); and the supra-personal level to
the emergent behavior of an organization such as the firm.
Any explanation of behavior in terms of the sub-personal
level of neuronal activity (Dennett, 1969), enjoins methodological
individualism as a philosophy of science on its practitioners. After
all, the neurophysiology of an individual can enter into the expla-
nation of the behavior of that person alone. However, while the
behavioral analysis of individual members of organizations pro-
ceeds well enough in neurophysiological terms, it is sometimes
necessary to understand and predict the behavior of the organi-
zation as a whole. Even explanations of behavior based on radical
behaviorist models have recently embraced the idea that an orga-
nization might be treated as a contextual or operant system in its
own right, its behavior predictable from those of its outputs that
are over and above the joint consequences of the behaviors of its
members (Glenn, 1991, 2004; Foxall, 1999a; Glenn and Malott,
2004; Biglan and Glenn, 2013). How far is it feasible to con-
struct such an account of organizational b ehavior on the basis of
neurophysiological knowledge?
This may constitute an abstraction too far for traditional
behavior analysts for whom the individual organism is the sole
bearer of behavior that is to be environmentally explained; but
at least the behavioral outputs of supra-individual entities such
as organizations are identifiable by intersubjective agreement.
The same cannot be said of sub-personal events which are
employed in organizational neuroscience to explain the behavior
of individual managers; although the effects of such events may
be demonstrated under highly-restrictive laboratory conditions,
their application in the interpretation of the complex behaviors
that characterize human interactions in organizations requires
some ground rules for the explanation of personal level behavior
by means of inferred sub-personal occurrences.
Since the marketing firm is conceptualized as an organization
whose existence is closely tied up with the satisfaction of con-
sumer wants, the analysis of consumer behavior is a prerequisite
of the corporate-level investigation appropriate to the marketing
firm. The behavior of consumers is depicted comparatively eas-
ily in neuroscientific terms because each consumer can be treated
Frontiers in Human Neuroscience www.frontiersin.org July 2014 | Volume 8 | Article 472
|
HUMAN NEUROSCIENCE
95

Foxall Organizational neuroscience of bilateral contingency
as an individual; this enables analysis to embrace the personal
level of analysis which harmonizes with the possibility that sub-
personal (neuronal) events within the organism may play a causal
role in explaining the organism’s behavior. When we consider the
behavior of an individual in terms of the super-personal causal
texture provided by the consequences of behavior, that is when
we consider the individual to be a contextual or operant system,
we can specify once again how the persistence of this behav-
ior is influenced by the reinforcing and punishing outcomes it
produces. A recent extension of this idea is that the behavior
of organizations can be predicted and explained by considering
them in their entirety as “contextual systems.” A contextual system
is an entity the behavior of which can be predicted and explained
by reference to its learning history and its current behavior set-
ting; that is by the consequences that have followed its behaviors
in the past as they interact with current opportunities to repeat
similar behaviors or to engage in competing activities (Foxall,
1999b). This basic assumption of the concept of the marketing
firm (Foxall, 1999a), has also been incorporated into behavior
analytic thinking through the analysis of metacontingencies (e.g.,
Biglan and Glenn, 2013).
A complication arises, however, if we seek to apply neurosci-
entific thinking to the behavior of a supra-personal entity such as
a firm or other organization. There is no analog in the organiza-
tion of the neuronal firing in terms of which individual behavior
can be construed. It is, therefore, necessary to deal not with the
organization as a neurological unit but with the individual mem-
bers of the organization whose behavior may be understood by
reference to the behavior of other organizational members or
external actors. This paper is concerned, nevertheless, to explore
the implications of this in order to assess the contribution of
organizational neuroscience to the explanation not only of indi-
vidual managers and consumers, but to the interactions of the
marketing firm and its consumerate
1
. The key to this lies in the
bilateral contingencies that these interactions create and maintain
(Foxall, 2014a).
CONSUMER BEHAVIOR AND MARKETING MANAGEMENT
Although marketing management is generally understood as
a response to the demands of the mar ketplace, it is unusual
for a theory of managerial marketing to proceed in simi-
lar terms to those in which the underlying theory of con-
sumer choice is couched. The research program encompassing
the Behavioral Perspective Model of consumer behavior (BPM:
Foxall, 1990/2004, 2013)andtheTheoryoftheMarketingFirm
(TMF: Foxall, 1999a), which employ interfacing operant models,
attempts to address this inconsistency. Both models and the inter-
actions they posit have received empirical support in research that
has focused on the behavior of the marketing firm as a whole in
relation to other fir ms in the market
2
.
1
This neolog ism refers simply to the totality of the firm’s actual or potential
customer base.
2
Models developed in organizational sociology of the interaction of the firm
and its environment in terms of strategic management are also of relevance
to the market-exchange level of analysis explored below (e.g., Hannan and
Freeman, 1989; Pfeffer and Salancik, 2003).
This paper proposes and explores a level of analysis that has
not previously featured in studies of the marketing firm, namely
the neuropsychological and neuroeconomic implications of the
completion of successful exchanges with the firm’s consumers.
The emerging discipline of organizational neuroscience (e.g.,
Butler and Senior, 2007a,b; Lee and Chamberlain, 2007; Lee
et al., 2007; Becker and Cropanzano, 2010)providesageneral
framework for this analysis, which is extended by the incor-
poration of some aspects of neuroeconomics to capture the
economic and social exchange relationships that characterize
marketer-consumer relationships. While the behavior of con-
sumers has been explicated in terms of its neurophysiological
underpinnings (Foxall, 2008, 2011), those of managerial and
non-managerial firm members have not yet been characterized in
this way. The BPM/TMF framework proceeds in terms of operant
psychology and operant behavioral economics and it is within
this disciplinary matrix that the present paper is constructed.
However, the close relationship between reinforcement learning
and the operation of the dopaminergic reward prediction er ror
(RPE) system provides an additional reason for undertaking a
neuroeconomic analysis of behavior in operant terms (Stanton
et al., 2010; Caplin and Glimcher, 2013; Daw, 2013; Daw and
Tobler, 2013). This paper therefore examines the activ ities of
mangers conceived in operant terms. Although the paper focuses
on managerial rather than non-managerial organizational
behavior, motivation of the latter is implicit in its treatment of
the former since a central component of managerial behavior
involves the management of other members of the firm whose
motivation must be taken into account.
The paper describes the BPM and TMF approaches before
examining in greater detail than hitherto the nature of the bilat-
eral contingencies that link consumer behavior and marketing
management. Three levels of analysis of bilateral contingencies
are proposed, referring respectively to market-exchange rela-
tionships, emotional rewards, and neuroeconomics interactions.
The concluding section discusses the capacity of organizational
neuroscience to employ analyses of this kind.
CONSUMER BEHAVIOR ANALYSIS
The BPM (Foxall, 1990/2004) is an elaboration of the “three-term
contingency,” the basis explanatory device of operant behav-
iorism. In the three-term contingency, a consequential stimu-
lus influences the rate at which a previously-emitted response
is repeated (reinforced); any antecedent stimulus present when
reinforcement takes place may come to exert control over the
subsequent emission of the response, even in the absence of the
reinforcer. In summary,
S
D
→ R → S
R
where S
D
is a discriminative stimulus, i.e., an element of the
environment in the presence of which an organism performs
selectively by emitting a response, R, which has previously been
reinforced in the presence of the S
D
;andS
R
is the reinforcing
stimulus
3
.
3
The paper employs the term reinforcer to refer to any en vironmental stimulus
that follows the emission of a response and which has the effect of increasing
Frontiers in Human Neuroscience www.frontiersin.org July 2014 | Volume 8 | Article 472
|
96
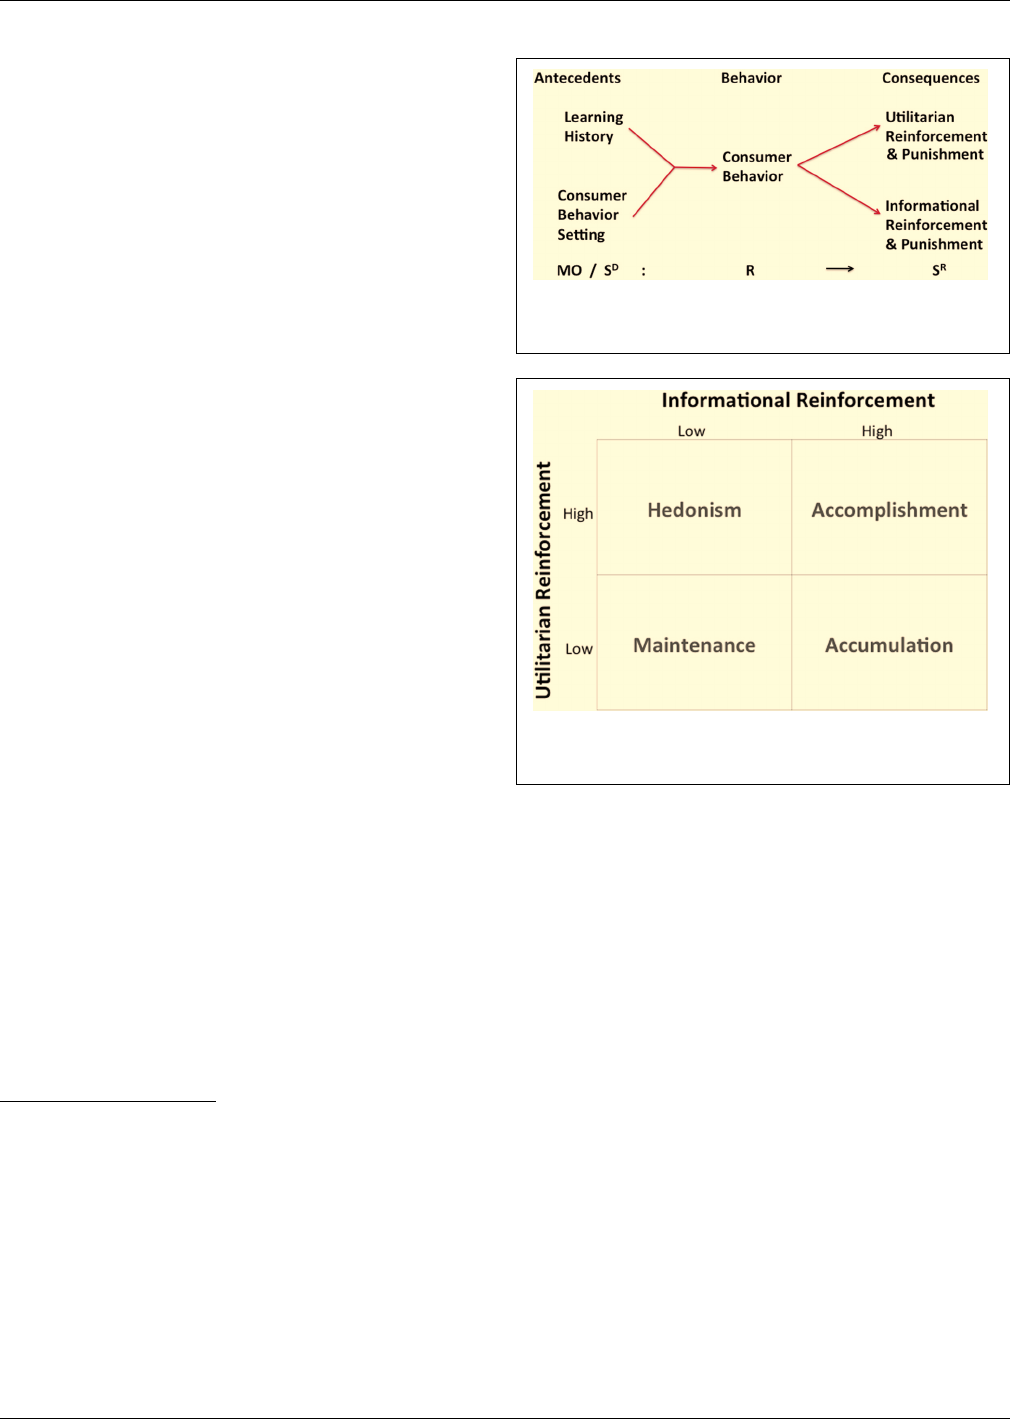
Foxall Organizational neuroscience of bilateral contingency
The efficacy of a learning history is thus understood as the
wayinwhichtheoutcomesofpriorbehaviorinfluencecurrent
choice. In recent years a 4-term contingency has been proposed
in which a motivating operation (MO) is an antecedent event
that enhances the relationship between the response and the rein-
forcer (Michael, 1982; for conceptual and empirical development
in the context of consumer behavior analysis, see Fagerstrøm,
2010; Fagerstrøm et al., 2010). An advertisement that promises
“This product will stimulate your taste buds like nothing you’ve
ever experienced!” is an example of a MO.
This basic paradigm is elaborated in the BPM to bring it into
service as a means of predicting and interpreting human eco-
nomic behavior in naturally-occurring setting s. In the BPM, the
immediate precursor of consumer behavior is the consumer situ-
ation which represents the interaction of the consumer’s learn-
ing history and the discriminative stimuli and MOs that make
up the current behavior setting (Figure 1). In this interaction,
the consumer’s experience in similar contexts primes the set-
ting stimuli so that certain behaviors are made more probable
while others are inhibited. Consumer behaviors that are encour-
aged by the consumer situation are those that have met with
rewarding or reinforcing consequences on previous consump-
tion occasions while those that are discouraged are those that
have been punished. The consequences of consumer behavior,
i.e., its reinforcing and aversive outcomes, are of two kinds: util-
itarian reinforcement and punishment consists in the behavioral
consequences that are functionally related to obtaining, owning
and using an economic product or service, while informational
reinforcement and punishment stem from the social and sym-
bolic outcomes of consumption. Consumer behavior is therefore
a function of the variables that make up the current consumer
behavior setting insofar as these prefigure positive and aversive
utilitarian and informational consequences of behaving in par-
ticular ways. A more closed consumer behavior setting is one
in which one or at most a few behaviors are available to the
consumer,whileamoreopensettingisonewhichpresentsthe
consumer with a multiplicity of ways of acting. The topogra-
phyofconsumerbehavioristhenpredictablefromthepattern
of utilitarian and informational reinforcement which the setting
variables signal to be available contingent on the enactment of
specific consumer behaviors.
Figure 2 shows the patterns of reinforcement that maintain
consumer choice, along with the operant classes of consumer
behavior that they define. Figure 3,theBPMContingencyMatrix,
the rate at which that response is performed. This is in line with the usual
meaning of a reinforcer as something that strengthens, in this case something
that strengthens a response by increasing the probability of its recurrence. This
usage is also consonant with the understanding of a reinforcer as something
for which an organism will work to achieve. A punisher is a consequent stim-
ulus that decreases that rate. Positive reinforcement involves the reception of
a reinforcer; negative reinforcement, escape from or avoidance of a punisher.
A punisher may also be understood, therefore, as something an organism will
work to avoid or escape from. This usage accords with that of Skinner (e.g.,
1974) and other radical behaviorists, though it is not followed universally. The
term reward is employed in this paper to refer to emotional reactions that may
affect the rate of behavioral performance and which are elicited by reinforcing
stimuli provided by the external environment (Rolls, 1999).
FIGURE 1 | The behavioral perspective model of consumer choice.
Adapted from Foxall (1990/2004). Used by permission.
FIGURE 2 | Pattern of reinforcement and operant classes of consumer
behavior. Adapted from Foxall (1990/2004). Used by permission.
further incorporates the scope of the consumer behavior setting
to provide a functional typology of the contingency categories
defined by the model. (For a full exposition of the model, see
Foxall, 2010). Empirical research demonstrates that changes in
consumer behavior, measured as elasticity of demand for fast
moving nondurables is a function of the pattern of utilitar-
ian and informational reinforcement (Foxall et al., 2004, 2013;
Oliveira-Castro et al., 2011; Yan et al., 2012a,b); moreover, con-
sumers’ utility functions can be estimated to demonstrate that
they maximize measurable combinations of these goods: Oliveira-
Castro et al. (under review) show that consumers maximize
selected combinations of utilitarian reinforcement and informa-
tional reinforcement as depicted by the following Cobb-Douglas
utility function:
U
(x1,x2)
= x
a
1
, x
b
2
(1)
where U is the total amount of utility obtained by consump-
tion of x
1
and x
2
, x1 is the quantity of utilitarian reinforcement
consumed, x
2
is the quantity of informational reinforcement
consumed, and a and b are empirically determined parameters
such that a + b = 1. Furthermore, empirical research suggests
that consumers ultimately maximize a combination of emotional
responses to consumption situations (Foxall, 2011; Foxall et al.,
Frontiers in Human Neuroscience www.frontiersin.org July 2014 | Volume 8 | Article 472
|
97
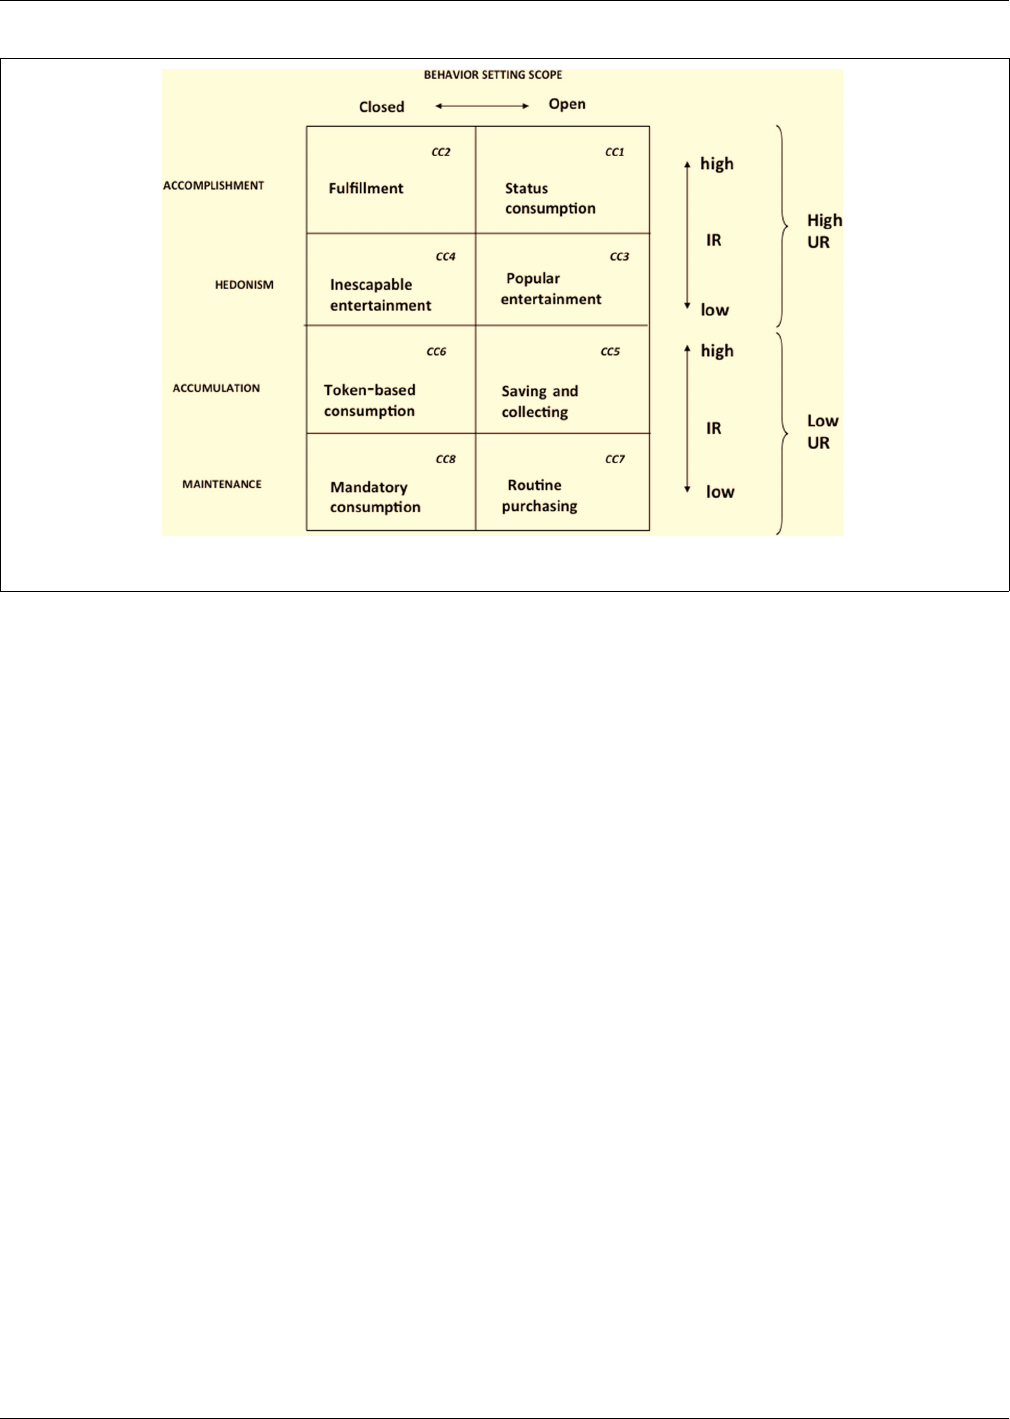
Foxall Organizational neuroscience of bilateral contingency
FIGURE 3 | The BPM contingency matrix. Adapted from Foxall (1990/2004). Used by permission. CC, Contingency Category.
2012). In short, we now have a clear picture of the reward
structure that shapes and maintains consumer choice, the neuro-
physiological processes that govern this structure, and the nature
of the emotional utility function which consumers optimize.
THE MARKETING FIRM
The underlying premise of the marketing firm concept (TMF;
Foxall, 1999a) is that firms exist in order to market within the
competitive structures that compel fir ms to adopt customer-
oriented mar keting as a general managerial philosophy is they
are to survive (avoid loss) and prosper (innovate in ways that
encourage a satisfactory level of sales. The concept reflects ele-
ments of the thought of Coase (1937), Simon (1976),andDrucker
(2007). The str uctural conditions that compel such marketing-
orientation are marked by the ability to productive capacity to
generate supply that exceeds demand, the existence of large levels
of discretionary income on the part of consumers engendering
inter-industrial competition among firms, and a sophisticated
consumerate, i.e., buyers who are knowledgeable with respect to
the products they purchase and the alternative offerings available
in the marketplace (Foxall, 1981).
The resulting framework of conceptualization and analy-
sis understands corporate institutions as organized patterns of
behavior maintained by their consequences, namely the rewards
and sanctions that follow them (or, more accurately and avoid-
ing teleology, that have followed them in the past). The behavior
of the marketing firm eventuates in the introduction of market-
ing mixes that offer product, price, promotion, and place utilities
to consumers (Foxall, 1999a). The success of the firm, hence its
future behavior, depends on the reception these marketing mixes
receive in the marketplace. This perspective, based on selection
by consequences (Skinner, 1981), permits continuity with evo-
lutionary theories of the firm (Hodgson and Knudsen, 2010)by
embracing the same explanatory principles of selection by conse-
quences that underlies Darwinian natural selection but extending
it to events in the ontogenetic development of individuals and
organizations. Van Parijs (1981) refers to these explanation as
N-evolution and R-evolution respectively, noting the role of nat-
ural selection (N) in the former and of reinforcement (R) in the
latter.
More specifically, the concept of the marketing firm portrays
corporate behavior in marketing-oriented enterprises as the man-
agement of the scope of the consumer behavior setting and the
pattern of reinforcement available to the consumer. The relation-
ship of the firm and its consumers is depicted in terms of bilateral
contingencies in which the behavior of marketers in reinforced
and punished by consumer behaviors while consumer behavior is
reinforced and punished by managerial actions. This paper con-
centrates on these marketing relationships that are characterized
by tangible exchanges of property rights between the firm and
its consumers. Its purpose is to complete the picture of bilateral
contingency between the firm and its consumers by probing (i)
what are the reward structures of managers within the marketing
firm? (ii) how are these underpinned by neurophysiological pro-
cesses? (iii) the nature of managers’ utility functions. The TMF
framework also draws a distinction between two kinds of rela-
tionship. The first, between the firm and its customers, between
principal and agent within the organization, between the firm and
its suppliers, all of which entail literal exchange of legal rights are
known as “marketing relationships.” Other relationships that do
not proceed on this basis even though they may be essential to
forming and maintaining marketing relationships, such as social
and trade association contacts among firms and broader non-
contractual relationships between managers and other employees,
are known as “mutuality relationships” (Foxall, 1999a; Vella and
Foxall, 2011). This paper is concerned primarily with the former.
Frontiers in Human Neuroscience www.frontiersin.org July 2014 | Volume 8 | Article 472
|
98

Foxall Organizational neuroscience of bilateral contingency
The behavior of managers within the marketing firm exhibits
many similarities with intra-firm managerial behavior generally.
These managerial behaviors have been a central concern of orga-
nizational neuroscience. There is a need for cooperation with
other managers and other employees, for instance. Work which
examines the neurophysiological basis of trust (Zak, 2004, 2007;
Zak and Nadler, 2010), cooperation and conflict (Levine, 2007;
Tabibnia and Lieberman, 2007), and social interaction (Caldú
and Dreher, 2007) are of special interest in the analysis of both
mutuality and exchange/marketing relationships. This is espe-
cially pertinent to the management of mutuality relationships
within the firm as well as outwith the organization, say between
the firm and its suppliers. The neurophysiological basis of behav-
ior is not likely to differ among managers but the sources of
the rewards they undertake will uniquely follow the pattern of
responsibilities their separate job descriptions entail. The various
types of decision, from the most administrative or programmed
to the most strategic and unprogrammed, that each of these
responsibilities requires will have implications for the kind of
neurophysiological functioning we can infer (Foxall, 2014b). It
is to the strategic sphere, management of bilateral relationships,
those that span the connections between the firm and its various
publics, that this paper pays special attention, for the very nature
of marketing management and the activities of the marketing firm
are defined and oriented toward such interactions.
The present analysis is concerned principally with the neu-
rophysiological implications of managerial behavior insofar as it
is influenced by the bilateral relationships between the firm and
its consumers. Specifically, it traces the sources of reward that
sustain these relationships for individual managers. Bilateral con-
tingency implies that the behavior of managers is reinforced by
the outcomes of consumer behavior just as consumer behavior
is reinforced by the outputs of the marketing firm in the form
of products and services. The emphasis is therefore on the mar-
keting relationships, those that entail literal exchange, between an
executive engaged in marketing management within a supplier
organization and its consumers.
BILATERAL CONTINGENCY
THE NATURE OF BILATERAL CONTINGENCY
Behavior analysts have traditionally adopted the individual
organism as their unit of analysis. However, by treating the orga-
nization that is the marketing firm as a contextual or operant
system in its own right, and by assuming that the function of such
a firm is to pursue marketing- or customer-oriented marketing, it
becomes feasible to interpret the behavior of its mangers in terms
of the context provided by its customers.
The relationships between the marketing firm and its cus-
tomers can be conceptualized in terms of bilateral contingencies
(Foxall, 1999a). The essence of this approach is that the behav-
ior of an organization is greater than/different from that of the
combined repertoires of its members. This conception, which
has always been integr al to the concept of the marketing firm, is
supported by recent thinking in organizational behavior analy-
sis which envisions the behaviors of organizational members as
enmeshed in interlocking behavioral contingencies (Glenn, 2004;
Biglan and Glenn, 2013). In both systems of thought, the behavior
of the system is inferred from the outputs it produces. Hence,
each element of the marketing mix—product, price, the promo-
tional communications and distribution systems—affects con-
sumer behavior in such a way as to make the behavior of the
organization predictable and explicable. To adopt this kind of
analysis is to consider the behavior of an organization or other
collectivity of individuals in operant terms, to understand it as a
contextual system.
Consideration of the marketing firm as a contextual system
has hitherto been confined to the behavioral analysis, in terms
of utilitarian and informational reinforcement, of the relation-
ship between its behavioral outputs and their reception by the
market and to the scope of the behavior settings of the firm and
its customers (Vella and Foxall, 2011, 2013). This has entailed
the description and explanation of the firm’s behavior in terms
of operational measures of behavioral consequences and behav-
ior setting. This is “Market-Exchange Analysis” which is briefly
described below. It is feasible, however, to extend the analysis
of the marketing firm as a contextual system by comprehending
marketer and customer behaviors in neurophysiological terms.
This is pursued below in terms of two further analyses: that of the
emotional rewards received by consumers and firms as a result
of their mutual interactions (“Affective-Reward Analysis”), and
that of the capacity of the signals each party to the transaction
receives from the other as RPEs that influence its own behavior
(“Neuroeconomic Analysis.”)
MARKET-EXCHANGE ANALYSIS
Market-exchange analysis concerns the overt relationships
between the marketing firm and its customer base (Figure 4). The
task of marketing management is to plan, devise and implement
marketing mixes that deliver satisfactions for the firm’s customer
base that are profitable for the firm. The components of the mar-
keting mix (product, price, promotion, and place utilities) appear
in the market place initially as MOs and discriminative stimuli for
the consumer behaviors of browsing, purchasing, and consuming.
Purchasing includes the exchange of money for the ownership of
the legal right to a product or service and this pecuniary exchange
acts as a source of both utilitarian reinforcement (in the form of
resources that can be paid out or reinvested) and informational
reinforcement (in the form of feedback on corporate perfor-
mance) for the marketing firm. The efficacy of Rm (managerial
behavior) i n fulfilling the professional requirements of marketing
management, namely the creation of a customer who purchases
the product at a price level sufficient to meet the goals of the firm,
is determined by the generation of profit and reputation for the
firm (depicted by the dotted diagonal line in Figure 4). This con-
sumer behavior (Rc) also acts as MOs and discriminative stimuli
for further marketing intelligence activities, marketing planning
and the devising and implementation of marketing mixes that
respond to the stabilities and/or dynamic nature of the behavior
of the c ustomer base (Vella and Foxall, 2011, 2013; Foxall, 2014a).
At this level of market interaction between the enterprise
and its customer base, managerial behavior can be viewed
as maximizing a utility function of the form shown for the
individual consumer in Equation (1), comprising a combination
of utilitarian reinforcement and informational reinforcement.
Frontiers in Human Neuroscience www.frontiersin.org July 2014 | Volume 8 | Article 472
|
99
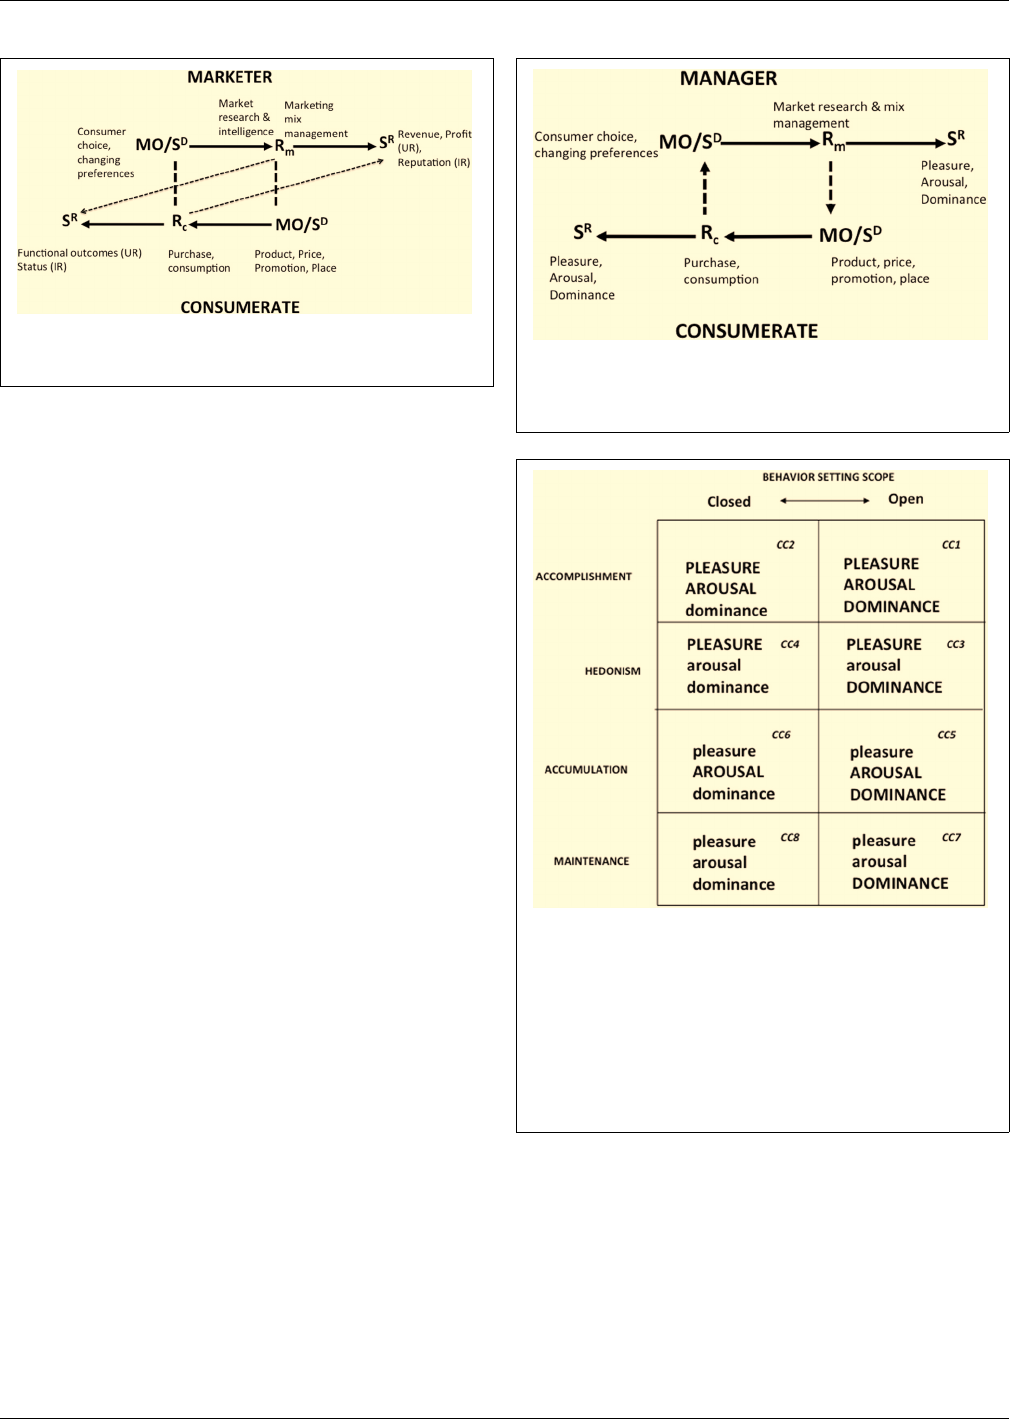
Foxall Organizational neuroscience of bilateral contingency
FIGURE 4 | Bilateral Contingency between the Marketing Firm (the
Marketer) and the its Consumerate.
AFFECT-REWARD ANALYSIS
The second analysis of bilateral contingency is that which
exists between individual managers in the marketing firm pur-
suing marketing-oriented management, as a strategy of the
entire enterprise, via marketing management, the responsibil-
ity of the marketing function, and their consumers (Figure 5).
The relationships between manager and consumer are main-
tained at this level of analysis by the reciprocal generation
of emotional rewards or satisfactions, particularly pleasure,
arousal,anddominance (Mehrabian and Russell, 1974;seealso
Foxall, 2005).
This hypothesis is supported by the theoretical demonstra-
tion of relationships between felt emotion and operant learning
as well as by empirical work, albeit with consumers, that shows
patterns of emotion to vary consistently and predictably with pat-
terns of reinforcement as defined by the BPM. At the theoretical
level, Rolls (1999) suggests a link between learning and emo-
tional reward by proposing that the stimuli that act as reinforcers
for behavior also function as elicitors of emotional responses. At
the empirical level, there is extensive evidence that consumers
respond to retail and consumption environments rich in util-
itarian reinforcement with pleasure; to those rich in informa-
tional reinforcement with arousal; and to more open settings in
terms of dominance. Moreover, consumer behaviors for a wide
range of such environments (including the time and money con-
sumers spend within them) has been shown to be determined by
these three emotional responses (Foxall, 2011; Foxall et al., 2012;
Yani-de-Soriano et al., 2013). Figure 6 summarizes the results of
research that indicates a unique pattern of emotional reaction is
found for each of the eight BPM-defined contingency categories.
We may reasonably conjecture that the responses of individual
managers to the reward environments they encounter as mem-
bers of marketing firms can also be construed in terms of pleasure
(derived from utilitarian reinforcement), arousal (informational
reinforcement) and dominance (open settings). Although we can-
not base this assumption on direct empirical research as is the
case for consumer behavior, Mehrabian’s theory of emotional
responses to environmental cues (Mehrabian, 1980)providesa
general warrant for drawing the general conclusion that individ-
ual managers’ emotional reactions to their reward environments
are emotionally reinforced.
FIGURE 5 | Bilateral contingency between a manager within the
marketing firm and the firm’s consumerate in terms of emotional
response.
FIGURE 6 | The BPM emotion-contingency matrix. Source: Foxall (2011).
Used by permission. The figure summarizes the research hypotheses and
findings. Studies show that: (i) pleasure scores for contingency categories
(CCs) 1, 2, 3, and 4 each exceed those of CCs 5, 6, 7, and 8; (ii) arousal
scores for CCs 1, 2, 5, and 6 each exceed those of CCs 3, 4, 7, and 8; (iii)
dominance scores for CCs 1, 3, 5, and 7 each exceed those for CCs 2, 4, 6,
and 8. Moreover, (iv) approach–avoidance (aminusa) scores for CCs 1, 2, 3,
and 4 each exceed those for CCs 5, 6, 7, and 8; and (v) approach–avoidance
scores for CCs 1 and 3 each exceed those for CCs 2, 4, 5, 6, 7, and 8. (For
explication, see text and Foxall et al., 2012).
Regarding pleasure, arousal, and dominance as primary
adaptations, it should be possible to identify their neural sub-
strates, their evolutionary significance and their implication in
adaptive behaviors (Mehrabian, 1980). Barrett et al. (2007) con-
firm Mehrabian and Russell’s (1974) judgment that pleasure,
arousal, and dominance are fundamental to the mental repre-
sentation of emotion and relate them to reinforcement and pun-
ishment (see also Russell and Barrett, 1999; Barrett, 2005; Kober
et al., 2008; Lindquist et al., 2012). Mor eover, Panksepp’s (1998,
Frontiers in Human Neuroscience www.frontiersin.org July 2014 | Volume 8 | Article 472
|
100
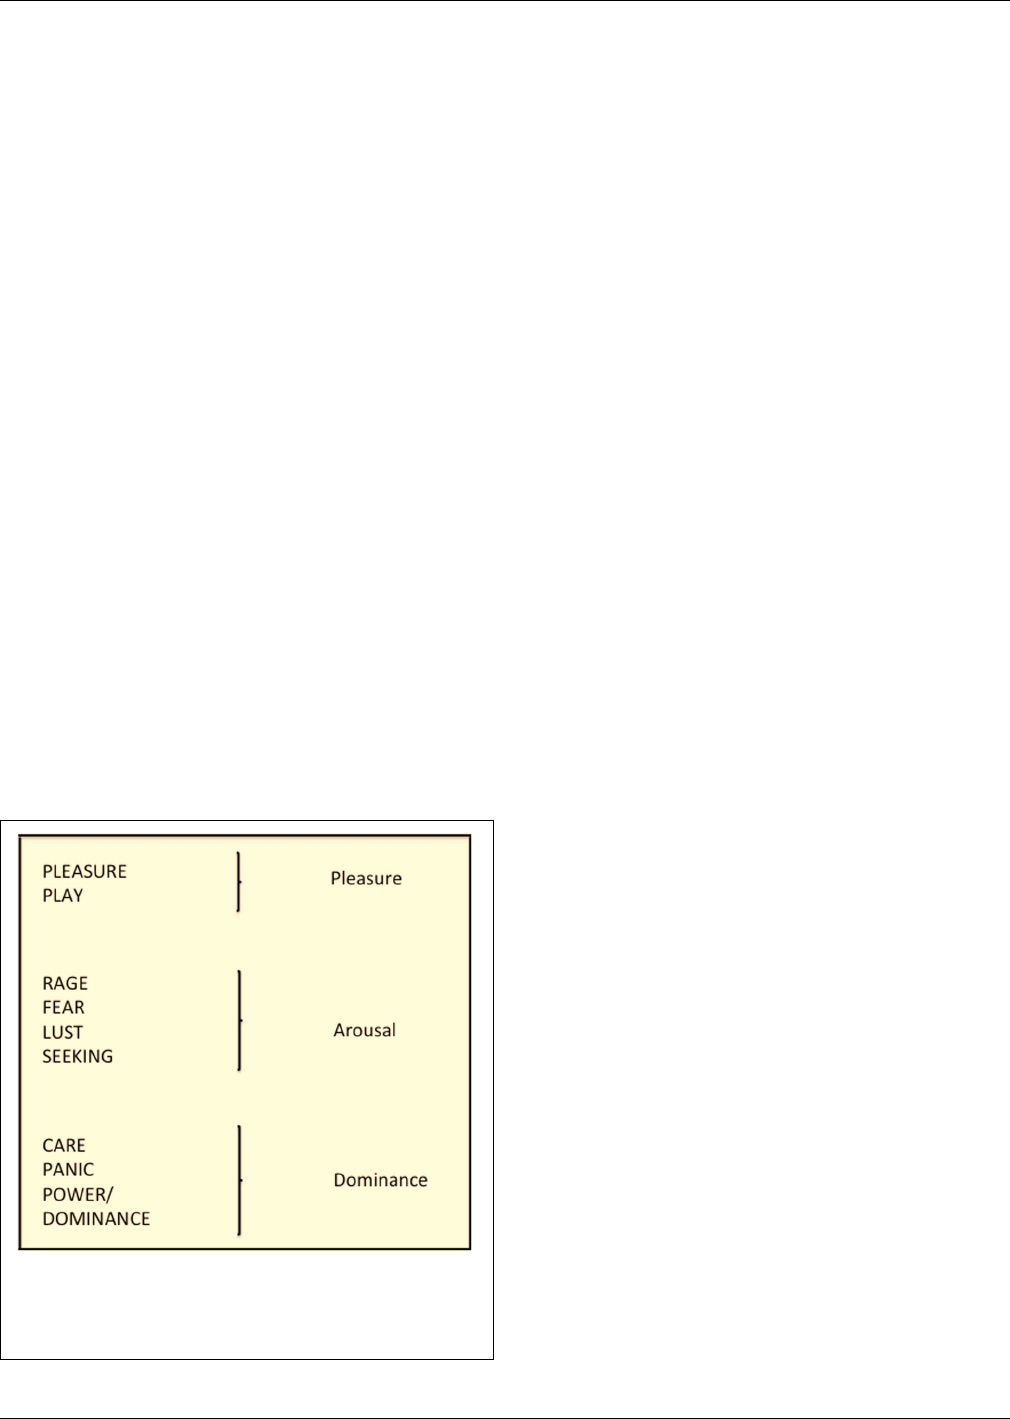
Foxall Organizational neuroscience of bilateral contingency
2005, 2007) seven core emotional systems – SEEKING, RAGE,
FEAR, LUST, CARE, PANIC, PLAY—correspond at a general level
to pleasure, arousal and dominance (Foxall, 2008). Figure 7 pro-
poses a broader classification which incorporates PLEASURE and
POWER/DOMINANCE following the suggestion of Toro n c h u k
and Ellis (2010).
Neurophysiological bases of pleasure, arousal, and dominance
Feelings of pleasure are closely related to the evolutionarily-
based outcomes of biological fitness; moreover, utilitarian or
functional reward promotes the restoration and maintenance
of homeostasis (Panksepp, 1998). Expectation of pleasure also
facilitates goal-orientation by contributing to the setting of objec-
tives (Politser, 2008). The association of the core emotion of
pleasure-displeasure is associated with the utility/disutility of
behavioral consequences (Barrett et al., 2007 ) resulting from
approach/avoidance of specific stimuli. This accords with Rolls’s
(1999) argument that the stimuli that reinforce/punish behavior
evoke emotional feeling. Genetic endowment specifies not par-
ticular behaviors but the goals of classes of behavior by selecting
the stimuli that will reinforce or punish approach and avoidance
(Rolls, 2005).
The allocation of localized brain regions to the production of
emotions is dangerous since the neuronal basis of any particu-
lar source of affect may be distributed (Uttal, 2001; Legrenzi and
Umità, 2011; Lindquist et al., 2012). However, there is evidence
that self-reports of pleasure coincide with increased activity in
the amygdala, orbito-frontal cortex (OFC), and ventromedial pre-
frontal cortex (vmPFC) (Cardinal et al., 2002; Rolls et al., 2009).
Increases in the activation of the ventral tegmental area (VTA),
the subcortical telencephalon areas nucleus accumbens (NAC),
and parts of the ventral striatum (vStr), all well-endowed with
FIGURE 7 | Panksepp’s (1998) seven core emotional systems,
augmented by Pleasure and Power Dominance (after Toronchuk and
Ellis, 2010) and related to Mehrabian and Russell’s (1974) tripartite
classification of emotions.
dopaminergic neurons, are associated with pleasant experiences;
these correlate too with hypothalamus (Hy), vmPFC, and right
OFC activation (Wager et al., 2008). The NAC is closely related
to reinforcement and pleasure. Winkielman et al.(2005 p. 346)
note that “The nucleus accumbens, which lies at the front of the
subcortical forebrain and is rich in dopamine and opioid neu-
rotransmitters, is as famous for positive affective states as the
amygdala is for fearful ones.” While defending the role of NAC
in positive affect, Berridge and Robinson (1998) maintain that the
NAC is implicated in “wanting” a stimulus (know n as its incentive
salience) rather than “pleasure” in obtaining or consuming it.
Moreover, brain areas closely associated with pleasure-
displeasure comprise a region “that is involved in establishing
the threat or reward value of a stimulus” (Barrett et al., 2007,
p. 382). Continuing this theme, Lindquist et al. (2012 p. 124)
employ core affect to refer to “the mental representations of bodily
changes that are sometimes experienced as pleasure and displea-
sure with some degree of arousal,” and argue that it is related
to the identification of and response to motivationally salient
environmental stimuli. Representations of bodily states relies on
previous experience which we may presume to rely, at least in
part, on the outcome of the consequences of operant respond-
ing. Lindquist et al. (2012) concur with Panksepp (1998) that
emotions fulfill a homeostatic function that indicates the value
of approach/avoidance with respect to environmental stimuli.
The neurophysiological bases of arousal are distributed,
though cortical areas and the thalamic regions whose neurons
innervate cortical areas are sensitized in the course of arousing
experience (LeDoux, 1998, 2000, 2003). LeDoux (1998 pp. 287–
291) notes that four systems found in the brain stem are involved
in arousal, each of which generates a different neurotransmit-
ter: acetycholine (ACh), noradrenaline, dopamine, and serotonin.
The amygdala, which is implicated in the production of danger
signals, and the nucleus basalis, the latter a repository of ACh, are
particularly relevant. Lesioning of either reduces the capacity of
fear stimuli to engender arousal; stimulation of either generates
cortical arousal (LeDoux, 1998, p. 289). In response to arous-
ing stimuli, the amygdala induces the nucleus basilis to release
ACh throughout the cortex. Emotional stimuli in particular pro-
duces substantial arousal (as compared with the limited arousal
engendered by any novel stimulus), an observation that LeDoux
ascribes to the involvement of the amygdala.
The hormones, oxytocin, and testosterone, also play a part in
regulating fear and aggression as well as nurturance and affilia-
tion. The neurotransmitter, serotonin contr ibutes to the reduc-
tion of anxiety, so that the reduction of CNS serotonin impairs
impulse control and is implicated in violence, impatience, and
the assumption of risks of punishment or injury (Higley et al.,
1996). The administration of serotonin by means of selective sero-
tonin reuptake inhibitor (SSRI) medication modulates antisocial
tendencies (Knutson et al., 1998). While dopamine has a gen-
eral role in the anticipation of rewarded behavior, it may have
a particular affinity with behavior that eventuates in (reported)
arousal since it is associated with excitement, engagement, and the
involved pursuit of primary reinforcers. It is, moreover, involved
in energizing higher motor cortex areas on which SEEKING relies
(Panksepp, 1998).
Frontiers in Human Neuroscience www.frontiersin.org July 2014 | Volume 8 | Article 472
|
101

Foxall Organizational neuroscience of bilateral contingency
In their analyses of the role of dopamine release in learn-
ing, Berridge and Robinson (1998, 2003) refer to both a hedo-
nic or affective outcome (denoting “liking” or pleasure) and
a motivational element (suggestive of “wanting” or incentive
salience). Liking is associated with opioid tr ansmission on to
GABAergic neurons in the nucleus accumbens (Winkielman
et al., 2005). Wanting or incentive salience is a separate pro-
cess, more likely associated with dopamine release and retention.
Hence, far from being the “pleasure chemical” it has often been
identified as, dopamine is neither necessary nor sufficient for
“liking.” Manipulation of the dopamine system does, however,
change motivated behavior by increasing instrumental responses
and the consumption of rewards; incentive salience is a moti-
vational rather than an affective component of reward that
transforms neutral stimuli into compelling incentives (Robinson
and Berridge, 2003; Berridge, 2004). In line with Berridge’s
(2000) argument that liking and wanting should be separated,
Toronchuk and Ellis (2010) contrast PLEASURE which is rel-
evant to consummatory behaviors and associated with opioid
and GABA release, and Panksepp’s (1998) SEEKING which is
associated with dopamine release and which marks appetitive
responses. This dichotomy is well-accommodated to the distinc-
tion drawn here since the wanting which is inherent in SEEKING
is indicated by arousal rather than pleasure.
Dominance is an emotional response that v aries as the
consumer or managerial behavior setting permits a degree of
autonomy or induces conformity by the number of behavioral
alternatives it offers. It relates to autonomy and agency, and con-
trasts with submissiveness and harmoniousness (Barrettetal.,
2007). Prosocial behavior and affiliation are associated with
dopamine; opioids, with sociability; while the neuropeptide oxy-
tocin increases feelings of trust (Panksepp, 2007). Both serotonin
and testosterone are associated with feelings of dominance (Buss,
2004, 2005; Cummins, 2005). The relationship between domi-
nance and the BPM resides in a tendency of consumers to report
high levels of this emotional response as well as higher levels
of pleasure in relation to more open settings. These are settings
which offer a larger number of behavioral outcomes, and which
are usually under the control of the consumer rather than an
external agent like a marketer or government office. In the case
of managerial behavior, dominance is also likely to be felt to
an increased extent in situations that p ermit autonomous and
multifaceted activity.
In a paper that positively reviews the evidence for a model
of emotionality that includes dominance as well as pleasure and
arousal, Demaree et al. (2005 p. 3) propose that “relative left-
and right-frontal activation (may be) associated with feelings of
dominance and submissiveness, respectively.”
Barrett et al. (2007) make a strong contribution to under-
standing the inter-relationships among pleasure, arousal, and
dominance by proposing that arousal and dominance signify the
content of core emotion or v alence. The first of Barrett et al.’s
sources of the content of valence, arousal-based content, denotes
activeness and is revealed in self-reports of feeling active, attentive
or wound-up, while unarousal, denoting stillness, is revealed in
self-reports of feeling still, quiet and sleepy. Linking to Mehrabian
and Russell’s concept of arousal this active—still emotionality is
an affective response to the presentation informational reinforce-
ment. Bar rett et al.’s second source of valence-content, relational
content, concerns the extent of domination or submissiveness
experienced in the presence of others: this social dimension of
emotional reaction is redolent of the scope of the consumer’s
or manager’s behavior setting. Finally, Barrett et al.’s situational
source of content indicates the degree of novelty or unexpect-
edness of a situation, its contribution to or hindrance of an
objective, and its consonance with norms and values. This too is
suggestive of setting scope.
Emotional utility function
The manager, like the consumer, is assume
4
to maximize the com-
bined consumption of pleasure, arousal and dominance so that
his/her utility function is
U
(P,A,D)
= P
a
, A
b
, D
c
(2)
where U is the total amount of utility obtained by consumption
of pleasure, arousal and dominance, P is the quantity of plea-
sure consumed, A is the quantity of arousal consumed, D is the
quantity of dominance consumed, and a, b and c are empirically
determined parameters such that a + b + c = 1.
Bilateral contingency and emotion
We assume that managers experience pleasure, arousal, and dom-
inance as a result very largely of inputs of informational rein-
forcement which relate to symbolic representations of the success
of market mix implementation in the market place. Sales figures
and profitability manifest in pleasure insofar as they relate to the
enhancement of the resource base of the enterprise; in arousal
insofar as they refer to the achievement of a higher corporate rep-
utation; and dominance insofar as they reflect greater autonomy
of the firm in the capacity to meet its goals, raise capital. Over and
above the specific rewards provided to managers, such as higher
salaries and promotions, these corporate-level enhancements may
result in managerial emotional responses. By comparison with
salary and promotion, they derive relatively directly from the
relationships of the firm with its customer base.
The chief medium through which managers directly receive
emotional reward as a result of profitably fulfilling consumers’
requirements is necessarily in the form of informational rein-
forcement (though if they are recompensed by bonus payments
or commissions that are based on levels of sales, they also receive
utilitarian reinforcement as a direct result of responding to con-
sumer demand, and in a rationally functioning firm, they will
presumably so benefit through salary adjustments and promo-
tions in a somewhat indirect fashion). How is it possible for
informational reinforcement, which we have previously identi-
fied with arousal, to give rise to all three emotions considered
by Mehrabian and Russell (1974)? The version of the BPM that
4
Whether managers’ utility functions can be represented in this way remains
an issue for empirical research, of course, though work in progress by
the Consumer Behavior Analysis Research Group at Cardiff University and
Consuma a t the University of Brasilia is seeking to establish the fact of the mat-
ter for both consumers and managers. In the meantime, Equation (2) remains
an assumption.
Frontiers in Human Neuroscience www.frontiersin.org July 2014 | Volume 8 | Article 472
|
102
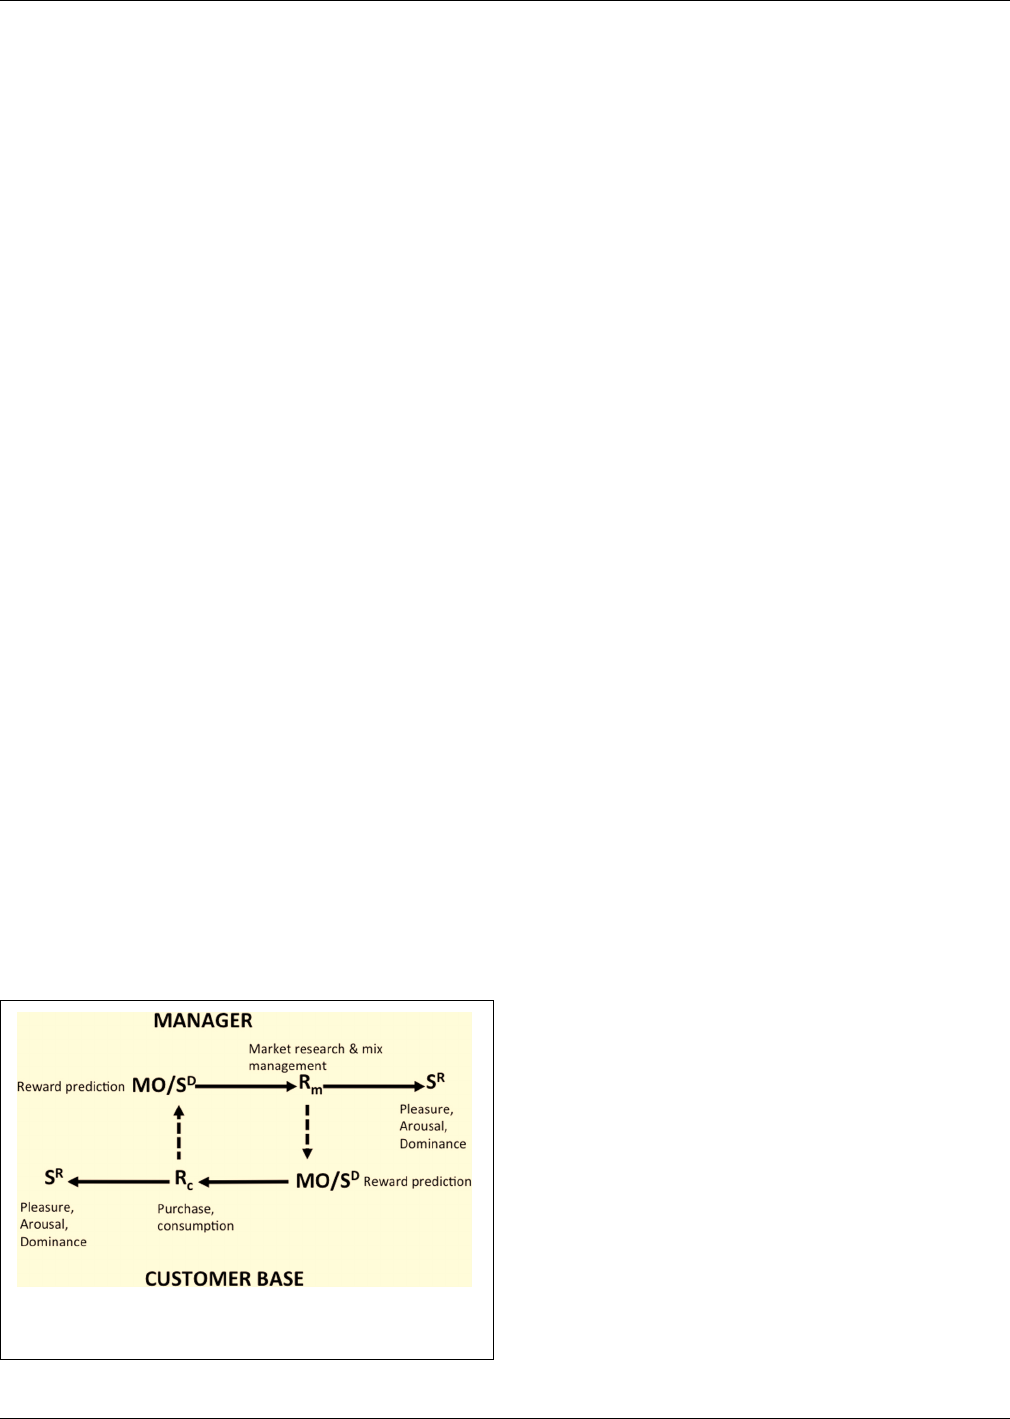
Foxall Organizational neuroscience of bilateral contingency
has thus far been the subject of this paper presents its variables
in extensional terms; but there are also versions of the model that
employ intentional and cognitive variables in order to continue
explanation beyond that possible for the extensional portrayal of
consumer choice (Foxall, 2007a).
Informational reinforcement, as it is conceptualized in the
purely extensional depiction of the BPM, consists in the audi-
tory, visual, and other sensory elements that act as reinforcers
for operant behavior. In the cognitive depiction of the BPM,
without making any ontological adjustments about the nature
of informational reinforcement, we understanding it in terms
of symbolic reinforcement which has its effect on behavior by
virtue of its cognitive and affective functions. It is because we
are considering, at the cognitive and affective level, informa-
tional reinforcement to be a source of symbolic reinforcement
that we can conceptualize the manager’s utility function in terms
of utilitarian reinforcement and informational reinforcement as
represented symbolically (Foxall, 2013).
NEUROECONOMIC ANALYSIS
The third level of bilateral contingency is that obtaining
between individual marketing managers and the firm’s con-
sumerate depicted as reciprocally generating reward predictions
which engender behaviors that reinforce one another’s conduct
(Figure 8). The ways in which the imminence of rewards is sig-
naled to managers by the behaviors of the consumerate and
vice versa may be depicted in terms of “RPEs” between the
expected rewards and the actual rewards achieved (Schultz et al.,
1997). These signals, which form a strong core of neuroeconomic
analysis (Glimcher, 2011) are discussed in detail below after a dis-
tinction is made between two styles of neuroeconomics and their
relative relevance to the analysis of bilateral contingency.
Modes of neuroeconomic analysis
The role of neuroeconomics in explanation requires elaboration.
Ross (2008) distinguishes two styles of neuroeconomics, which he
terms behavioral economics in the scanner and neurocellular eco-
nomics. Behavioral economics in the scanner (BES) is depicted
by Ross as stemming from the dissatisfaction of some behavioral
economists with neoclassical microeconomics who, he argues,
FIGURE 8 | Bilateral contingency between the marketing firm and its
consumerate in terms of reward prediction error.
attempt to substitute psychological findings and reasoning for
standard economic analysis. He argues that BES is “naively reduc-
tionist” and denies economics the right to model its subject mat-
ter abstractly, something permitted of other sciences. BES simply
performs repetitions of standard behavioral-economic experi-
ments such as the ultimatum game, the Prisoner’s Dilemma,
and intertemporal choice protocols used to access consumers’
discounting of future outcomes during the observation of par-
ticipants’ brain functions v ia fMRI procedures. It is neurocellular
economics that is of relevance to the current project. We can depict
BES as a form of biology in the service of economics.
Neurocellular economics (NE), by contrast, is economics in
the service of biology. It employs the models derived by mathe-
matical economics, especially those of constrained maximization
and equilibrium analysis, to represent brain structures and func-
tions. The underlying assumption is that brains, like markets,
are “massively distributed information-processing networks over
which executive systems can exer t only limited and imperfect
governance.” NE is an approach to neuroeconomics that uses
economic analysis to understand the neurobiology underpinning
economic behavior (Glimcher, 2011). It is NE that is of primary
relevance to the analysis of bilateral contingency since we are
attempting here to establish the ways in which the behavior of
other actors in the economic system impinge on the neuronal
activity of consumers and managers respectively and prime them
for the receipt of reinforcing or punishing outcomes of their own
behaviors.
Reward prediction error
It has long been suspected, on the basis of experiments in which
monkeys receive food rewards while the activity of dopaminergic
neurons in the VTA is recorded (Schultz, 1992), that dopamin-
ergic neurons code reinforcement (Robbins and Everitt, 2002).
The responding of these cells to food rewards which takes place
in phasic bouts is transferred, after the establishment of predic-
tive stimuli, to those stimuli: the dopaminergic neurons respond
to the CS rather than to the reward. Moreover, should the reward
not appear, the activity of the dopaminergic neuron (which is
recorded at the level of the individual cell) is depressed precisely
when the reward was predicted to occur. As Robbins and Everitt
(2002, p. 174) point out, this is indicative that the dopamin-
ergic activity is implicated in the establishment of an internal
representation of the reward (Montague et al., 1996).
RPE is the difference between a reward actually obtained and
that which was predicted or expected. A negative RPE results
when the reward is predicted but not obtained; a positive RPE,
when a reward is not expected but is nevertheless obtained
(Schultz et al., 1997). The reason why this subject has assumed
such prominence in neuroeconomics is the possibility that RPEs
may be reflected in dopaminergic neurons’ firing rates. If so, the
mechanism suggests an obvious linkage between neoclassical eco-
nomics and neuroscience that is fundamental to the emerging
discipline of neuroeconomics. In the present context, it adds to
the explanatory power of operant psychology by proposing an
underlying causal connexion (Glimcher, 2011).
While, in Pavlovian learning, the predictive significance of
a signal (CS) for the arrival of a reinforcer is paramount, in
Frontiers in Human Neuroscience www.frontiersin.org July 2014 | Volume 8 | Article 472
|
103

Foxall Organizational neuroscience of bilateral contingency
operant learning, which is the principal paradigm we are using
to interpret the behaviors of the marketing firm and its con-
sumers, signals (S
D
s or MOs) influence the rate of repetition of
a response that has previously led reliably to gaining the rein-
forcer (Schultz and Dickinson, 2000; Daw, 2013; Daw and Tobler,
2013). Associationism, which embraces both of these learning
paradigms, argues that both involve the establishment of an asso-
ciation between the representations of either a signal (Pavlovian
conditioning) or a response (operant conditioning) and the rein-
forcer. The procedure in which the association is formed requires
that the reinforcer follow closely and reliably on the presentation
of either the signal or the response, such that each repetition of
the signal or response leading to the reinforcer strengthens the
association (Schultz and Dickinson, 2000;seealsoSchultz, 2010).
The key determinant of whether a signal engenders learning,
however, is not its simple presentation but its being unpredicted,
novel or surprising (Di Chiara, 2002). The extent to w hich a stim-
ulus is unpredicted is shown by means of a prediction error term,
(λ − V),where λ is the strength of association with the rein-
forcer that predicts fully the occurrence of the reinforcer, and
V is the combined associative strength of all signals present on
the learning episode in question. The prediction error (λ − V)
indicates the extent to which the appearance of the reinforcer is
novel, surprising, unpredicted or unexpected.
Schultz and Dickinson (2000) draw two conclusions from
this which are relevant to the present discussion of bilateral
contingency. The first concerns the evocation of emotions by
the reinforcers and punishers resulting from operant learning,
as posited by Rolls’s (1999) theory of emotion. Schultz and
Dickinson (2000) definelearningasacquiringpredictionsofout-
comes whether these take the form of “reward, punishment,
behavioral reactions, external stimuli, internal states” (p. 476).
Internal states include emotions; hence, the reinforcing stimuli
that evoke emotion-feelings may also predict those feelings.
The second is Schultz and Dickinson’s proposal of a sort of
homeostatic principle by which behavioral outcomes that pro-
duce a mismatch (prediction error) between expected and actual
reward alter subsequent behavior so as to reduce the gap between
outcome and prediction. By explaining how behavior is mod-
ified in light of experience, this appears to be a mechanism
for reinforcement. It explains how behavior is modified in light
of experience. The process of behavior modification continues
until the prediction er ror is zero at which point the discrepancy
between expected/predicted reinforcement and actual reinforce-
ment is eliminated. The outcome occurs exactly as predicted.
This process, in line with blocking, confines learning to stimuli
that predict unexpected/surprising/novel events, and eliminates
learning with respect to redundant stimuli. This reasoning is
very much in line with behavioral/operant learning and provides
a neurophysiological explanation of learning. In instrumental
or operant learning, the response manifests an expectation of
reward; when the prediction is falsified by the occurrence of an
unpredicted or not-fully-predicted reward (or a punisher), there
is a RPE which influences future predictions and behaviors. This,
of course, is the essence of operant learning. RPEs thus influence
reinforcers, punishers, external signals such as attention-inducing
stimuli, and behavioral goals/targets.
The import of RPEs in the current analysis is that they link
consumer and managerial behaviors by showing how each relies
on signals from the other as to the impending consequences of
behavior; these signals may functions as discriminative stimuli or
MOs for further response.
LEVELS OF ANALYSIS REVISITED
FEASIBLE AND INFEASIBLE LEVELS OF ANALYSIS
The grounds on which both organizations and their separate
members may be understood as contextual systems are as follows.
Each manager’s behavior is constrained by the behavior setting
in which he/she works and by the pattern of reinforcement avail-
able to him/her. The manager’s behavior setting scope/dominance
is determined to some extent by his/her ability to manage the
structure of this pattern of reinforcement and the scope of the
behavior setting, and by his/her ability to influence other man-
agers’ setting scope and pattern of reinforcement. But we can
also speak of the corporate behavior setting and of the pattern
of reinforcement that follows from the delivery of corporate out-
puts (in terms of marketing mixes) to the marketplace (Ve l la and
Foxall, 2011, 2013). The corporate behavior setting is composed
of the strategic scope of the firm, predominantly its product-
market matrix which defines the kind of organization it is, its
purpose, the nature of its customer base and therefore the wants
it is attempting to fulfill. It will also embrace the firm’s overall
policies, goals and objectives, and, following its resource audit,
its capabilities, all of which determine the way in which it views
novel opportunities and dangers as signaled by the marketplace
and comparative competitive advantages. The reception its mar-
keting mixes receive from customers determines the success of
the firm and thus the extent to which its overall behavior pattern
remains constant (providing similar marketing mixes) or changes
(devising new or modified mixes). The two aspects are related in
that success or failure in the marketplace may lead to a reassess-
ment of the firm’s scope and a consolidation of or change in its
strategic direction (Foxall, 2014b).
What these examples have in common is that they relate indi-
vidual human behavior, which is a personal level phenomenon, to
the super-personal level of environmental contingencies which in
each case are observable and measurable; the pattern or sequence
of such contingencies can, therefore, be related systematically to
the pattern or sequence of individual behavior; the behavior can
then be presented as a function of its consequences. The result is a
functional explanation of molar patterns of behavior that invokes
the correlational law of effect (Baum, 1973). The behavior of the
firm as a whole, i.e., the emergent generation of a marketing mix,
is by definition not a personal level phenomenon. We may desig-
nate it supra-personal insofar as it is different from, greater than,
over-and-above the combined behaviors of the members of the
firm.Thefortunesofthefirm,aswehaveargued,dependonthe
reinforcing and punishing consequences of such behavior which
in turn rely on the reception the marketing mix receives from
the consumerate. Such organizational behavior depends at some
level on the neurophysiological events responsible for the behav-
ior of the fir m’s individual members, just as it depends on those
managers’ behavior being reinforced and punished by its imme-
diate consequences that determine the success or failure of each
Frontiers in Human Neuroscience www.frontiersin.org July 2014 | Volume 8 | Article 472
|
104
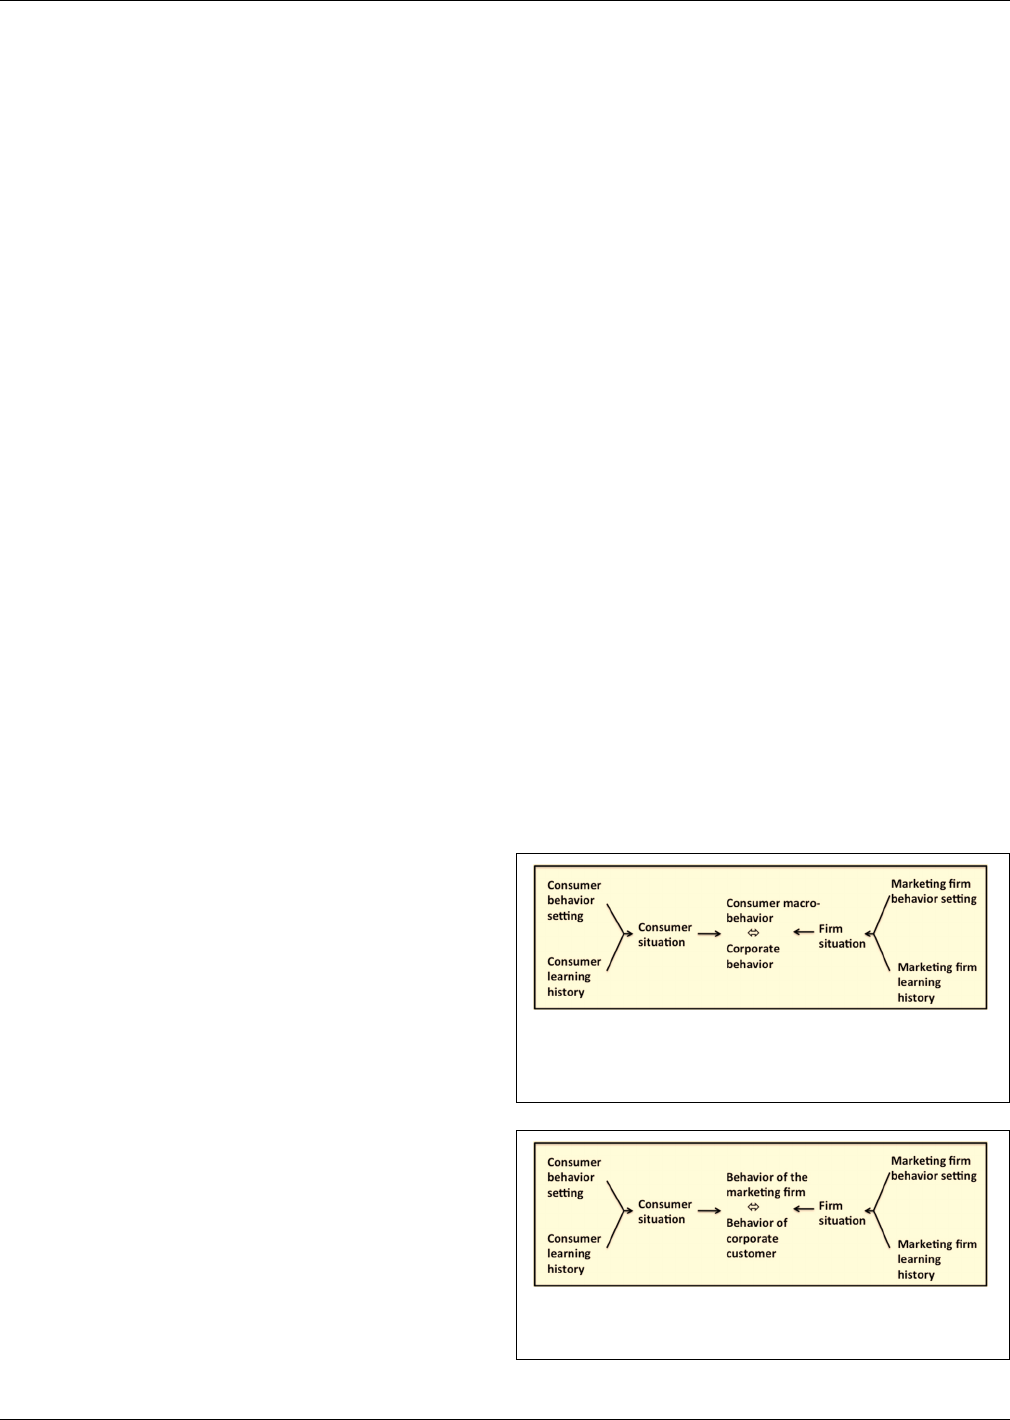
Foxall Organizational neuroscience of bilateral contingency
manager. But there is no justification for ascribing a neurophys-
iological level of analysis to the organization. There is no way
of combining or averaging the neurophysiolog ical events of each
manager to produce a composite measure that would explain the
behavior of the organization. There is no bilateral contingency
that links firm level behavior with that of the consumerate via
meaningful neurophysiological mechanisms. All of the relevant
interactions between firm and consumerate, i.e., those that pre-
dict and explain the behaviors of each, can be described at the
supra-personal level (in the case of the fir m) and the personal
level (in the consumerate).
However, we can isolate a useful mode of explanation in terms
of the emotional rewards that individual managers and individual
consumersreceive,eachasaresultofthebehavioroftheother.
There is another useful explanatory mode at the level of neu-
roeconomic RPEs that result for managers from the behaviors of
consumers and for consumers from those of managers. The man-
agerial behavior that influences consumer choice may actually be
that of the firm.
A FRAMEWORK FOR RESEARCH
The chief implications of the foregoing for organizational neu-
roscience lies in clarification of the kinds of investigation that
can reasonably be conducted within this emerging framework of
conceptualization and analysis. The argument is that neurophys-
iological explanation, in contrast to that of operant psychology,
cannot be extended beyond the individual. This means that,
although operant psychology may find an expression in the study
of supra-individual systems such as organizations like the firm,
this mode of investigation is denied to organizational neuro-
science. The chief implication for the development of consumer
behavior analysis and the concept of the marketing firm is that
the super-personal level of analysis, in which the behavior of the
firm is understood in terms of the effects that its emergent outputs
(notably marketing mixes) have had on its primary environment,
namely its consumerate, may be underpinned by organizational
neuroscience as long as this is confined to the behavioral implica-
tions for individual managers and consumers and not abstracted
to the organizational level of analysis. All of the modes of analysis
advocated here can be supported by the identification of bilateral
contingencies that closely link the behaviors of the transacting
parties via observable and operational variables; those which have
not been supported by the foregoing analysis are not realized in
bilateral contingencies.
At the supra-personal level of exposition, firms’ behaviors can
be identified in terms of the marketing mix elements they intro-
duce to the market (and these, in turn, can be t raced back
to their marketing intelligence procedures, their goal-formation
through strategic audits of their comparative capabilities and the
opportunities of the marketplace, their st rategic and marketing
planning, the devising and implementation of their marketing
mixes). The fortunes of these marketing mixes can be ascer-
tained through analysis of their impacts on sales and profitability.
These are not easy measures to obtain in practice but attempts
to secure them form part of the feedback mechanisms on which
firms rely. It is feasible at this level of analysis to identify a
firm-level behavior setting and learning history, and therefore a
firm-level situation; the behavior att ributable to this corporate
situation has implications for the behavior of the firm’s con-
sumerate whether this comprises a mass of individual consumers
whose collective actions amount to what Biglan and Glenn (2013)
nominate macro-behavior (Figure 9) or one or more corporate
customers the behavioral outputs of which can be characterized
as metacontingency (Figure 10)
The equivalent of supra-contingency at the level of the indi-
vidual consumer or manager is the super-personal level of expla-
nation. Super-contingency refers to the control of an individual’s
behavior by contingencies of reinforcement, the operant con-
ditioning paradigm exemplified by the three-term contingency.
Although this level of exposition stands alone as a means of
predicting individual behavior, especially in the relatively closed
settings of the operant chamber, its explanatory power may be
extended by considering the sub-personal, neuronal, ramifica-
tions of operant reinforcement. As the earlier discussion shows,
the receipt of reinforcers is mediated by RPEs and leads to emo-
tional reactions that reflect the pattern of reinforcement. At the
super-personal level of exposition, both consumer and manage-
rial behavior can be associated with patterns of rewards and
punishments: a large body of research on the BPM has established
this for consumer behavior and a far larger range of research
studies have endorsed the principle for managers.
At the personal level of exposition, intentional idioms may be
ascribed in the explanation of behavior as long as the ascription
is limited so as to be consonant with empirical research findings
at the super-personal and sub-personal levels (see Foxall, 2004,
2007a,b, 2013). This personal level of exposition differs from
the other levels in providing an interpretation of behavior that
employs intention idioms rather than the extensional language
of science. That is, it proceeds in terms of beliefs and desires,
emotion-feelings and perceptions that are necessary to render the
FIGURE 9 | Bilateral contingency between the marketing firm as a
metacontingency and the macro-behavior of the consumerate of final
buyers.
FIGURE 10 | Bilateral contingency between the marketing firm as a
metacontingency and a corporate customer as a metacontingency.
Frontiers in Human Neuroscience www.frontiersin.org July 2014 | Volume 8 | Article 472
|
105

Foxall Organizational neuroscience of bilateral contingency
FIGURE 11 | Bilateral contingency between the individual manager and
the individual consumer.
behavior intelligible. Intentional exposition is used when exten-
sional language no longer suffices to provide an understanding
of behavior, principally when the stimuli responsible for behav-
ior cannot be identified. The super-personal and sub-personal
levels of exposition are integral to this personal level since they
are instrumental in the creation and support of the intentional
idioms that enter into personal level interpretation. Hence, in the
context of neuropsychology, the sub-personal level of exposition
involves the neurophysiological events that enter i nto interpre-
tations of behavior in intentional and decision-making terms
(Dennett, 1969; Foxall, 2007b,c).
The affect-reward and neuroeconomic levels of analysis intro-
duced in this paper involve the super-personal, personal, and sub-
personal levels of exposition. They refer to the behavior of single
individuals rather than to organizational behavior (Figure 11)
CONCLUSIONS
This paper has sought to understand the managerial mechanisms
that facilitate the operation of the marketing firm by enhancing
its exchange relationships with its customer base. Drawing on the
TMF, it was suggested that the characterization of the parties to
this bilateral transaction can be depicted as contextual systems,
their behavior being explained in terms of the consequent prod-
ucts of the marketing firm and the customer base. The concept
of bilateral contingency, which has been employed to describe the
relatedness of the participants in marketing transactions to one
another (Foxall, 1999a), is of value in emphasizing the intercon-
nectedness of behavior systems that make up the marketplace.
The various levels of analysis that have been considered suggest
guidelines for the degree of abstraction with regard to rela-
tionships based on neurophysiological events can be justified in
organizational neuroscience. The overall conclusion is that while
firms and other organizations may be treated, by virtue of their
generating outputs that are over and above the consequences of
the behaviors of individual managers or their cumulative behav-
ioral outputs, as contextual systems, only individual behavior may
legitimately be explained by reference to a neurophysiological
sub-personal level. Both individual organisms and human organi-
zations may be treated as contextual systems but only the former
constitute neurophysiological systems.
Future research on the marketing firm and bilateral contin-
gency could usefully examine the role of the neuronal basis of
cooperative behavior and trust as they are related to both intra-
firm and extra-firm relationships. It would be particularly useful
to understand better how trust and cooperation vary between (a)
firm ⇔ firm relationships and (b) those linking the fir m and final
consumers.
REFERENCES
Barrett, L. F. (2005). “Feeling is perceiving: core affect and conceptualization in the
experience of emotion,” in Emotion and Consciousness, eds L. F. Barrett, P. M.
Niedenthal, and P. Winkielman (New York, NY: Guilford). 255–284.
Barrett, L. F., Mesquita, B., Ochsner, K. N., and Gross, J. J. (2007).
The experience of emotion. Ann. Rev. Psychol. 38, 173–401. doi:
10.1146/annurev.psych.58.110405.085709
Baum, W. (1973). The correlational law of effect. J. Exp. Anal. Behav. 20, 137–153.
doi: 10.1901/jeab.1973.20-137
Becker, W. J., and Cropanzano, R. (2010). The Organizational neuroscience: The
promise and prospects of an emerging discipline. J. Org. Behav. 31, 1055–1059.
doi: 10.1002/job.668
Berridge, K. C. (2000). “Reward learning: reinforcement, incentives, and expecta-
tions,” in The Psychology of Learning and Motivation, Vol. 49, ed D. L. Medin
(San Diego, CA: Academic Press), 223–278.
Berridge, K. C. (2004). Motivation concepts in behavioural neuroscience. Physiol.
Behav. 81, 179–209. doi: 10.1016/j.physbeh.2004.02.004
Berridge, K. C., and Robinson, T. E. (1998). What is the role of dopamine in
reward: Hedonic impact, reward learning, or incentive salience? Brain Res. Re v.
28, 309–369. doi: 10.1016/S0165-0173(98)00019-8
Berridge, K. C., and Robinson, T. E. (2003). Parsing reward. Trends Neurosc i. 26,
507–512. doi: 10.1016/S0166-2236(03)00233-9
Biglan, A., and Glenn, S. S. (2013). “Toward prosocial behavior and environ-
ments: behavioral and cultural contingencies in a public health framework,”
in APA Handbook of Behavior Analysis, Vol. 2, eds G. J. Madden, W. V. Dube,
T.D.Hackenberg,G.P.Hanley,andK.A.Lattal(Washington,DC:American
Psychological Association), 255–275.
Buss, D. M. (2004). Evolutionary Psychology. Boston, MA: Pearson.
Buss, D. M. (ed.). (2005). The Handbook of Evolutionary Psychology.Hoboken,NJ:
Wiley.
Butler, M. J. R., and Senior, C. (2007a). Toward an organizational cognitive
neuroscience. Ann. N.Y. Acad. Sci. 1118, 1–17. doi: 10.1196/annals.1412.009
Butler, M. J. R., and Senior, C. (2007b). Research possibilities in organi-
zational cognitive neuroscience. Ann. N.Y. Acad. Sc i. 1118, 206–211. doi:
10.1196/annals.1412.010
Caldú, X., and Dreher, J.-C. (2007). Hormonal and genetic influences on pro-
cessing reward and social information. Ann. N.Y. Acad. Sci. 1118, 43–73. doi:
10.1196/annals.1412.007
Caplin, A., and Glimcher, P. (2013). “Basic methods from neoclassical economics,”
in Neuroeconomics: Decision Making and the Brain, 2nd Edn., eds P. W. Glimcher
andE.Fehr(NewYork,NY:AcademicPress),3–17.
Cardinal, R. N., Parkinson, J. A., Hall, J., and Everitt, B. J. (2002). Emotion and
motivation: the role of the amygdala, central striatum, and prefrontal cortex.
Neurosci. Biobehav. Rev. 26, 321–352. doi: 10.1016/S0149-7634(02)00007-6
Coase, R. H. (1937). The nature of the firm. Economica 4, 386–405. doi:
10.1111/j.1468-0335.1937.tb00002.x
Cummins, D. D. (2005). “Dominance, status, and social hierarchies,” in The
Handbook of Evolutionary Psychology, ed D. M. Buss (Hoboken, NJ: Wiley),
676–697.
Daw, N. D. (2013). “Advance reinforcement learning,” in Neuroeconomics: Decision
Making and the Brain, 2nd Edn., eds P. W. Glimcher and E. Fehr (New York, NY:
Academic Press), 299–320.
Daw, N. D., and Tobler, P. N. (2013). “Value learning through reinforcement: the
basics of dopamine and reinforcement learning,” in: Neuroeconomics: Decision
Making and the Brain, 2nd Edn., eds P. W. Glimcher and E. Fehr (New York, NY:
Academic Press), 283–298.
Demaree, H. A., Everhart, D. E., Youngstrom, E. A., and Harrison, D. W.
(2005). Brain lateralization of emotional processing: historical roots and a
future incorporating:dominance. Behav. Cogn. Neurosci. Rev. 4, 3–20. doi:
10.1177/1534582305276837
Dennett, D. C. (1969). Content and Consciousness. London: Routledge and
Kegan Paul.
Di
Chiar
a, G. (2002). “Dopamine and reward,” in Dopamine in the CNS II, ed G.
Di Chiara (Berlin: Springer), 265–319. doi: 10.1007/978-3-662-06765-9_10
Drucker, P. (2007). The Practice of Management, 2nd Edn. London: Routledge.
Frontiers in Human Neuroscience www.frontiersin.org July 2014 | Volume 8 | Article 472
|
106

Foxall Organizational neuroscience of bilateral contingency
Fagerstrøm, A. (2010). The motivating effect of antecedent stimuli on the web
shop: a conjoint analysis of the impact of antecedent stimuli at the point of
online purchase. J. Org. Behav. Manage. 30, 199–220. doi: 10.1080/0160806100
3756562
Fagerstrøm, A., Foxall, G. R., and Arntzen, E. (2010). Implications of motivat-
ing operations for the functional analysis of consumer behavior. J. Org. Behav.
Manage. 30, 110–126. doi: 10.1080/01608061003756331
Foxall, G. R. (1981). Strategic Marketing Management. London: Croom Helm.
Foxall, G. R. (1990/2004). Consumer Psychology in Behavioral Perspective.NewYork,
NY: Routledge. Reprinted 2004: Frederick, MD: Beard Books.
Foxall, G. R. (1999a). The marketing firm. J. Econ. Psychol. 20, 207–234. doi:
10.1016/S0167-4870(99)00005-7
Foxall, G. R. (1999b). The contextual stance. Philos. Psychol. 12, 25–46. doi:
10.1080/095150899105918
Foxall, G. R. (2004). Context and Cognition: Interpreting Complex Behavior. Reno,
NV: Context Press.
Foxall, G. R. (2005). Understanding Consumer Choice. London;NewYork:Palgrave
Macmillan. doi: 10.1057/9780230510029
Foxall, G. R. (2007a). Explaining Consumer Choice. London;NewYork:Palgrave
Macmillan. doi: 10.1057/9780230599796
Foxall, G. R. (2007b). Explaining consumer choice: coming to terms with inten-
tionality. Behav. Process. 75, 129–145. doi: 10.1016/j.beproc.2007.02.015
Foxall, G. R. (2007c). Intentional behaviorism. Behav. Philos. 35, 2007, 1–56.
Foxall, G. R. (2008). Reward, emotion and consumer choice: from neuroeconomics
to neurophilosophy. J. Consum. Behav. 7, 368–396. doi: 10.1002/cb.258
Foxall, G. R. (2010). Interpreting Consumer Choice: The Behavioral Perspective
Model. New York, NY: Routledge.
Foxall, G. R. (2011). Brain, emotion and contingency in the explanation of
consumer behaviour. Int. Rev. Indust. Organ. Psychol. 26, 47–92.
Foxall, G. R. (2013). Intentionality, symbol, and situation in the interpretation of
consumer choice. Market. Theory 13, 105–127. doi: 10.1177/1470593112467270
Foxall, G. R. (2014a). Consumer Behavior Analysis and the Marketing Firm: Bilateral
Contingency in the Context of Environmental Concern, Invited Presentat ion at
the Association for Behavior Analysis International Seminar on Leadership and
Cultural Change (Chicago).
Foxall, G. R. (2014b). Cognitive requirements of competing neuro-behavioral deci-
sion systems: some implications of temporal horizon for managerial behavior in
organizations. Front. Neurosci. 8:184. doi: 10.3389/fnhum.2014.00184
Foxall, G. R., Oliveira-Castro, J. M., and Schrezenmaier, T. C. (2004). The behav-
ioral economics of consumer brand choice: patterns of reinforcement and utility
maximization. Behav. Process. 65, 235–260. doi: 10.1016/j.beproc.2004.03.007
Foxall, G. R., Yan, J., Oliveira-Castro, J. M., and Wells, V. K. (2013). Brand-related
and situational influences on demand elasticity. J. Business Res. 66, 73–81. doi:
10.1016/j.jbusres.2011.07.025
Foxall, G. R., Yani-de-Sor iano, M., Yousafzai, S., and Javed, U. (2012). “The role
of neurophysiology, emotion and contingency in the explanation of consumer
choice,” in Handbook of Developments in Consumer Behaviour, eds V. K. Wells
and G. R. Foxall (Cheltenham; Glos; Northampton: Edward Elgar), 461–522.
Glenn, S. S. (1991). “Contingencies and metacontingencies: relations among
behaviorl, cultural, and biological evolution,” in Behavioral Analysis of Societies
and Cultural Practices, ed K. Lamal (New York, NY: Hemisphere), 39–73.
Glenn, S. S. (2004). Individual behavior, culture, and social change. Behav. Anal.
27, 133–151.
Glenn, S. S., and Malott, M. E. (2004). Complexity and selection: implications for
organizational change. Behav. Soc. Issues 13, 89–106. doi: 10.5210/bsi.v13i2.378
Glimcher, P. (2011). F
o
undations of Neuroeconomic Analysis. New York, NY: Oxford
University Press.
Hannan, M. T., and Freeman, J. (1989). Organizational Ecology.Cambridge,MA:
Harvard University Press.
Higley, J. D., Mehlman, P. T., Poland, R. E., Taub, D. M., Vickers, J., Suomi, S.
J., et al. (1996). CSF testosterone and 5-H1AA correlate with different types
of aggressive behaviors. Biol. Psychiatry 40, 1067–1082. doi: 10.1016/S0006-
3223(95)00675-3
Hodgson, G. M., and Knudsen, T. (2010). Darwin’s Conjecture: The Search for
General Pr inciples of Social and Economic Evolution. Chicago, IL: Chicago
University Press. doi: 10.7208/chicago/9780226346922.001.0001
Knutson, B., Wolkowitz, O., Cole, S. W., Chan, T., Moore, E., Johnson, R., et al.
(1998). Selective alteration of personality and social behavior by serotonergic
intervention. Am.J.Psychiatry155, 373–379.
Kober, H., Joseph, J., Davidson, M., and Mize, J. (2008). “The neuroimaging of
emotion,” in Handbook of Emotions, 3rd Edn., edsM.Lewis,J.M.Haviland-
Jones, and L. F. Barrett (New York, NY: Guilford Press), 249–271.
LeDoux, J. (1998). The Emotional Brain. London: Weidenfeldt and Nicholson.
LeDoux, J. (2000). Emotional circuits in the brain. Ann. Rev. Neurosci. 23, 155–184.
doi: 10.1146/annurev.neuro.23.1.155
LeDoux, J. (2003). The emotional brain, fear and the amygdala. Cell. Mol.
Neurobiol. 23, 727–738. doi: 10.1023/A:1025048802629
Lee, N., Broderick, A. J., and Chamberlain, L. (2007). What is ‘neuromarketing’?
a discussion and agenda for future research. Int. J. Psychophysiol. 63, 192–198.
doi: 10.1016/j.ijpsycho.2006.03.007
Lee, N., and Chamberlain, L. (2007). Neuroimaging and psychophysiological
measurement in organizational research: an agenda for research in orga-
nizational cognitive neuroscience. Ann. N.Y. Acad. Sc i. 1118, 18–42. doi:
10.1196/annals.1412.003
Legrenzi, P., and Umità, C. (2011). Neuromania: On the Limits of Brain Science.
Oxford: Oxford University Press. doi: 10.1093/acprof:oso/9780199591343.00
1.0001
Levine, C. (2007). Neural correlates of corporate camaraderie and teamwork. Ann.
N. Y. Acad. Sci. 1118, 102–108. doi: 10.1196/annals.1412.008
Lindquist, K. A., Wager, T. D., Kober, H., Bliss-Moreau, E., and Barrett, L. F.
(2012). The brain basis of emotion: a meta-analytic review. Behav. Brain Sci.
35, 121–202. doi: 10.1017/S0140525X11000446
Mehrabian, A. (1980). Basic Dimensions for a General Psychological Theory:
Implications for Personality, Social, Environmental, and Developmental Studies.
Cambridge, MA: Oelgeschlager, Gunn & Hain.
Mehrabian, A., and Russell, J. A. (1974). An Approach to Environmental Psychology.
Cambridge, MA: MIT Press.
Michael, J. (1982). Distinguishing b etween discriminative and motivational func-
tions of stimuli. J. Exp. Anal. Behav. 37, 149–155. doi: 10.1901/jeab.1982.
37-149
Montague, P. R., Dayan, P., and Sejnowski, T. J. (1996). A framework for mesen-
cephalic dopamine systems based on predictive hebbian learning. J. Neurosci.
16, 1936–1947.
Oliveira-Castro, J. M., Foxall, G. R., Yan, J., and Wells, V. K. (2011). A behavioural-
economic analysis of the essential value of brands. Behav. Process. 87, 106–114.
doi: 10.1016/j.beproc.2011.01.007
Panksepp, J. (1998). Affective Neuroscience. Oxford: Oxford Univesity Press.
Panksepp, J. (2005). On the embodied neural nature of core emotional effects. J.
Conscious. Stud. 12, 158–184.
Panksepp, J. (2007). “The neuroevolutionary and neuroaffective psychobiology
of the prosocial brain,” in The Oxford Handbook of Evolutionary Psychology,
edsR.I.M.DunbarandL.Barrett(Oxford:OxfordUniversityPress),
145–162.
Pfeffer, J., and Salancik, G. R. (2003). The Exter nal Control of Organizations: a
Resource Dependence Perspective. Stanford, CA: Standord University Press.
Politser, P. (2008). Neuroeconomics: a Guide to the New Science of Making Choices .
N
ew York, NY: Oxford University Press. doi: 10.1093/acprof:oso/97801953
05821.001.0001
Robbins, T. W., and Everitt, B. J. (2002). “Dopamine—its role in behavior and cog-
nition in experimental animals and humans,” in Dopamine in the CNS II, ed G.
Di Chiara (Berlin: Springer), 173–211. doi: 10.1007/978-3-662-06765-9_7
Robinson, T. E., and Berridge, K. C. (2003). Addiction. Ann. Rev. Psychol. 54, 25–53.
doi: 10.1146/annurev.psych.54.101601.145237
Rolls, E. T. (1999). The B rain and Emotion. Oxford: Oxford University Press.
Rolls, E. T. (2005). Emotion Explained. Oxford: Oxford University Press. doi:
10.1093/acprof:oso/9780198570035.001.0001
Rolls, E. T., Grabenhorst, F., and Leonardo, F. (2009). Prediction of subjective
affective state from brain activations. J. Neurophysiol. 101, 1294–1308. doi:
10.1152/jn.91049.2008
Ross, D. (2008). Two styles of neuroeconomics. Econom. Philos. 24, 473–483. doi:
10.1017/S0266267108002095
Russell, J. A., and Barrett, L. F. (1999). Core affect, prototypical emotional episodes,
and other things called emotion:dissectingtheelephant.J. Pers. Soc. Psychol. 76,
805–819. doi: 10.1037/0022-3514.76.5.805
Schultz, W. (1992). Activity of dopamine neurons in the behaving primate. Semin.
Neurosci. 4, 129–138. doi: 10.1016/1044-5765(92)90011-P
Schultz, W. (2010). Dopamine signals for reward value and risk: basic and recent
data. Behav. Brain Funct. 6, 24. doi: 10.1186/1744-9081-6-24
Frontiers in Human Neuroscience www.frontiersin.org July 2014 | Volume 8 | Article 472
|
107

Foxall Organizational neuroscience of bilateral contingency
Schultz, W., and Dickinson, A. (2000). Neuronal coding of prediction errors. Annu.
Rev . Neurosci. 23, 473–500. doi: 10.1146/annurev.neuro.23.1.473
Schultz, W., Dayan, P., and Montague, P. R. (1997). A neural substrate of
prediction and reward. Science 275, 1593–1599. doi: 10.1126/science.275.53
06.1593
Simon, H. A. (1976). Administrative Behavior, 3 Edn.NewYork,NY:Macmillan.
Skinner, B. F. (1981). Selection by consequences. Scie nce 213, 501–504.
Stanton, A. A., Day, M., and Welpe, I. M. (eds.). (2010). Neuroeconomics and the
Firm. Cheltenham; Glos: Edward Elgar. doi: 10.4337/9781849805605
Tabibnia, G., and Lieberman, M. D. (2007). Fairness and cooperation are reward-
ing: evidence from social cognitive neuroscience. Ann. N. Y. Acad. Sci. 1118,
90–101. doi: 10.1196/annals.1412.001
Toronchuk, J. A., and Ellis, G. F. R. (2010). Affective neuronal darwinism: The
nature of the primary emotional Systems. Available online at: http://www.mth.
uct.ac.za/∼ellis/ToronchuK%20&%20Ellis,%202010.pdf (Accessed June
26, 2010).
Uttal, W. R. (2001). The New Phrenology: the Limits of Localizing Cognitive Processes
in the Brain. Cambridge, MA: MIT Press.
Van Parijs, P. (1981). Evolutionary Explanation in the Social Sciences: An Emerging
Paradigm. Totowa, NJ: Rowman and Littlefield.
Vella, K. J., and Foxall, G. R. (2011). The Marketing Firm: Economic Psychology
of Corporate Behaviour. Cheltenham; Glos; Northampton: Edward Elgar. doi:
10.4337/9780857936509
Vella, K. J., and Foxall, G. R. (2013). T he Marketing Firm: operant
interpretation of corporate behavior. Psychol. Record 62, 375–402. doi:
10.11133/j.tpr.2013.63.2.011
Wager, T. D., Feldman Barrett, L., Bliss-Moreau, E., Lindquist, K. A., Duncan,
S., Kober, H., et al. (2008). “The neuroimaging of emotion,” in Handbook of
Emotions, edsM.Lewis,J.M.Haviland-Jones,andL.F.Barrett(NewYork,NY:
Guilford Press), 249–271.
Winkielman, P., Berridge, K. C., and Wilbarger, J. L. (2005). “Emotion, behav-
ior, and conscious experience: once more without feeling,” in Emotion and
Consciousness, eds L. F. Barrett, P. M. Niedenthal, and P. Winkielman (New York,
NY: Guilford), 335–362.
Yan, J., Foxall, G. R., and Doyle, J. R. (2012a). Patterns of reinforcement and
the essential value of brands: i. incorporation of utilitarian and informational
reinforcement into the estimation of demand.Psychol.Rec.62, 377–394.
Yan, J., Foxall, G. R., and Doyle, J. R. (2012b). Patterns of reinforcement and the
essential value of brands: II. evaluation of a model of consumer choice.Psychol.
Rec. 62, 361–376.
Yani-de-Soriano, M., Foxall, G. R., and Newman, A. (2013). The impact of
the interaction of utilitarian and informational reinforcement and behaviour
setting scope on consumer response. Psychol. Market. 30, 148–159. doi:
10.1002/mar.20594
Zak, P. J. (2004). “Neuroeconomics,” in Law and the Brain, eds S. Zeki and O.
Goodenough (Oxford: Oxford University Press), 133–153.
Zak, P. J. (2007). “The neuroeconomics of trust,” in Renaissance in Behavioral
Economics: Essays in Honor of Harvey Leibenstein, ed R. Franz (London; New
York: Routledge), 17–33.
Zak, P. J., and Nadler, A. (2010). “Using brains to create trust: a manager’s toolbox,”
in Neuroeconomics and the Firm, eds A. A. Stanton, M. Day, and I. M. We lpe
(Cheltenham; Glos: Edward Elgar), 69–77.
Conflict of Interest Statement: The
author
declares that the research was con-
ducted in the absence of any commercial or financial relationships that could be
construed as a potential conflict of interest.
Received: 26 April 2014; accepted: 09 June 2014; published online: 02 July 2014.
Citation: Foxall GR (2014) The marketing firm and consumer choice: implications of
bilateral contingency for levels of analysis in organizational neuroscience. Front. Hum.
Neurosci. 8:472. doi: 10.3389/fnhum.2014.00472
This article was submitted to the journal Frontiers in Human Neuroscience.
Copyright © 2014 Foxall. This is an ope n-access article distributed under the terms
of the Creative Commons Attribution License (CC BY). The use, distribution or repro-
duction in other forums is permitted, provided the original author(s) or licensor are
credited and that the original publication in this journal is cited, in accordance with
accepted academic practice. No use, distribution or reproduction is per mitted which
does not comply with these terms.
Frontiers in Human Neuroscience www.frontiersin.org July 2014 | Volume 8 | Article 472
|
108

REVIEW ARTICLE
published: 07 August 2014
doi: 10.3389/fnhum.2014.00549
Near-infrared spectroscopy (NIRS) as a new tool for
neuroeconomic research
Isabella M. Kopton
1
*
and Peter Kenning
1,2
1
Department of Corporate Management and Economics, Zeppelin Universität, Friedrichshafen, Germany
2
Faculty of Business Administration and Economics, Heinrich-Heine-Universität, Düsseldorf, Germany
Edited by:
Sven Braeutigam, University of
Oxford, UK
Reviewed by:
Dimitrios Kourtis, Ghent University,
Belgium
Andrea Dennis, University of
Oxford, UK
*Correspondence:
Isabella M. Kopton, Department of
Corporate Management and
Economics, Zeppelin Universit ät,
Am Seemooser Horn 20, 88045
Friedrichshafen, Germany
e-mail: i.kopton@
zeppelin-university.net
Over the last decade, the application of neuroscience to economic research has gained
in importance and the number of neuroeconomic studies has grown extensively. The
most common method for these investigations is fMRI. However, fMRI has limitations
(particularly concerning situational factors) that should be countered with other methods.
This review elaborates on the use of functional Near-Infrared Spectroscopy (fNIRS) as
a new and promising tool for investigating economic decision making both in field
experiments and outside the laboratory. We describe results of studies investigating the
reliability of prototype NIRS studies, as well as detailing experiments using conventional
and stationary fNIRS devices to analyze this potential. This review article shows that
further research using mobile fNIRS for studies on economic decision making outside
the laboratory could be a fruitful avenue helping to develop the potential of a new method
for field experiments outside the laboratory.
Keywords: mobile fNIRS, prefrontal cortex, real-world setting, neuroeconomics, decision making
INTRODUCTION
Over the last decade, the investigation of economic research ques-
tions by use of well-established neurological and neurophysiolog-
ical methods such as fMRI, EEG, electrodermal activit y (EDA)
or eye-tracking has led to the new interdisciplinary research field
called “neuroeconomics” (e.g ., McClure et al., 2004; Bechara
et al., 2005; Camerer et al., 2005; Kenning and Plassmann, 2005;
Singer and Fehr, 2005; Brosch and Sander, 2013). In this field, the
underlying neurophysiological processes of economic decision
making have been increasingly elaborated with diverse research
foci.
Different research studies focus on the neural correlates
of social dimensions in economic markets (e.g., Fehr et al.,
2005; Ruff et al., 2013), explore behavioral game theories
through a new neurophysiological perspective (e.g., Sanfey
et al., 2003; Bhatt and Camerer, 2005) and investigate brain
activities related to investors’ financial decision-making behav-
ior (e.g., McClure et al., 2004; Kuhnen and Knutson, 2005).
Other research focuses on consumers’ decision-making pro-
cesses and their corresponding brain activities (e.g., Yo o n
et al., 2006; Knutson et al., 2007; Hedgcock and Rao, 2009).
Moreover, management researchers in the area of information
system research have begun to use these neurophysiological
methods and prior findings to investigate information sys-
tem constructs, as well as users’ decision making in the
online world (e.g., Dimoka, 2011; Kopton et al., 2013; Riedl
et al., 2014). Recently, management research focusing on
organizational behavior has also begun to develop a new inter-
disciplinary perspective by transferring prior neurological find-
ings to extend organizational theories (e.g., Boyatzis et al.,
2014).
This body of research has generally resulted in significant
developments by adding a new theoretical perspective to eco-
nomic research. However, the majority of these well-known
neuroeconomic studies, all of which investigate decision mak-
ing from different economic perspectives (Glimcher et al.,
2013), were commonly investigated through fMRI-based research
(Braeutigam, 2012).
Nevertheless, fMRI measurements have limitations with
regard to how their real-world applicability corresponds to
restricted external validity, so that many researchers question
whether economic decision making can truly be measured and
generalized in such a restricted situation (Shimokawa et al., 2009;
Ariely and Berns, 2010; Ayaz et al., 2013). Only limited condi-
tions can be tested in the fMRI-scanner, and only specific types of
stimuli can be shown while the participant is lying in the scanner.
For this reason, neuroeconomic studies, to date, have primarily
focused on “fictive” tasks and not “real-world” situations (Ariely
and Berns, 2010). Because of the technical limitations, the influ-
encing stimuli in these studies were often reduced in complexity,
suggesting that other measurements are necessary for future field
experiments in neuroeconomics.
Against this background, mobile functional near-infrared
spectroscopy (fNIRS) measurement seems to have strong poten-
tial for applicability in field studies. fNIRS can be defined as a
non-invasive optical brain imaging technique that investigates
cerebral blood flow (CBF) as well as the hemodynamic response
in a local brain area during neural activity (Jackson and Kennedy,
2013). In different prior studies it has been demonstrated that,
comparable to functional magnetic resonance imaging (fMRI),
the fNIRS method is a reliable and valid measurement for cortical
activations (see Ernst et al., 2013).
Frontiers in Human Neuroscience www.frontiersin.org August 2014 | Volume 8 | Article 549
|
HUMAN NEUROSCIENCE
109

Kopton and Kenning Potential of NIRS for neuroeconomics
In response to the limited research, this paper aims to inte-
grate various disciplinary fNIRS studies in economic decision
making research which, up to now, have been examined mainly
in isolation from each other. Moreover, we provide insight into
the potential of fNIRS for measuring brain activations during
different real-world situations of economic decision making.
RECENT CHALLENGES FOR NEUROECONOMICS
At present, researchers in (neuro-)economics are challenged by
many new economic trends. Particularly, these trends increase the
difficulty of using tra ditional neurophysiological methods such
as fMRI to investigate research questions, for which measuring
situational factors in the “real world” and outside the laboratory
are highly important.
Three current examples of trends regarding consumers’ eco-
nomic decision making effectively illuminate new challenges of
(neuro-)economic research:
(1) Integrating consumers into the innovation process is becom-
ing increasingly essential (e.g., von Hippel and Katz, 2002;
Jeppesen and Molin, 2003; Gassmann et al., 2010 ). In general,
innovative products, ideas or concepts that are considered
“radical” or that offer “incremental” developments show
high failure rates in economic markets (Hauser et al., 2006),
primarily because they often present high risks and costs
resulting from uncertainty of consumer or user acceptance
(Davis, 1989; Stevens and Burley, 2003; Joshi and Sharma,
2004). Therefore, economic researchers in the area of inno-
vative product development are highly motivated to further
investigate determinants of consumer acceptance, percep-
tion and preference (e.g., Herrmann et al., 2007; Ariely and
Berns, 2010) during integration processes. In classical eco-
nomic studies, this is often implemented with experiments
that use real products and prototypes. The investigation of
prototypes and their potential for consumer acceptance is
often accomplished through market studies that use real
products and prototypes. In general, such investigations raise
questions regarding high external validity. These prevailing
complexities related to the new trend of integrating real-
world consumers into the product innovation process in
order to increase certainty of consumers’ product acceptance
show the necessity for new mobile measurements that can be
used outside the laboratory.
(2) Another new economic trend is the consumer tendency
toward sharing and joint consumption (Bardhi and Eckhardt,
2012). Noting that these issues were a major topic at the
2013 Association for Consumer Research Conference, gen-
eral indicators suggest that the phenomenon will continue to
gain importance. Today, “Generation Y” has fully accepted
the innovative trend of collaborative consumption and “non-
possession” (Belk, 2010). In contrast to the conventions of
earlier generations of consumers who placed value on own-
ing as a sign of prestige, young consumers share such things
as clothes, apartments, bicycles and cars, both with known or
previously unknown persons (Bardhi and Eckhardt, 2012).
Many new business models have emerged in response to
this development, and are primarily framed around the idea
of allocating market overcapacities (Botsman and Rogers,
2010). This socially based consumer movement will be
increasingly relevant for future-oriented economic studies,
and thereby will require extension of neuroeconomic theo-
ries on consumers’ decision making. In order to implement
studies concerning the new trend of collaborative consump-
tion, the consumers’ interaction in the real world will be an
interesting and valuable new perspective. This consequen-
tially arising complexity demands new mobile neuroimaging
techniques that can be used for investigating consumers’
interactions outside the laboratory.
(3) Investigating the operation of companies in new markets is
an important area for the expansion of economic studies,
and will also require new research methods. For example, an
fMRI study about consumer preferences and decision mak-
ing in new markets presents strong challenges, including the
need for cooperation or collaboration with institutes that
have easy access to fMRI scanners and clinics. Because of
these challenges (particularly in new markets with inadequate
infrastructure), new mobile neuroimaging techniques gain in
importance and have strong potential, especially in the field
of “cultural neuroscience” (Seligman and Kirmayer, 2008).
These three examples of new trends in economic research show
the relevance for new methods in (neuro-)economic research
outside the laboratory. Overall, neuroeconomic research is chal-
lenged by a number of changes that demand new methodological
development toward flexible and mobile technologies such as
fNIRS.
METHODOLOGICAL BACKGROUND OF fNIRS
MEASUREMENT
An elaboration of the potential of fNIRS methods should begin
by detailing the fNIRS methods that are applied for recording
data and for analysis. This background both allows useful assess-
ment of the potential of this new method, and brings to light its
challenges. Jöbsis (1977) was first to explain how the optical mea-
surement for cerebral hemodynamic response known as NIRS is
performed by the irradiation of near-infrared light into par tic-
ipants’ head and its scattering position (Villringer et al., 1993;
Funane et al., 2013).
Near-infrared light, with a wavelength spectrum of circa 650–
950 nm, passes through biological tissue without difficulty, and
can non-invasively illuminate several centimeters of the tissue
(Lloyd-Fox et al., 2010; Jackson and Kennedy, 2013; Scholkmann
et al., 2013). Because of this characteristic transparency, the spec-
trum of near-infrared light is often called an “optical window”
(Jöbsis-vanderVliet, 1999). In general, it can be approximated
that oxy-(O2Hb) and deoxy-hemobglobin (HHb) are the main
absorbers, so that the changes in oxy- and deoxy-hemoglobin
can be assessed, allowing for the indirect quantification of neu-
ral activity (Jackson and Kennedy, 2013). Various existing studies
calculate the optimal wavelength as well as the optimal num-
ber of different wavelengths for perfect illumination based on
a mathematical optimization problem (Yamashita et al., 2001;
Sato et al., 2004; Correia et al., 2010; Schelkanova and Toronov,
2012; Scholkmann et al., 2013). Based on these physical and
Frontiers in Human Neuroscience www.frontiersin.org August 2014 | Volume 8 | Article 549
|
110
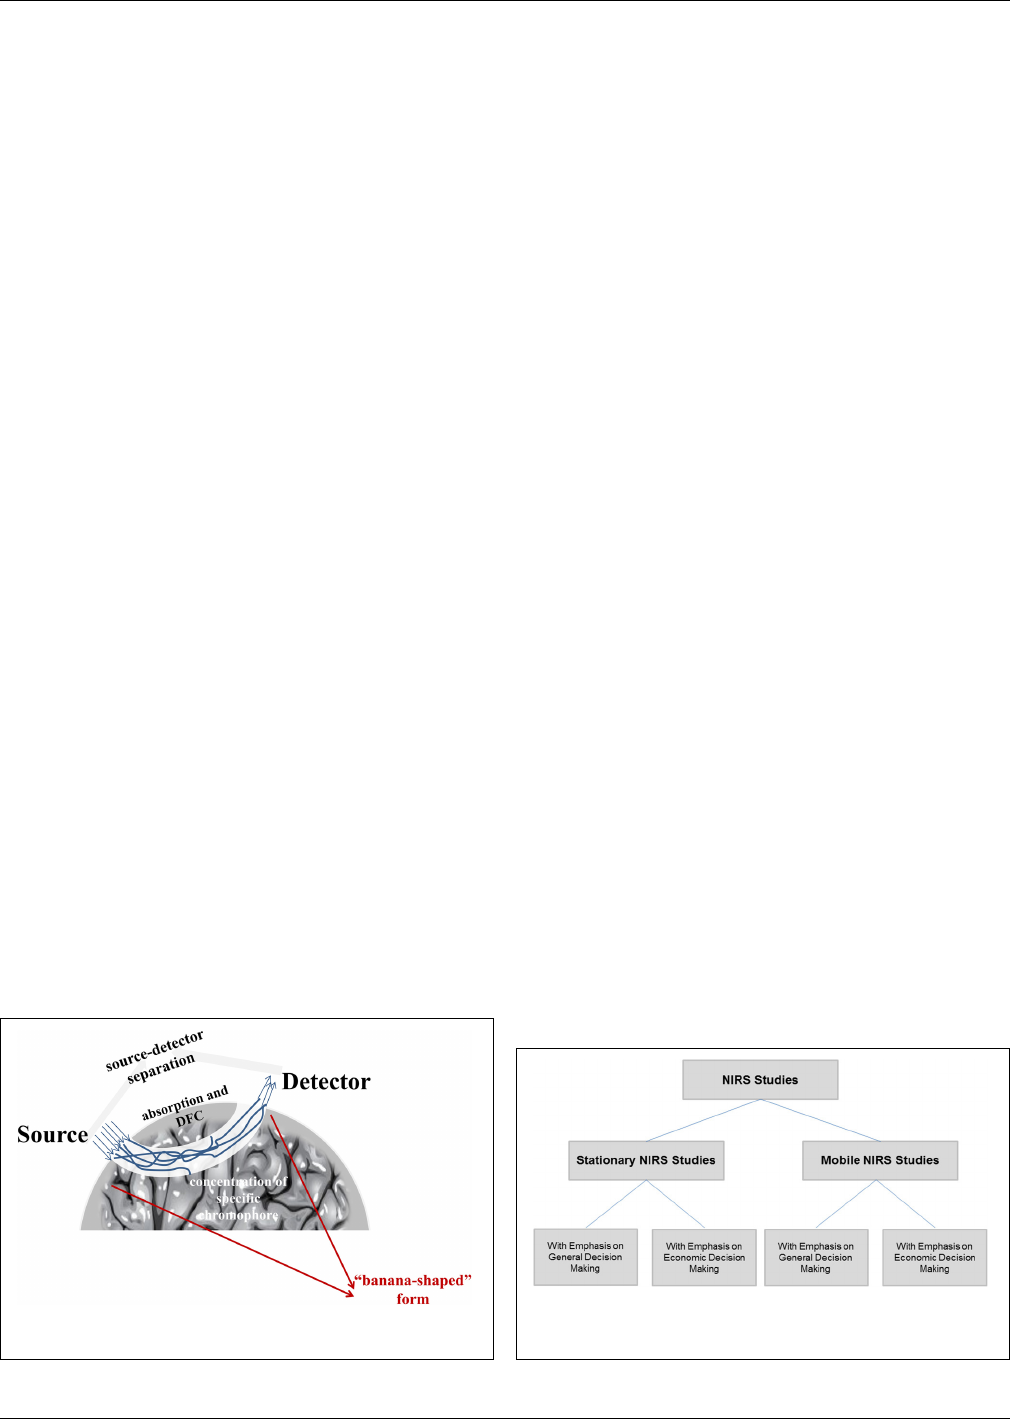
Kopton and Kenning Potential of NIRS for neuroeconomics
mathematical calculations, several techniques have been devel-
oped to measure the hemodynamic response. The majority of
these studies implement the continuous-wave method (Lloyd-Fox
et al., 2010). For oxy-(O2 Hb) and deoxy-hemobglobin (HHb)
chromophores, dissimilar near-infrared light absorption proper-
ties can be anticipated, so that by using the absorption variation
difference resulting from different chemical structure changes in
blood oxygenation of the illuminated skin, the skull and some
centimeters of brain tissue can be measured (Jöbsis, 1977; Lloyd-
Fox et al., 2010).
The near-infrared light sources, which are laser-emitting
diodes, are placed directly onto a participant’s scalp and are
sent—in a “banana-shaped” form (Okada and Delpy, 2003)—to
the detectors, called optodes. The depth and exactness of mea-
surement depends on the distance between the source and the
detector. In different mathematical models, the correlation of
the inter-optode distance and the depth of light penetration are
assumedtobeproportional(Nossal et al., 1988; Ehlis et al., 2005).
However, the larger the distance, the more the light is scattered, so
that the detector should not be placed more than 3 cm away from
the source (Lloyd-Fox et al., 2010; Jackson and Kennedy, 2013).
For the conversion of the raw near-infrared light absorption
and attenuation data into oxy- and deoxy-hemoglobin concen-
tration, the most commonly used algorithm is the modified
Beer–Lambert law (Kocsis et al., 2006; Scholkmann et al., 2013).
In contrast to the original Beer–Lambert law, which generally
allows the quantification of concentration only for non-scattering
media (Scholkmann et al., 2013), the modified Beer–Lambert law
considers a constant optical scattering of the light and relates
the change in chromophore concentration to the change in light
attenuation (see also Figure 1):
A = α ∗ c ∗ L ∗ DFC (Lloyd-Fox et al., 2010)
with A, light attenuation; α, absorption coefficient; c, concen-
tration of specific chromophore; L, source-detector separation;
DFC, differential path length factor, which may vary according
to specific wavelength, gender, age and difference in tissue ty pe
(Duncan et al., 1995, 1996).
FIGURE 1 | Change in light attenuation.
To measure changes in oxy- and deoxy-hemoglobin, the brain
needs to be illuminated with two different wavelengths, which in
turn need to be integrated into two simultaneous equations in
order to measure the blood oxygenation differences in the tissue
(Lloyd-Fox et al., 2010).
In addition to the implementation of the modified Beer–
Lambert law, fNIRS data analysis requires further preprocessing
methods such as motion artifact correction, low- and high-pass
filtering (for eliminating breathing, heartbeat and drift; see also
Piper et al., 2014) and single-channel signal-to-noise analyses.
Similar to fMRI studies, fNIRS data needs to be Bonferroni-
corrected for multiple comparisons between channels. This
implies that the p-values of multiple comparisons are adapted by
thenumberofcorrelationsperformed(seealsoErnst et al., 2013).
LITERATURE REVIEW OF NIRS STUDIES
A number of NIRS studies can be found in the literature, some
using stationary NIRS machines and others using mobile, wireless
and innovative NIRS prototypes. A general NIRS study classifica-
tion separating “stationary” and “mobile” NIRS has been devel-
oped, designating specific subcategories of studies with emphasis
on “economic decision making” and on “general decision mak-
ing” (see Figure 2).
Basedonthese(Figure 2) classifications, the follow ing section
presents various NIRS studies.
STATIONARY NIRS STUDIES
Stationary NIRS studies with emphasis on general decision making
One group of stationary NIRS studies includes those without a
concrete economic research frame, but that explore phenomena
that have interest and strong relevance for economic research
questions (see Tab le 1). The following decision making studies,
with varied foci, are transferable to economic research questions.
(1) Studies transferable to marketing research/transferable to
design studies in information system research: Several NIRS
studies explore the effects of different visual and audi-
tory stimuli (Köchel et al., 2011; Plichta et al., 2011)on
brain activations during participants’ decision making. These
NIRS studies could effectively complement the neuroeco-
nomic fMRI studies that investigate these various aspects of
FIGURE 2 | Literature review: stationary vs. mobile NIRS studies with
emphasis on general vs. economic decision making.
Frontiers in Human Neuroscience www.frontiersin.org August 2014 | Volume 8 | Article 549
|
111
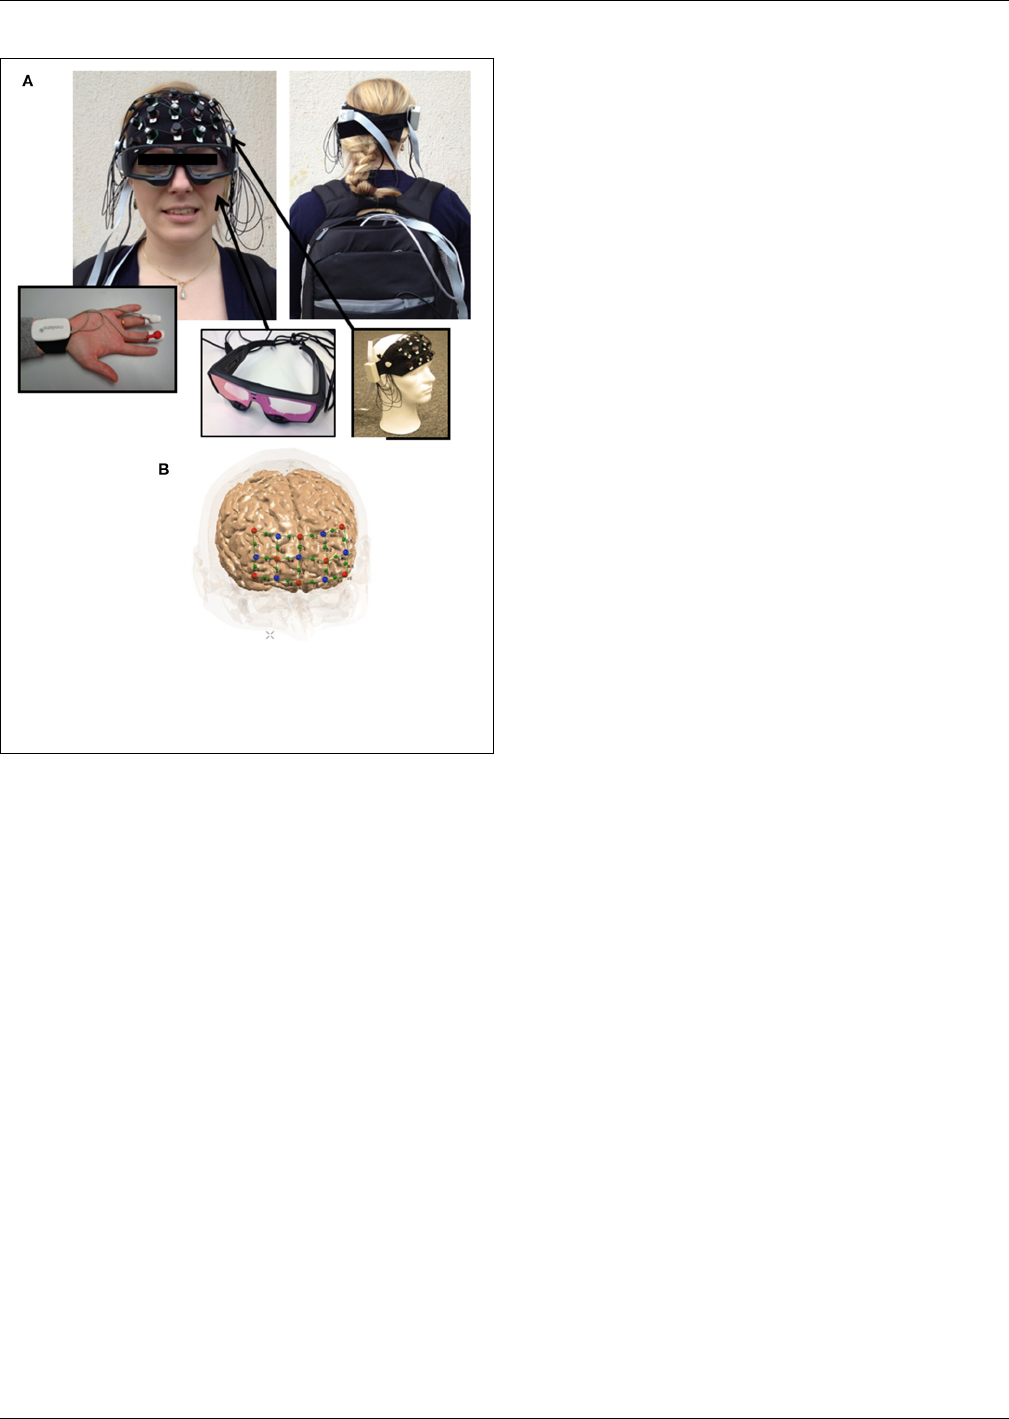
Kopton and Kenning Potential of NIRS for neuroeconomics
FIGURE 3 | Potential field experiment set-up. (A) Exemplary set-up with
mobile fNIRS, eye tracking and EDA devide; (B) Optode positioning of
prefrontal measuring cap specifically developed by NIRx Medizintechnik
GmbH, Germany.
influencing stimuli, such as the “First-Choice Brand Effect”
(Deppe et al., 2005) or the effect of cultur ally familiar brands
on preference (Schäfer et al., 2006). Moreover, these NIRS
studies can be transferred to prior fMRI studies that investi-
gate optimal user interface in social networks (Kopton et al.,
2013).
(2) Studies transferable to leadership research: fNIRS studies
dealing with social functioning theory and emotion discrim-
ination effects (Pu et al., 2012, 2013; Schneider et al., 2013)
can give new impetus in the area of leadership research
and organizational b ehavior. Few published research stud-
ies integrate neurophysiological methods into leadership and
organizational research, and the few that do exist are not
well known. This is astonishing, because the description, the
explanation and configuration of human behavior in organi-
zational systems is both central to and a main aspect of lead-
ership and organizational research (Kenning and Kopton,
2013). Consequently, because interpersonal relationship sys-
tems play a major role in the organizational behavior of
employees and managers, and in leadership behavior, fNIRS
studies (with the potential of implementing field experiments
with single trials during real human interp ersonal interac-
tions) promise to be highly relevant for this relatively new
research area.
(3) Studies transferable to interpersonal behavior studies in
information systems research: Schneider et al. (2013)
designed an experiment using avatar images to investigate
participants’ brain activations during the judgment of differ-
ent emotional faces. Riedl et al. (2014) used fMRI machiner y
to investigate online users’ interaction with avatars, as well as
with real human beings, in the online world. Though these
studies suggest that fNIRS studies can also easily be trans-
ferred to information system research, the implementation
of NIRS as a tool for real-world settings is not as relevant
for “computer interaction” studies. Accordingly, scientists
should always deliberate the advantages and disadvantages of
using fNIRS devices and fMRI machinery.
(4) Studies transferable to decision making studies from strate-
gic management and consumer research perspectives: NIRS
studies about decision making under time pressure (Tsujii
and Watanabe, 2010) and about decision-making processes
investigating approach-avoidance theor ies (Ernst et al., 2013)
are highly relevant for strategic managerial decision mak-
ing, as well as for consumer decision making (e.g., buy-
ing decisions under time pressure). Management studies
from various areas such as innovation management research
(e.g., Dayan and Elbanna, 2011) and strategic management
research (e.g., Sandler-Smith and Shely, 2004)focusonman-
agers’ intuitive decisions and “gut feelings” under time pres-
sure. Additionally, in the areas of marketing and consumer
research, many studies address questions related to con-
sumer decision making under time pressure (e.g., Reimann
et al., 2012; Krishnan et al., 2013).The Ernst et al. (2013)
NIRS study on approach-avoidance theory is another area of
application.
(5) Studies transferable to consumer research studies in the
area of compulsive buying behavior/consumer protection
research: A number of recent fNIRS studies about ADHD
syndrome and other pathological behaviors (Moser et al.,
2009; Gehricke et al., 2013) can be readily transferred to
consumer research studies in compulsive buying (e.g., Otero-
Lopez and Pol, 2013), as well as to consumer protection
studies that currently have increasing importance (Lee and
Mysyk, 2004; Kenning and Linzmajer, 2011; Kenning and
Reisch, 2013).
Stationary NIRS studies with emphasis on economic decision
making
In the last 5 years a number of new decision making studies inves-
tigating concrete and relevant economic research questions were
applied to economic decision-making research questions:
(1) Investors’ risky decision making: The experiments developed
by Shimokawa et al. (2009, 2012) investigate investors’ deci-
sion making processes. The first study (Shimokawa et al.,
2009) examines the medial prefrontal cortex (MPFC) and
the orbital cortex (OFC) related to risk and reward pre-
diction during decision making, using an fNIRStation from
Shimadzu Corporation. In this study, 15 participants fictively
received 1 million yen as total assets and were instructed
to use a computer to decide a ratio of stock investment.
Frontiers in Human Neuroscience www.frontiersin.org August 2014 | Volume 8 | Article 549
|
112

Kopton and Kenning Potential of NIRS for neuroeconomics
Table 1 | Stationary NIRS studies with emphasis on general decision making.
Transfer to marketing
research/Transfer to design
studies in information systems
research
Transfer to leadership
research/Transfer to
interpersonal behavior studies
in information systems research
Transfer to decision making
studies from strategic
management and consumer
research perspectives
Transfer to consumer research
studies in the areas of compulsive
buying behavior/consumer
protection research
Köchel et al., 2011 Pu et al., 2012, 2013 Tsujii and Watanabe, 2010 Moser et al., 2009
Content: Perception of pictures
and imagery
Transferable to: Transferable to
product and promotion policy;
e.g., influence of visual stimuli on
advertising and (innovative)
products (e.g., Schäferetal.,
2006) as well as to online design
studies in Neuro-IS research
(Kopton et al., 2013)
Content: Relationship between
prefrontal function during a
cognitive task and social
functioning (motivation factor
scores of SASS)
Transferable to: Transferable to
leadership and personal
management research (e.g.,
investigating working behavior for
practical implications; see
Kenning and Kopton, 2013)
Content: Time pressure effect
and the activity in the inferior
frontal cortex (IFC)
Transferable to: Managers’
strategic decision making under
time pressure, as well as
consumer decision making under
time pressure
Content: Results show that ADHD
can be characterized by impairment of
the dorsolateral prefrontal cortex
Transferable to: Investigating studies
of consumers’ pathological decision
making, such as research about
compulsive buying (e.g., Manolis and
Roberts, 2008)
Plichta et al., 2011 Schneider et al., 2013 Ernst et al., 2013 Gehricke et al., 2013
Content: Auditory cortex
activation is modulated by
emotion
Transferable to: Transferable to
promotion policy and
POS-marketing (influence of, for
example, music or voice on
consumers’ decision making;
subliminal marketing)
Content: Emotion discrimination
task with faceless avatars
expressing different patterns
(fearful, happy, sad, neutral,
angry) and participants’ judgment
Transferable to: Transferable to
managers’ interpersonal exchange
processes; human resource
management with relation to the
motivation of employees;
interpersonal behavior in the
online world (information systems
research; e.g., Riedl et al., 2014)
Content: Cortical processes
during automatic and regulated
approach-avoidance reactions
Transferable to: Findings for
approach-avoidance theories are
transferable to real-world
economic decision making of
consumers and managers; from a
consumer perspective, testing of
First Choice Brand Effect (Deppe
et al., 2005)
Content: Investigation of how
cigarette smoking affects prefrontal
brain hemodynamics in smokers with
and without ADHD
Transferable to: Transferable to prior
studies about consumers’ pathological
decision making (e.g., Otero-Lopez
and Pol, 2013)
Participants were allowed to change their ratio occasion-
ally, in response to stock prices, which were updated every
750 ms (experimental events). The results of this study show
that the OFC is sensitive to responses to price changes (loss
prediction), whereas MPFC changes accompany reward pre-
dictions. The second study (Shimokawa et al., 2012)confirms
these findings regarding expected rewards, and future risks
were further developed by investigating the extent to which
information about brain activity can advance investment
performance during investors’ decision making.
(2) Consumers’ decision making and preferences: In their NIRS
experiment, Luu and Chau (2009) address the phenomenon
of subjective product preference. Nine adults participated in a
computer experiment with a subjective preference task, based
on 60 trials (in total) per participant. During these trials the
participants were asked to look at two different drinks and
to mentally evaluate their preference. The method applied
the well-established shopping task of Knutson et al. (2007).
For the measurement, a multichannel frequency domain
NIRS device with 16 sources and three detectors was used.
The results showed that subjective preference could be mea-
sured in the MPFC with 80 percent accuracy. Accordingly,
this study shows high relevance for the research area of
consumer decision making processes, providing new and
useful impetus for field experiments on consumer decision
making.
MOBILE NIRS STUDIES
Mobile NIRS studies with emphasis on general decision making
One of the first mobile near-infrared spectroscopy systems was
developed by Bozkurt et al. (2005), for the purpose of contin-
uous monitoring of brain functions for newborns vulnerable to
brain injuries (see Ta b le 2). In this study the researchers present
the low-cost, battery-operated continuous shot-limited SNR of
67 dB (with dual wavelength) that they had developed for new-
borns in neonatal intensive care units (NICUs). The phantom
study tested the validity and reliability of the NIRS system, and
demonstrated the potential of this technology as a clinical tool for
measuring the metabolism of newborns in NICUs. Even though
this first study had a clinical setting, the development was a first
step toward application of a successful mobile tool.
In a later study, Muehlemann et al. (2008) developed a con-
tinuous wave near-infrared imaging (NIRI) with four sources
and four detectors that was tested in a solid silicone phan-
tom and in an in-vivo experiment with one male adult (see
Tabl e 2 ).Theresultsofbothphantomandin-vivo studies showed
Frontiers in Human Neuroscience www.frontiersin.org August 2014 | Volume 8 | Article 549
|
113

Kopton and Kenning Potential of NIRS for neuroeconomics
Table 2 | Studies with mobile NIRS devices.
MOBILE NIRS STUDIES
Authors Area of interest NIRS set-up External
validity
N Method Results
Bozkurt et al.,
2005
New-born brain
metabolism
Validity of the
system
Relatively high
external validity
1 (new-born) and
prior phantom
tests
NIRS prototype
of a low-cost,
battery-
operated, dual
wavelength,
continuous wave
Shot-limited SNR of
67 dB for 10 Hz temporal
resolution was achieved.
Reliable clinical tool
employed at bedside
Muehlemann
et al., 2008
Tissue
oxygenation and
cortical
hemodynamic
response to
sensory stimuli
Wireless NIRI
device tested in
a solid silicone
phantom and an
in-vivo
experiment
(4 sources, 4
detectors)
Very low
external validity
1 phantom test
and 1 male
(in-vivo
experiment)
In-vivo
experiment:
baseline;
pneumatic
pressure cuff
attached to the
upper arm
Tests with lightweight
and inexpensive
miniaturized wireless
NIRI device show that
the measurement
accuracy is comparable
to well-established
instruments
Atsumori et al.,
2009
Pre-frontal
cortex while
subject
performed a
word-fluency
task
Functional
wearable NIRS
brain imaging
with a prototype
during reading
High external
validity (but
computer task)
1 (adult) During the task
periods, the
subject was
asked to think of
as many words
as possible that
begin with the
Japanese
character
Typical changes in oxy-Hb
and deoxy-Hb during the
task.
Therefore, prototype can
be used to investigate
functions in the
prefrontal cortex
Yoshino et al.,
2013a
Frontal lobe
activations
during car
acceleration and
deceleration
Functional
wireless
multi-channel
system
(FOIRE-3000,
Shimadzu); 16
sources and 16
detection probes
Very high
external validity
(field experiment
under specific
driving
conditions)
12 (adults) Acceleration and
deceleration
Results show that
vehicle deceleration
requires more brain
activation, focused in the
prefrontal cortex, than
does acceleration
Yoshino et al.,
2013b
Activation in the
frontal lobe
during driving
operations
Functional
wireless
multi-channel
system
(FOIRE-3000,
Shimadzu); 16
sources and 16
detection probes
Very high
external validity
(field experiment
under specific
driving
conditions)
12 (adults) Resting st ate,
acceleration,
deceleration,
U-turn, stop
Powerful technique for
investigating brain
activations outdoors,
proving to be sufficiently
robust for use in an
actual highway driving
experiment in the field of
intelligent transport
systems
Piper et al., 2014 Motor cortex
activity during
bicycling (left
hand gripping)
Functional
wireless and
mobile NIRS
brain imaging
during an
outdoor activity
Very high
external validity
(field experiment
with specific
task conditions)
8 (adults) Three different
exercise
conditions: (1)
during outdoor
bicycle riding; (2)
while pedaling
on a stationary
exercise bicycle;
(3) sitting still on
a stationary
exercise bicycle
Following left hand
gripping, a significant
decrease in the
deoxy-hemoglobin
concentration over the
contralateral motor
cortex could be found for
all three conditions;
outdoor and indoor
conditions showed no
significant difference in
the shape or amplitude of
HbR.
(Continued)
Frontiers in Human Neuroscience www.frontiersin.org August 2014 | Volume 8 | Article 549
|
114

Kopton and Kenning Potential of NIRS for neuroeconomics
Table 2 | Continued
MOBILE NIRS STUDIES
Authors Area of interest NIRS set-up External
validity
N Method Results
Holper et al.,
2014
Simultaneous
comparison with
EDA; activity of
lateral prefrontal
cortex during
risky decisions
Functional
wireless and
mobile NIRS
brain imaging
NIRS machinery
with only one
light-source
Relatively high
external validity
(but computer
task)
20 (adults) Risky
decision-making
task
(Christopoulos
et al., 2009;
Tobler et al.,
2009)and
baseline
recording
Enhanced activation in
the lateral prefrontal
cortex is related to
high-risk decisions;
reduced activation in this
area is related to low-risk
decisions.
EDA revealed increasing
responses for high-risk
decisions
that measurement precision with the lightweight and lower-cost
miniaturized NIRI is similar to well-established non-mobile NIRS
instruments. Testing this prototype on an adult was an important
step in the direction of wireless NIRS measurements.
To the best knowledge of the authors, Atsumori et al. (2009)
were among the first to carry out a study combining a test for
validity and reliability of a new system with an integrated partic-
ipant task component (see Tabl e 2 ). The Atsumori team created
a small, light and wearable system that covers the participant’s
forehead in order to measure activation in the prefrontal cortex,
and applied it to performing a word fluency tasks. From their
study implemented with one Japanese adult, the results showed
changes in oxy- and deoxy-hemoglobin that would be typical for
this reading task, confirming that the prototype could be used to
investigate the prefrontal cortex.
Moreover, a later study applied a wireless, mobile and minia-
turized fNIRS prototype (16 channels) for neuroergonomic
research (Ayaz et al., 2013).Thegoalofthisprototypewasto
measure brain activation in naturalistic settings to obtain better
knowledge for safety in air traffic control (see Tab l e 2). Though
this experiment was executed with only solid and liquid phan-
toms, the study shows the strong potential for using fNIRS in
economic decision-making studies with high external validity.
In 2013, several different studies with wireless prototypes were
implemented. One study (N = 12 adults) explored frontal lobe
activation during car acceleration and deceleration, using a func-
tional wireless multi-channel system (FOIRE-3000, Shimadzu;
16 sources and 16 detectors), and found that vehicle decelera-
tion requires more brain activation—with focus on the prefrontal
cortex—than does acceleration (Yoshino et al., 2013a). The study
reveals very high external validity by testing participants in a
real car in a real-world setting (see Ta ble 2 ). A second study
investigated these first findings regarding brain activations dur-
ingdrivingfurther(Yoshino et al., 2013b).Thesecondstudyalso
shows the robustness of using the mobile fNIRS method in a real
highway setting. Piper e t al. (2014) presented a prototype study
of the first wearable multi-channel fNIRS system that could be
used for freely moving subjects. In this study, the brain area of
interest was the motor cortex activity observed during gripping
of the left hand seated at rest, and while cycling outdoors. The
experiment was implemented with eight adults and three different
exercise conditions (outdoor bicycle riding, riding a stationary
exercise bicycle, and sitting still on a bicycle). The results showed
a significant decrease in the deoxy-hemoglobin concentration
(contralateral motor cortex) for all three cycling conditions, in
comparison to the resting conditions. Furthermore, activation in
the outdoor condition was not significantly different from rid-
ing a stationary exercise bicycle. Therefore, their prototype was
assumed to be robust enough for implementation in real-world
settings. At this stage, the technology allowed participants in the
fNIRS studies to move freely, which is an important precondition
for field experiments in naturalistic settings.
Mobile NIRS studies with emphasis on economic decision making
Ver y rec entl y, Holper et al. (2014) presented the first study using
wireless and mobile fNIRS machinery with a research question
relevant to economics (see Tabl e 2 ). The researchers tested the
activity of the lateral prefrontal cortex during risky decision m ak-
ing, using a simultaneous comparison of the mobile fNIRS system
and an EDA device (N = 20) in a computer experiment. Results
showed that boosted activation in the lateral prefrontal cortex is
related to high-risk decisions, and reduced activation in this area
with low-risk decisions. Furthermore, the EDA revealed increased
response for high-risk decisions. As the first economic decision-
making study using mobile fNIRS, the study revealed a number
of limitations, most notably that the NIRS machinery had only
one light source, and the fictive task was implemented in front of
a computer without integrating further situational factors.
However, these prototype studies generally show interesting
new tendencies, providing foundation for application of the new
wireless and mobile fNIRS techniques as potential measurement
methodologies for neuroeconomic studies with high external
validity.
Overall, the outline of published studies with stationary and
mobile fNIRS machinery presented here indicates that interesting
and notable findings exist. However, the area of neuroeconomics
is still far away from a systematic integration of fNIRS. This may
be due to the lack of a clear indication on the suitability of using
fNIRS to study economic decision making. In addition, it may
be that neuroeconomists are not trained in application of fNIRS.
Regarding these two aspects, we will present a more detailed dis-
cussion about the positive and negative aspects of such uses for
Frontiers in Human Neuroscience www.frontiersin.org August 2014 | Volume 8 | Article 549
|
115

Kopton and Kenning Potential of NIRS for neuroeconomics
fNIRS, and develop a decision table to aid in decisions about
the suitability of fNIRS in neuroeconomics. Finally, we present
a design for a first concept of potential field experiment set-up for
neuroeconomic research questions.
DECISION ON THE SUITABILITY OF fNIRS METHODOLOGY
FOR STUDYING NEUROECONOMICS
As shown, very few studies have investigated economic decision
making with fNIRS measures, nor have used portable mobile
fNIRS measures that allow participants to freely move around in
a naturalistic setting. Many researchers are still working on basic
methodological studies to optimize the methodology and the
analyses of the near-infrared light data. However, the characteris-
tics of the measurements suggest that fNIRS has many strengths,
and offers significant potential for neuroeconomics, particularly
for research with a high external validity. In order to determine
the suitability of using fNIRS, we provide a decision-table for
judging the potential for integrating fNIRS studies into neu-
roeconomic research (see Ta ble 3). Based on this decision-table,
neuroeconomic researchers can assess the potential of fNIRS
studies for answering their specific research questions.
In the following, we e laborate on the various assessment
criteria of this decision-table:
(1) Spatial resolution: Compared to fMRI, the spatial reso-
lution of fNIRS is less precise. For some research ques-
tions, the lower spatial resolution of fNIRS (compared to
fMRI) makes it challenging to distinguish cortical areas
that are positioned close to each other, so that in earlier
multi-channel NIRS studies researchers proposed differ-
ent algorithms to separate these close regions (Koenraadt
et al., 2012; T hanh Hai et al., 2013). These new algorithms
are valuable for better identification of cortical sources.
Moreover, in contrast to EEG (which measures scalp activ-
ity), fNIRS methods are appropriate for specific research
questions regarding brain cortical activity (e.g., hypothe-
ses regarding attention/cognition levels and sensory acti-
vations). As mentioned in the prior review section, some
fNIRS decision studies have investigated cortical and pre-
frontal processes (e.g., Ernst et al., 2013; Pu et al., 2013;
Yoshino et al., 2013a), and can be transferred to eco-
nomic decision-making questions. Furthermore, some sen-
sory studies ( e.g., for advertisement studies) with a focus on
perception and imagery processing (e.g., Köchel et al., 2011)
are equally transferable.
(2) Brain areas in deep brain regions: This aspect is in line
with Criteria 1. Cort ical and prefrontal areas can be reached
effectively by fNIRS studies (e.g., Pu et al., 2012; Ernst
et al., 2013; Yoshino et al., 2013a). However, for studies
that investigate deeper brain structures (such as the nucleus
accumbens) as the concrete region of interest (e.g., Reimann
and Bechara, 2010), the fNIRS methodology is less appro-
priate. This aspect is often mentioned in the limitations
of current fNIRS studies (e.g., Pu et al., 2012, 2013)and
should be considered when developing a research design for
an fNIRS study.
(3) Temporal resolution: Generally, in terms of temporal res-
olution, fNIRS (for the ETG-100 machinery; e.g., 100 ms)
is a good compromise between fMRI and EEG/MEG. fNIRS
technology supports fast acquisition of data from numerous
positions (Ehlis et al., 2005; Huppert et al., 2006; Sitaram
et al., 2009). In their NIRS time pressure study, Tsujii and
Watanabe (2010) noted activity in the prefrontal cortex
(IFC), which demonstrates that fNIRS may provide a good
measurement for studies having similar research questions.
Tsujii and Watanabe’s study (2010) can easily be tr ans-
ferred to neuroeconomic research questions—for example,
regarding managers’ strategic decision making under time
pressure, as well as consumers’ decision making under
time restrictions. Therefore, this relatively high temporal
Table 3 | Potential of fNIRS for neuroeconomics.
Potential of fNIRS for answering research questions neuroeconomic studies is. . .
high, if. . . low if. . .
(1). . . there is medium high need for spatial resolution. (1). . . there is very high need for spatial resolution.
(2). . . there is low need for investigating areas in deeper brain regions. (2). . . there is high need for investigating areas in deeper brain regions.
(3). . . there is a medium high need for temporal resolution. (3). . . there is very high need for temporal resolution.
(4). . . there is a low abstraction faculty of the research objects/high
need for external validity.
(4). . . there is a high abstraction faculty of the research objects/low
need for external validity.
(5). . . there is a high sensitivity of study regarding movement artifacts. (5). . . there is low sensitivity of study regarding movement artifacts.
(6). . . there is a high need for quiet. (6). . . there is low need for quiet.
(7). . . there is a high need for compatibility with other methods. (7). . . there is no/low need for compatibility with other methods.
(8). . . there exist several fNIRS studies regarding a comparable
behavioral phenomenon.
(8). . . there is no existence of fNIRS studies regarding a comparable
behavioral phenomenon.
(9). . . there is a limited budget available. (9). . . there is a high budget available.
(10). . . there is a high need for pleasant consumer experience. (10)...thereisalow need for pleasant c onsumer experience.
(11)...there islow possibility to cooperate with institutes in different
countries.
(11). . . there is a high possibility to cooperate with institutes in different
countries.
(12). . . there is a high possibility of working together with fNIRS experts. (12). . . there is a low possibility of working together with fNIRS experts.
Frontiers in Human Neuroscience www.frontiersin.org August 2014 | Volume 8 | Article 549
|
116

Kopton and Kenning Potential of NIRS for neuroeconomics
resolution of fNIRS shows a strong potential for fNIRS
methodological investigations regarding time restrictions
and limitations in economic settings.
(4) Abstraction faculty of the research object: Generally, prior
neuroeconomic studies with fMRI investigations have
explored economic constructs on a high level of abstraction
(e.g., Knutson et al., 2007; Riedl et al., 2010; Kopton et al.,
2013). However, for some research questions and concrete
economic constructs that need to be examined on a neural
basis, limitations exist with regard to the faculty in abstrac-
tion. The fNIRS-based driving studies of Yoshino et al.
(2013a,b) are a good example of these limitations. fMRI
studies could not effectively monitor real driving experi-
ences such as acceleration or deceleration events with exter-
nal validity. Also, concrete limitations of abstractions exist,
with regard to economic constructs—for example, trust in
real exchange processes or real-world interpersonal situa-
tions. The mobile and wireless capabilities of fNIRS (see
also Kober et al., 2013; Yoshino et al., 2013a,b; Piper et al.,
2014) indicate optimal possibilities for field experiments in
economics.
(5) Sensitivity of study regarding movement artifacts: In con-
trast to fNIRS methodology, fMRI is relatively sensitive to
body-motion artifacts (Aihara et al., 2012). The low sensi-
tivity of motion artifacts creates strong potential for fNIRS
studies with application in the real world (Nambu et al.,
2009; Lloyd-Fox et al., 2010; Kober et al., 2013; Piper et al.,
2014). For example, in consumer neuroscience research it
is highly relevant to consider consumers’ decision-making
processes by evaluating not only pictures but also real three-
dimensional products (e.g., cars or food items). Studies have
often provided evidence that consumers’ decision making
and affects differ when real products are shown, as com-
pared to pictures (e.g., Bushong et al., 2010). Furthermore,
the opportunity to touch or experience real products—in
such situations as sitting inside a car or touching clothing—
is relevant for some research questions (e.g., Peck and
Childers, 2006). These examples suggest that using mobile
fNIRS machinery, which is relatively robust to movements,
can be a fruitful method for measuring economic decision-
making constructs. Nevertheless, researchers who want to
investigate economic decision making in real-world settings
need to be aware that the mobile prototype machineries are
still not immune to movements that are very sudden.
(6) Quiet: In contrast to fMRI, fNIRS is an extremely quiet neu-
roimaging technique (Plichta et al., 2011). This feature gives
fNIRS strong relevance for future studies in which audi-
tory sounds play an important role. As an example, a study
by Plichta et al. (2011) that shows enhanced activations of
sensory brain areas in response to emotional auditory stim-
uli would be highly transferable to consumer neuroscience
studies, as well as to organizational and (neuro-)leadership
studies, confirming the significant potential offered by
fNIRS studies regarding research questions with auditory
stimuli. For instance, it could be both interesting and useful
to observe how consumers in real-world shopping situa-
tions react to characteristic voices (friendly/unfriendly) of
salespeople, or to study the influence of a leader’s voice on
team or group members.
(7) Compatibility with other methods: fNIRS compatibility
with other measurements such as EDA is ver y high (see,
for example, Holper et al., 2014). Especially for field
experiments with complex stimuli, this possibility could
be valuable—for instance, by combining fNIRS with eye-
tracking data. Further, because of the quietness of the fNIRS
machinery, the method also has very high compatibility
with research techniques such as well-established interper-
sonal market research interviews, which are often used in
studies with marketing and strategic management focus.
This ability makes the method highly relevant and useful for
economic researchers.
(8) Existence of several fNIRS studies regarding a comparable
behavioral phenomenon (nomological validity): The poten-
tial of the fNIRS method for neuroeconomic research stud-
ies increases with regard to the number of existing fNIRS
studies relative to comparable behavioral phenomenon.
Therefore, for basic neuroeconomic research studies using
fNIRS methodologies, we suggest a research agenda based
on existing inquiries. As mentioned in the review section of
the present article, research studies that focus on impulsivity
and ADHD syndromes are available, but no studies with a
focus on impulsive or compulsive consumer decision mak-
ing apply fNIRS methodologies. Consequently, exploring
consumer impulsivity and compulsivity (e.g., Manolis and
Roberts, 2008; Hubert et al., 2013) with the new and still rel-
atively unknown fNIRS measurement has strong potential
for generating valuable results for real-world neuroeco-
nomic research. Furthermore, neuroscience studies focused
on picture and imager y processing have been implemented,
with results suggesting that fNIRS analysis of advertising
images could produce valuable new theories for real-world
economic applications.
(9) Limited budget: In gener al, fMRI is an expensive neu-
roimaging method, whereas fNIRS is relatively inexpen-
sive, and the machinery is easily accessible for economic
researchers (Shimokawa et al., 2009; Weiskopf, 2012; Kober
et al., 2013; Moriguchi and Hiraki, 2013). Therefore, fNIRS
studies may have a relatively strong potential for pretest
studies, for which researchers would like to test first for
expected effects, and have value for economic researchers
who have no direct access to fMRI machineries or clinical
settings,aswellasthosewhohavearelativelylowbudget.
These attr ibutes will enable researchers carrying out fNIRS
experiments to include more participants for larger group
analyses.
(10) Pleasant consumer experience: Marketing or strategic man-
agement researchers recognize the value of working with
customers of a company, particularly for implementing a
study that is pleasant and not uncomfortable for the cus-
tomers. Doing so prevents conditions that may discourage
customers from future interactions with the company, or
that may inhibit further buying decisions. This is especially
the case for typical mar ket research projects. The use of
NIRS is a relatively pleasant experience for participants. As
Frontiers in Human Neuroscience www.frontiersin.org August 2014 | Volume 8 | Article 549
|
117

Kopton and Kenning Potential of NIRS for neuroeconomics
an example, in contrast to EEG measurements, no electri-
cal gel is needed, so that the montage of NIRS optodes is
also much faster than the montage of EEG electrodes (Kober
et al., 2013). The montage of the machineries for partic-
ipants with dark hair can take a bit more time, however,
because dark hairs between the optodes and the head can
cause light attenuation. Though this complication can be
diminished by brushing participants’ hair out of the way
to ensure good skin contact for sources and detectors, the
preparation can be time-consuming for researchers (Lloyd-
Fox et al., 2010; Holper et al., 2012). For analyses where only
the frontal areas are regions of interest, specific fNIRS caps
can be used, measuring only the forehead where no hairs
disturb the positioning of the optodes (e.g., Atsumori et al.,
2009). Overall, NIRS is a very suitable method when there is
a need for pleasant consumer experiences.
(11) Intercultural study: possibility of cooperating with insti-
tutes in different countries: This feature in the decision-list
is related to the prior aspect. Building on studies show-
ing that culture has influence on social and interpersonal
behavior (Wallendorf and Arnould, 1988; Strombach et al.,
2013), it can be anticipated that intercultural aspects have
a strong influence on social life and decision making. For
real-world conditions where researchers are investigating
consumer behaviors in countries other than their own, and
where there may be limited ability to cooperate with insti-
tutes (China or Africa, for instance), the ability to travel that
mobile fNIRS offers to researchers could make it a highly
practical tool.
(12) Possibility of working with fNIRS experts: For economic
researchers who want to answer research questions using
fNIRS technology, there is strong advantage in working
cooperatively with neuroimaging/optical experts or specific
fNIRS experts. In general, the standardization of fNIRS data
analysis remains an issue that needs further attention, and
manyresearchersinthisareacontinuetoworkontheirown
prototype software to analyze their findings. Therefore, eco-
nomic researchers who are not yet experts in fNIRS would
find particular value in working with experts during the data
analysis stage. It should be noted that because there are cur-
rently very few fNIRS studies with neuroeconomic focus,
comparability between results of different studies continues
to be relatively difficult.
In summary, the present discussion, in combination with the
elaborated continuum (Tabl e 3 ), offers neuroeconomic scientists
a decision agenda for evaluating the potential of fNIRS methodol-
ogy, and its usefulness for their specific research questions, aims,
and areas of interests.
INSIGHT INTO A POTENTIAL FIELD EXPERIMENT SET-UP
As discussed, fNIRS might be a promising and new tool for
neuroeconomic research under certain circumstances, especially
regarding mobile technologies. In the following, therefore, we will
report first insight about a potential exper imental set-up using
mobile fNIRS in combination with further neurophysiological
methods for studies outside the laboratory. The aim of this section
is to provide neuroeconomists with greater ability for developing
fNIRS studies.
For the application of a mobile fNIRS device in a field experi-
ment, a wearable multi-channel fNIRS system with a specifically
developed prefrontal cap is typically used. For our economic
decision-making studies (with regard to the measurement restric-
tions of fNIRS in deeper brain regions), we are mainly interested
in the prefrontal areas of the brain.
Even if scientists keep the design of a field experiment very
simple and integ rate no complex treatment conditions, questions
arise regarding how to control external influencing variables, and
how to reconstruct aspects such as consumer behavior for the
analysis. These questions are extremely relevant, because con-
sumers in field experiments can move freely and without exact
timing conditions, which presents challenges for neurophysiolog-
ical measurements. For the optimal measurement of consumers’
decision making outside the laboratory, a number of reasons can
be identified for developing a multifaceted experimental set-up
not only with fNIRS measurement, but also with eye-tracking and
EDA devices (Figure 3).
The eye-tracking device enables researchers to both follow
consumers’ eye movements objectively, and to develop a baseline
for analysis of the field experiments. Thus, in a field experiment,
for example, about consumers’ decision making about innova-
tive prototype products such as cars, the eye-tracking data can
give important information regarding the stimulus that is being
observed by the consumer at a specific time (in seconds) during
the decision-making phase. With parallel eye-tracking measure-
ments as baseline and timeline, therefore, participants’ individual
differences dur ing the experiment outside the laboratory can be
controlled. This element of integrating eye-tracking has poten-
tial usefulness in neurophysiological field experiments using a
portable fNIRS device. Furthermore, comparing fNIRS activa-
tion and electrodermal arousal reactions (as additional controls)
could be useful for measuring not only eye-tracking but also
(“EDA”; e.g., Greenwald et al., 1989) simultaneously with fNIRS
(Holper et al., 2014 ). Prior studies have revealed that specific
activations in prefrontal areas have an effect on EDA (Tr ane l,
2000; Critchley, 2002; Figner and Murphy, 2010; Holper et al.,
2014).
Finally, for the successful implementation of experiments out-
side the laboratory, specific additional operating procedures need
to be considered. Consumers should close their eyes (“resting
conditions”) before observing objects/stimuli (e.g., car exteri-
ors/interiors), and should walk at a constant speed (to control
for potential movement artifacts), in experiments with several
rounds and a number of treatment conditions. Moreover, the
supervisor of the experiment needs to simultaneously observe
each participant, take notes regarding potential outliers (of exter-
nal variables), and trigger the mobile fNIRS device concerning
specific upcoming situations and pre-defined conditions. These
operating procedures are relevant for subsequent successful data
preprocessing.
CONCLUSIONS
Generally, most prior neuroeconomic studies were implemented
with the fMRI scanner, but the fMRI technology also has
Frontiers in Human Neuroscience www.frontiersin.org August 2014 | Volume 8 | Article 549
|
118

Kopton and Kenning Potential of NIRS for neuroeconomics
limitations that have often been criticized—especially concerning
the generalizability and the restrictions regarding the integra-
tion of situational factors in a lab, and regarding external validity
(Braeutigam, 2012). Some of these limiting factors and critical
aspects could be countered with new technological tools such
as mobile fNIRS devices that support investigation of economic
decision making outside the laboratory. Currently, however, few
neuroeconomic studies applying mobile NIRS methods are avail-
able. The reason for this research gap might be that the use
of mobile and wireless NIRS is in its early stages, and many
researchers still work on prototypes for optimal data acquisition
(e.g., Muehlemann et al., 2008; Atsumori et al., 2009; Piper et al.,
2014). The aim of this paper was to demonstrate, and to dis-
cuss, the potential that fNIRS methods offer for neuroeconomic
research questions in which situational factors outside the labo-
ratory play a major role (e.g., in consumer decision making at the
point of sale).
To fulfill our objectives, we reviewed existing studies with rel-
evance to (economic) decision making and presented a decision-
table for neuroeconomic researchers that may enable better deter-
mination of the suitability of fNIRS for studying neuroeconomics.
To the best of our knowledge, this is the first article investigating
the fNIRS method as a new and prospective tool for economic
research questions outside the laboratory. By integrating stud-
ies from various disciplines, we developed a decision-table to
support future application of fNIRS methods. Finally, we pre-
sented a first concept of a potential field experiment set-up for
a neuroeconomic research question.
Overall, this present article shows that further research using
(mobile) fNIRS for studies on economic decision making out-
side the laboratory could be a fruitful avenue. As well, the paper
helps to validate the potential of a new method regarding differ-
ent aspects and to develop a more effective application outside the
laboratory.
ACKNOWLEDGMENTS
The authors would like to thank the Guest Associate Editor Sven
Braeutigam, two reviewers who provided insightful comments on
earlierdraftsofthispaper,aswellasBrunoPreilowski,Hugo-
Eckener Laboratory for Experimental Psychology and Brain
Research at Zeppelin University, and Christoph Schmitz, Charité
University Medicine Berlin and NIRx Medizintechnik GmbH, for
their valuable comments on the experimental fNIRS set-up, and
Deborah C. Nester for copyediting.
REFERENCES
Aihara, T., Takeda, Y., Takeda, K., Yasuda, W., Sato, T., Otaka, Y., et al. (2012).
Cortical current source estimation from electroencephalography in combina-
tion with near-infrared spect roscopy as a hierarchical prior. Neuroimage 59,
4006–4021. doi: 10.1016/j.neuroimage.2011.09.087
Ariely, D., and Berns, G. S. (2010). Neuromarketing: the hope and hype of
neuroimaging in business. Nat. Rev. Neurosci. 11, 284–292. doi: 10.1038/
nrn2795
Atsumori, H., Kiguchi, M., Obata, A., Sato, H., Katura, T., Funane, T., et al. (2009).
Development of wearable optical topography system for mapping the prefrontal
cortex activation. Rev. Sci. Instrum. 80, 043704. doi: 10.1063/1.3115207
Ayaz, H., Onaral, B., Izzetoglu, K., Shewokis, P. A., McKendrick, R., and
Parasuraman, R. (2013). Continuous monitoring of brain dynamics with
functional near infrared spectroscopy as a tool for neuroergonomic research:
empirical examples and a technological development. Front. Hum. Neurosci.
7:871. doi: 10.3389/fnhum.2013.00871
Bardhi, F., and Eckhardt, G. M. (2012). Access-based consumption: the case of car
sharing. J. Consum. Res. 39, 881–898. doi: 10.1086/666376
Bechara, A., Damasio, A. R., and Damasio, H. (2005). The somatic marker hypoth-
esis: a neural theory of economic decision. Games Econ. Behav. 52, 336–372. doi:
10.1016/j.geb.2004.06.010
Belk, R. (2010). Sharing. J. Consum. Res. 36, 715–734. doi: 10.1086/612649
Bhatt, M., and Camerer, C. F. (2005). Self-referential thinking and equilibrium as
states of mind in games: fMRI evidence. Games Econ. Behav. 52, 424–459. doi:
10.1016/j.geb.2005.03.007
Botsman, R., and Rogers, R. (eds.). (2010). What’s Mine Is Yours: The Rise of
Collaborative Consumption. New York, NY: HarperCollins.
Boyatzis, R., Rochford, K., and Jack, A. (2014). Antagonistic neural networks
underlying differentiated leadership roles. Front. Hum. Neurosci. 8:114. doi:
10.3389/fnhum.2014.00114
Bozkurt, A., Rosen, A., Rosen, H., and Onaral, B. (2005). A portable near infrared
spectroscopy system for bedside monitoring of newborn brain. Biomed. Eng.
Online 4:29. doi: 10.1186/1475-925X-4-29
Braeutigam, S. (2012). Neural systems supporting and affecting economi-
cally relevant behavior. Neurosci. Neuroecon. 1, 11–23. doi: 10.2147/NAN.
S25038
Brosch, T., and Sander, D. (2013). Neurocognitive mechanisms underlying value-
based decision-making: from core values to economic value. Front. Hum.
Neurosci. 7:398. doi: 10.3389/fnhum.2013.00398
Bushong, B., King, L. M., Camerer, C. F., and Rangel., A. (2010). Pavlovian pro-
cesses in consumer choice: the physical presence of a good increases willingness-
to-pay. Am. Econ. Rev. 100, 1–18. doi: 10.1257/aer.100.4.1556
Camerer, C., Loewenstein, G., and Pelec, D. (2005). Neuroeconomics:
how neuroscience can inform economics. J. Econ. Lit. 43, 9–64. doi:
10.1257/0022051053737843
Christopoulos, G. I., Tobler, P. N., Bossaerts, P., Dolan, R. J., and Schultz, W. (2009).
Neural correlates of value, risk, and risk aversion contributing to decision mak-
ing under risk. J. Neurosci. 29, 12574–12583. doi: 10.1523/JNEUROSCI.2614-
09.2009
Correia, T., Gibson, A., and Hebden, J. (2010). Identification of the optimal
wavelengths for optical topography: a photon measurement density function
analysis. J. Biomed. Opt. 15, 1–11. doi: 10.1117/1.3484747
Critchley, H. D. (2002). Electrodermal responses: what happens in the brain.
Neuroscientist 8, 132–142. doi: 10.1177/107385840200800209
Davis, F. (1989). Perceived usefulness, perceived ease of use, and user acceptance
of information technology. Manage. Inform. Syst. Quart. 13, 319–340. doi:
10.2307/249008
Dayan, M., and Elbanna, S. (2011). Antecedents of team intuition and its impact
on the success of new product development projects. J. Prod. Innovat. Manag.
28, 159–174. doi: 10.1111/j.1540-5885.2011.00868.x
Deppe, M., Schwindt, W., Kugel, H., Plassmann, H., and Kenning, P. (2005).
Nonlinear responses within the medial prefrontal cortex reveal when specific
implicit information influences economic decision making. J. Neuroimaging 15,
171–182. doi: 10.1177/1051228405275074
Dimoka, A. (2011). Brain mapping of psychological processes with psychometric
scales:
an
fMRI method for social neuroscience. Neuroimage 54, 263–271. doi:
10.1016/j.neuroimage.2010.05.007
Duncan, A., Meek, J. H., Clemence, M., Elwell, C., Fallon, P., Tyszczuk, L.,
et al. (1996). Measurement of cranial optical path length as a function of age
using phase resolved near infrared spectroscopy. Pediatr. Res. 39, 889–894. doi:
10.1203/00006450-199605000-00025
Duncan, A., Meek, J. H., Clemence, M., Elwell, C. E., Tyszczuk, L., Cope, M., et al.
(1995). Optical pathlength measurements on adult head, calf and forearm and
the head of the newborn infant using phase resolved optical spectroscopy. Phys.
Med. Biol. 40, 295–304. doi: 10.1088/0031-9155/40/2/007
Ehlis, A.-C., Herrmann, M. J., Wagener, A., and Fallgatter, A. J. (2005). Multi-
channel near-infrared spectroscopy detects specific inferior-frontal activation.
Biol. Psychol. 69, 315–331. doi: 10.1016/j.biopsycho.2004.09.003
Ernst, L. H., Plichta, M. M., Lutz, E., Zesewitz, A. K., Tupak, S. V.,
Dresler, T., et al. (2013). Prefrontal activation patterns of automatic and
regulated approach-avoidance reactions—a functional near-infrared spec-
troscopy (fNIRS) study. Cortex 49, 131–142. doi: 10.1016/j.cortex.2011.
09.013
Frontiers in Human Neuroscience www.frontiersin.org August 2014 | Volume 8 | Article 549
|
119

Kopton and Kenning Potential of NIRS for neuroeconomics
Fehr, E., Fischbacher, U., and Kosfeld, M. (2005). Neuroeconomic foundations of
trust and social preferences: initial evidence. Am. Econ. Rev. 95, 346–351. doi:
10.1257/000282805774669736
Figner, B., and Murphy, R. (2010). “Using skin conductance in judgment and deci-
sion making research,” in A Handbook of Process Tracing Methods for Decision
Research, eds M. Schulte-Mecklenbeck, A. Kuehberger, and R. Ranyard (New
York, NY: Psychology Press), 163–185.
Funane, T., Atsumori, H., Katura, T., Obata, A. N., Sato, H., Tanikawa, Y., et al.
(2013). Quantitative evaluation of deep and shallow tissue layers’ contribu-
tion to fNIRS signal using multi-distance optodes and independent com-
ponent analysis. Neuroimage 85, 150–165. doi: 10.1016/j.neuroimage.2013.
02.026
Gassmann, O., Enkel, E., and Chesbrough, H. (2010). The future of open innova-
tion as a researchable theory. R&D Manage. J. 40, 213–221. doi: 10.1111/j.1467-
9310.2010.00605.x
Gehricke, J. G., Polzonetti, C., Caburian, C., and Gratton, E. (2013). Prefrontal
hemodynamic changes during cigarette smoking in young adult smokers
with and without ADHD. Pharmacol. Biochem. Behav. 112, 78–81. doi:
10.1016/j.pbb.2013.10.001
Glimcher, P., Camerer, C., Fehr, E., and Poldrack, R. (2013). Neuroeconomics:
Decision Making and the Brain.SanDiego,CA:Elsevier.
Greenwald, M. K., Cook, E. W., and Lang, P. J. (1989). Affective judgment and
psychophysiological response: dimensional covariation in the evaluation of
pictorial stimuli. J. Psychophysiol. 3, 51–64.
Hauser, J., Tellis, G., and Griffin, A. (2006). Research on innovation: a
review and agenda for marketing science. Market. Sci. 25, 687–717. doi:
10.1287/mksc.1050.0144
Hedgcock, W., and Rao, A. R. (2009). Trade-off aversion as an explanation for the
attraction effect: a functional magnetic resonance study. J. Market. Res. 46, 1–13.
doi: 10.1509/jmkr.46.1.1
Herrmann, A., Befurt, R., Heitmann, M., and Berger, H. (2007). Alles für die
Marke? Produktdesign im Konflikt zwischen einer markenkonformen und einer
eigenständigen Produktliniengestaltung. Z. Betrieb. Forsch. 59, 1055–1080.
Holper, L., Scholkmann, F., and Wolf, M. (2012). Between-brain connectiv-
ity during imitation measured by fNIRS. Neuroimage 63, 212–222. doi:
10.1016/j.neuroimage.2012.06.028
Holper, L., Wolf, M., and Tobler, P. N. (2014). Comparison of functional near-
infrared spectroscopy and electrodermal activity in assessing objective versus
subjective risk during risky financial decisions. Neuroimage 84, 833–842. doi:
10.1016/j.neuroimage.2013.09.047
Hubert, M., Hubert, M., Florack, A., Linzmajer, M., and Kenning, P. (2013).
Neural correlates of impulsive buying tendencies during perception of product
packaging. Psychol. Market. 30, 861–873. doi: 10.1002/mar.20651
Huppert, T. J., Hoge, R. D., Diamond, S. G., Franceschini, M. A., and Boas, D.
A. (2006). A temporal comparison of BOLD, ASL and NIRS hemodynamic
responses to motor stimuli in adult humans. Neuroimage 29, 368–382. doi:
10.1016/j.neuroimage.2005.08.065
Jackson, P. A., and Kennedy, D. O. (2013). The application of near-infrared spec-
troscopy in nutritional intervention studies. Front. Hum. Neurosci. 7:473. doi:
10.3389/fnhum.2013.00473
Jeppesen, L. B., Molin, M. J. (2003). Consumers as co-developers: learning
and innovation outside the firm. Technol. Anal. Strateg. 15, 363–383. doi:
10.1080/09537320310001601531
Jöbsis, F. F. (1977). Noninvasive, infrared monitoring of cerebral and myocardial
oxygen sufficiency and circulatory parameters. Science 198, 1264–1267. doi:
10.1126/science.929199
Jöbsis-vanderVliet, F. F. (1999). Discovery of the near-infrared window into the
body and the early development of near-infrared spectroscopy. J. Biomed. Opt.
4, 392–396. doi: 10.1117/1.429952
Joshi, A. W., and Sharma, S. (2004). Customer knowledge development:
antecedents and impact on new product performance. J. Mark. 68, 47–59. doi:
10.1509/jmkg.68.4.47.42722
Kenning, P., and Kopton, I. (2013). Zur Integration neurowis-
senschaftlicher Erkenntnisse, Theorien und Methoden in die betriebliche
Organisationsforschung. Entwicklung einer “Neuroleadership”-
Forschungsagenda. Z.
Führ. Organ. 6, 388–393.
Kenning, P., and Linzmajer, M. (2011). Consumer neuroscience: an overview of an
emerging discipline with implications for consumer policy. J. Consum. Protect.
Food Safety 6, 111–125. doi: 10.1007/s00003-010-0652-5
Kenning, P., and Plassmann, H. (2005). Neuroeconomics: an overview
of an economic perspective. Brain Res. Bull. 67, 343–354. doi:
10.1016/j.brainresbull.2005.07.006
Kenning, P., and Reisch, L. (2013). Alternativen zum Informationsparadigma der
Verbraucherpolitik: Eine kommentierende Einführung in ein noch dynamisches
verbraucherwissenschaftliches Feld mit verbraucherpolitischen Implikationen.
J. Verbrauch. Lebensm. 8, 227–230. doi: 10.1007/s00003-013-0833-0
Knutson, B., Rick, S., Wimmer, G. E., Prelec, D., and Loewenstein,
G. (2007). Neural predictors of purchase. Neuron 53, 147–156. doi:
10.1016/j.neuron.2006.11.010
Kober, S. E., Wood, G., Kurzmann, J., Friedrich, E. V. C., Stangl, M., Wippel, T.,
et al. (2013). Near-infrared spectroscopy based neurofeedback training increases
specific motor imagery related cortical activation compared to sham feedback.
Biol. Psychol. 95, 21–30. doi: 10.1016/j.biopsycho.2013.05.005
Kocsis, L., Herrman, P., and Eke, A. (2006). The modified Beer-Lambert
law revisited. Phys. Med. Biol. 51, N91–N98. doi: 10.1088/0031-9155/
51/5/N02
Koenraadt, K. L., Duysens, J., Smeenk, M., and Keijsers, N. L. (2012). Multi-channel
NIRS of the primary motor cortex to discriminate hand from food activity.
J. Neural Eng. 9:046010. doi: 10.1088/1741-2560/9/4/046010
Kopton, I., Sommer, J., Winkelmann, A., Riedl, R., and Kenning, P. (2013).
Users‘trust building processes during their initial connecting behavior in social
networks: behavioral and neural evidence. Proc.Int.Conf.Inform.Syst.107,
1–12.
Köchel, A., Plichta, M. M., Schäfer, A., Leutgeb, V., Scharmüller, W., Fallgatter,
A., et al. (2011). Affective perception and imagery: a NIRS study. Int. J.
Psychophysiol. 80, 192–197. doi: 10.1016/j.ijpsycho.2011.03.006
Krishnan, B. C., Dutta, S., and Jha, S. (2013). Effectiveness of exaggerated advert ised
reference prices: the role of decision time pressure. J. Retail. 89, 105–113. doi:
10.1016/j.jretai.2012.11.001
Kuhnen, C., and Knutson, B. (2005). The neural basis of financial risk taking.
Neuron 47, 763–770. doi: 10.1016/j.neuron.2005.08.008
Lee, S., and Mysyk, A. (2004). The medicalization of compulsive buying. Soc. Sci.
Med. 58, 1709–1718. doi: 10.1016/S0277-9536(03)00340-X
Lloyd-Fox, S., Blasi, A., and Elwell, C. E. (2010). Illuminating the developing brain:
the past, present and future of functional near infrared spectroscopy. Neurosci.
Biobehav. Rev. 34, 269–284. doi: 10.1016/j.neubiorev.2009.07.008
Luu, S., and Chau, T. (2009). Decoding subjective preference from single-trial
near-infrared spectroscopy signals. J. Neural Eng. 6, 1–8. doi: 10.1088/1741-
2560/6/1/016003
Manolis, C., and Roberts, J. A. (2008). Compulsive buying: does it matter how it’s
measured? J. Econ. Psychol. 29, 555–576. doi: 10.1016/j.joep.2007.10.005
McClure, S. M., Laibson, D. I., Loewenstein, G., and Cohen, J. D. (2004). Separate
neural systems value immediate and delayed monetary rewards. Science 306,
503–507. doi: 10.1126/science.1100907
Moriguchi, Y., and Hiraki, K. (2013). Prefrontal cortex and executive function in
young children: a review of NIRS studies. Front. Hum. Neurosci. 7:867. doi:
10.3389/fnhum.2013.00867
Moser, S. J., Cutini, S., Weber, P., and Schroeter, M. (2009). Right prefrontal brain
activation due to Stroop interference is altered in attention-deficit hyperactiv-
ity disorder—a functional near-infrared spectroscopy study. Psychiatry Res. 173,
190–195. doi: 10.1016/j.pscychresns.2008.10.003
Muehlemann, T., Haensse, D., and Wolf, M. (2008). Wireless miniatur-
ized in-vivo near infrared imaging. Opt. Express 16, 10323–10330. doi:
10.1364/OE.16.010323
Nambu, I., Osu, R., Sato, M.-A., Ando, S., Kawato, M., and Naito, E. (2009).
Single-trial reconstruction of finger-pinch forces from human motor-cortical
activation measured by near-infrared spectroscopy (NIRS). Neuroimage 47,
628–637. doi: 10.1016/j.neuroimage.2009.04.050
Nossal, R., Kiefer, J., Weiss, G. H., Bonner, R., Taitelbaum, H., and Havlin, S.
(1988).
Photon migration in layered media. Appl. Opt. 27, 3382–3391. doi:
10.1364/AO.27.003382
Okada, E., and Delpy, D. T. (2003). Near-infrared light propagation in an
adult head model. II. Effect of superficial tissue thickness on the sensitiv-
ity of the near-infrared spectroscopy signal. Appl. Opt. 42, 2915–2922. doi:
10.1364/AO.42.002915
Otero-Lopez, J. M., and Pol, E. V. (2013). Compulsive buying and the five fac-
tor model of personality: a facet analysis. Pers. Individ. Dif. 55, 585–590. doi:
10.1016/j.paid.2013.05.005
Frontiers in Human Neuroscience www.frontiersin.org August 2014 | Volume 8 | Article 549
|
120

Kopton and Kenning Potential of NIRS for neuroeconomics
Peck, J., and Childers, T. L. (2006). If I touch it I have to have it: individual and
environmental influences on impulsive purchasing. J. Bus. Res. 59, 765–769. doi:
10.1016/j.jbusres.2006.01.014
Piper, S. K., Krueger, A., Koch, S. P., Mehnert, J., Habermehl, C., Steinbrink, J.,
et al. (2014). A wearable multi-channel fNIRS system for brain imaging in
freely moving subjects. Neuroimage 85, 64–71. doi: 10.1016/j.neuroimage.2013.
06.062
Plichta, M. M., Gerdes, A. B. M., Alpers, G. W., Harnisch, W., Brill, S., Wieser, M.
J., et al. (2011). Auditory cortex activation is modulated by emotion: a func-
tional near-infrared spectroscopy (fNIRS) study. Neuroimage 55, 1200–1207.
doi: 10.1016/j.neuroimage.2011.01.011
Pu, S., Nakagome, K., Yamada, T., Yokoyama, K., Matsumura, H., Terachi,
S., et al. (2013). Relationship between prefrontal function during a cog-
nitive task and social functioning in male Japanese workers: a multi-
channel near-infrared spectroscopy study. Psychiatry Res. 214, 73–79. doi:
10.1016/j.pscychresns.2013.05.011
Pu, S., Yamada, T., Yokoyama, K., Matsumura, H., Mitani, H., Adachi, A., et al.
(2012). Reduced prefrontal cortex activation during the working memory
task associated with poor social functioning in late-onset depression: multi-
channel near-infrared spectroscopy study. Psychiatry Res. 203, 222–228. doi:
10.1016/j.pscychresns.2012.01.007
Reimann, M., and Bechara, A. (2010). The somatic marker framework as
a neurological theory of decision-making: review, conceptual comparisons,
and future neuroeconomics research. J. Econ. Psychol. 31, 767–776. doi:
10.1016/j.joep.2010.03.002
Reimann, M., Castano, R., Zaichkowsky, J., and Bechara, A. (2012). Novel versus
familiar brands: an analysis of neurophysiology, response latency, and choice.
Mark. Lett. 23, 745–759. doi: 10.1007/s11002-012-9176-3
Riedl, R., Hubert, M., and Kenning, P. (2010). Are there neural gender differ-
ences in online trust? An fMRI study on the perceived trustworthiness of
eBay offers. Manage. Inform. Syst. Quar. 34, 397–428. Available online at:
http://dl.acm.org/citation.cfm?id=2017458.2017469
Riedl, R., Mohr, P., Kenning, P., Davis, F., and Heekeren, H. (2014). Trusting
humans and avatars: a brain imaging study based on evolution theory.
J. Manage. Inform. Syst. 30, 83–113. doi: 10.2753/MIS0742-1222300404
Ruff, C. C., Ugazio, G., and Fehr, E. (2013). Changing social norm compliance
with noninvasive brain stimulation. Science 342, 482–484. doi: 10.1126/sci-
ence.1241399
Sandler-Smith, E., and Shely, E. (2004). The intuitive executive: understanding and
applying ‘gut feeling’ in decision-making. Acad. Manag. Exec. 18, 76–91. doi:
10.5465/AME.2004.15268692
Sanfey, A. G., Rilling, J. K., Aronson, J. A., Nystrom, L. E., and Cohen, J. D. (2003).
The neural basis of economic decision-making in the ultimatum game. Sc ience
300, 1755–1758. doi: 10.1126/science.1082976
Sato, H., Kiguchi, M., Kawaguchi, F., and Maki, A. (2004). Practicality of wave-
length selection to improve signal-to-noise ratio in near-infrared spectroscopy.
Neuroimage 21, 1554–1562. doi: 10.1016/j.neuroimage.2003.12.017
Schäfer, M., Berens, H., Heinze, H.-J., and Rotte, M. (2006). Neural correlates of
culturally familiar brands of car manufacturers. Neuroimage 31, 861–865. doi:
10.1016/j.neuroimage.2005.12.047
Schelkanova, I., and Toronov, V. (2012). Independent component analysis of broad-
band near-infrared spectroscopy data acquired on adult human head. Biomed.
Opt. Express 3, 64–74. doi: 10.1364/BOE.3.000064
Schneider, S., Christensen, A., Häußinger, F. B., Fallgatter, A. J., Giese, M. A.,
and Ehlis, A.-C. (2013). Show me how you walk and I tell you how you
feel—a functional near-infrared spectroscopy study on emotion perception
basedonhumangait.Neuroimage 85, 380–390. doi: 10.1016/j.neuroimage.2013.
07.078
Scholkmann, F., Kleiser, S., Metz, A. J., Zimmermann, R., Pavia, J. M., Wolf, U., et al.
(2013). A review on continuous wave functional near-infrared spectroscopy
and imaging instrumentation and methodology. Neuroimage 85, 6–27. doi:
10.1016/j.neuroimage.2013.05.004
Seligman, R., and Kirmayer, L. J. (2008). Dissociative experience and cultur al neu-
roscience: narrative, metaphor and mechanism. Cult. Med. Psychiatry 32, 31–64.
doi: 10.1007/s11013-007-9077-8
Shimokawa, T., Kinoshita, K., Miyagawa, K., and Misawa, T. (2012). A brain
information-aided intelligent investment system. Decis. Support Syst. 54,
336–344. doi: 10.1016/j.dss.2012.05.041
Shimokawa, T., Suzuki, K., Misawa, T., and Miyagawa, K. (2009). Predictability
of
investment behavior from brain information measured by functional near-
infrared spectroscopy: a Bayesian neural network model. Neuroscience 161,
347–358. doi: 10.1016/j.neuroscience.2009.02.079
Singer, T., and Fehr, E. (2005). The neuroeconomics of mind reading and empathy.
Am. Econ. Rev. 95, 340–345. doi: 10.1257/000282805774670103
Sitaram, R., Caria, A., and Birbaumer, N. (2009). Hemodynamic brain-computer
interfaces for communication and rehabilitation. Neural Netw. 22, 1320–1328.
doi: 10.1016/j.neunet.2009.05.009
Stevens, G., and Burley, J. (2003). Piloting the rocket of radical innovation. Res.
Technol. Manage. 46, 16–26. doi: 10.1109/EMR.2004.25114
Strombach, T., Jin, J., Weber, B., Kenning, P., Shen, Q., Ma, Q., et al. (2013). Charity
begins at home: cultural differences in social discounting and generosity.
J. Behav. Decis. Making 27, 235–245. doi: 10.1002/bdm.1802
Thanh Hai, N., Cuong, N. Q., Dang Khoa, T. Q., and Toi, V. V. (2013).
Temporal hemodynamic classification of two hands tapping using func-
tional near-infrared spectroscopy. Front. Hum. Neurosci. 7:516. doi:
10.3389/fnhum.2013.00516
Tobler, P. N., Christopoulos, G. I., O’Doherty, J. P., Dolan, R. J., and Schultz, W.
(2009). Risk-dependent reward value signal in human prefrontal cortex. Proc.
Natl. Acad. Sci. 106, 7185–7190. doi: 10.1073/pnas.0809599106
Tranel, D. (2000). “Electrodermal activity in cognitive neuroscience: neuroanatom-
ical and neuropsychological correlate,” in Cognitive Neuroscience in Emotion,eds
R. Lane and L. Nadel (New York, NY: Oxford University Press), 192–224.
Tsujii, T., and Watanabe, S. (2010). Neural correlates of belief-bias reasoning under
time pressure: a near-infrared spectroscopy study. Neuroimage 50, 1320–1326.
doi: 10.1016/j.neuroimage.2010.01.026
Villringer, A., Planck, J., Hock, C., Schleinkofer, L., and Dirnagl, U. (1993). Near
infrared spectroscopy (NIRS): a new tool to study hemodynamic canges during
activation of brain function in human adults. Neurosci. Lett. 154, 101–104. doi:
10.1016/0304-3940(93)90181-J
von Hippel, E., and Katz, R. (2002). Shifting innovation to users via toolkits.
Manage. Sci. 48, 821–833. doi: 10.1287/mnsc.48.7.821.2817
Wallendorf, M., and Arnould, E. J. (1988). My favorite things: a cross-cultural
inquiry into object attachment, possessiveness, and social linkage. J. Consum.
Res. 14, 531–547. doi: 10.1086/209134
Weiskopf, N. (2012). Real-time fMRI and its application to neurofeedback.
Neuroimage 62, 682–692. doi: 10.1016/j.neuroimage.2011.10.009
Yamashita, Y., Maki, A., and Koizumi, H. (2001). Wavelength dependence of
the precision of noninvasive optical measurement of oxy-, deoxy-, and total-
hemoglobin concentration. Med. Phys. 28, 1108–1114. doi: 10.1118/1.1373401
Yoon, C., Gutchess, A. H., Feinberg, F., and Polk, T. A. (2006). A functional
magnetic resonance imaging study of neural dissociations between brand and
person judgments. J. Consum. Res. 33, 31–40. doi: 10.1086/504132
Yoshino, K., Oka, N., Yamamoto, K., Takahashi, H., and Kato, T. (2013a).
Correlation of prefrontal cortical activation with changing speeds in actual driv-
ing, a vector-based functional near-infrared spectroscopy study. Front. Hum.
Neurosci. 7:895. doi: 10.3389/fnhum.2013.00895
Yoshino, K., Oka, N., Yamamoto, K., Takahashi, H., and Kato, T. (2013b).
Functional brain imaging using near-infrared spectroscopy dur ing
actual driving on an expressway. Front. Hum. Neurosci. 7:882. doi:
10.3389/fnhum.2013.00882
Conflict of Interest Statement: The authors declare that the research was con-
ducted in the absence of any commercial or financial relationships that could be
construed as a potential conflict of interest.
Received: 29 March 2014; accepted: 07 July 2014; published online: 07 August 2014.
Citation: Kopton IM and Kenning P (2014) Near-infrared spectroscopy (NIRS) as
a new tool for neuroeconomic research. Front. Hum. Neurosci. 8:549. doi: 10.3389/
fnhum.2014.00549
This ar ticle was submitted to the journal Frontiers in Human Neuroscience.
Copyright © 2014 Kopton and Kenning. This is an open-access article distributed
under the terms of the Creative Commons Attribution License (CC BY). The use, dis-
tribution or reproduction in other forums is permitted, prov ided the original author(s)
or licensor are credited and that the or iginal publication in this journal is cited, in
accordance with accepted academic practice. No use, distribution or reproduction is
permitted which does not comply with these terms.
Frontiers in Human Neuroscience www.frontiersin.org August 2014 | Volume 8 | Article 549
|
121

OPINION ARTICLE
published: January 2014
doi: 10.3389/fnhum.2013.00834
Ideology in organizational cognitive neuroscience studies
and other misleading claims
Dirk Lindebaum
*
The University of Liverpool Management School, Liverpool, UK
*Correspondence: d.lindebaum@liverpool.ac.uk
Edited by:
Carl Senior, Aston University, UK
Keywords: ideology, neuroscience, organizational behavior, organizational cognitive neuroscience, organization science
As part of this forum on “Society,
Organizations and the Brain,” Butler
(2014) contributed an article on how to
operationalize interdisciplinary research
by way of introducing “a model of co-
production in organizational cognitive
neuroscience (OCN)” (p. 1).
While I appreciate his work as an
extension of prior research, there are
some misleading claims in his article in
terms of associating my prev ious work
with what he terms “science ideology” (a
term he does not define), and a mislead-
ing representation of key arguments pre-
sented in that body of work (Lindebaum,
2013b). Consequently, my aim in this arti-
cle is twofold. First, I demonstrate that
Butler uses the term “ideology” incor-
rectly. Second, I contrast his depiction
of my work with what it actually states.
Note that, consistent with previous work
(Lindebaum, 2013a), I am explicit that
a multitude of opinions on this seem-
ingly touchy topic is likely to yield richer
insights than any one dominant view
alone. However, I highlight a need for
accurate usage of terms and accurate
engagement with each others’ work, how-
ever much we might beg to differ on the
topic.
IDEOLOGY IN SCIENCE
The topic of ideology has been a con-
tested line of inquiry in management stud-
ies for some time (see e.g., Alvesson and
Willmott, 1992; Raftopoulou and Hogg,
2010). Key to Butler’s (2014) brief exege-
sis on ideology is the role of dominant
actors when knowledge becomes “ideo-
logical and biased in favor of particular
actors through a conflictural process” (p.
4). H owever, more elaboration is in order
on a topic as complex as ideology. To begin
with, it is important to understand what
scholars mean when they refer to ideol-
ogy. For instance, Van Dijk (1995) defines
ideology along these lines.
“Ideologies are basic frameworks of
social cognition, shared by members
of social groups, constituted by rele-
vant selections of socio-cultural values,
and organised by an ideological schema
that represents the self-definition of
a group. Besides their social function
of sustaining the interests of groups,
ideologies have the cognitive func-
tion of organizing the social represen-
tations (attitudes, knowledge) of the
group, and thus indirectly monitor
the group-related social practices and
hence also the text and talk of its
members” (p. 248).
In other words, ideologies are character-
ized as a system of values, ideas, and
beliefs that seek to legitimize extant hier-
archies and power relations and preserve
group identities. Therefore, ideology oper-
ates in the process of meaning in every-
day life by way of common-sense and
taken-for-granted assumptions that work
to legitimize existing power relations (e.g.,
Fairclough, 1992). The focus upon mean-
ing implies that ideology is viewed as an
imaginary relationship of individuals to
their real world, rather than a reflection
of the real world (Althusser, 1971). If we
take ideology and combine it with the
scientific knowledge we share, it is clear
that knowledge is never free of ideolog-
ical influences. Thus, neither the work
of advocates nor the work of skeptics of
OCN is ideologically free. That is, neither
camp can cast off its “ideological bound-
edness” (Fairclough, 1995). The prob-
lem arises if, among a set of ideologies,
some exercise a more powerful influence
than others, which then starts constrain
some lines of enquiry while privileging
others.
Having defined “ideology,” it is now
possible to examine Butler’s (2014) asso-
ciation of my previous work with “sci-
ence ideology.” He states that “within the
UK,” I am seemingly “a key voice for cri-
tique, however, [I am] perceived by col-
leagues as straying into science ideology”
(p. 4). However, does this accurately reflect
the power balance between advocates and
skeptics of OCN? In terms of numbers of
publications in flagship US management
journals, my counting reveals a score of
at least 15 to 0 in favor of advocates
1
,
so I cannot see that my work is part of
an existing hierarchy that dominates the
field.Inthisrespect,Iamremindedof
Gabriel’s (2010) observation that “what
gets published and what gets rejected . . .
are barely concealed exercises in power and
resistance . . . what gets published is one
of the most political processes” in today’s
academia (p. 761). Thankfully, other
thought-provocative and original journals
like the Journal of Management Inquiry or
1
This score is calculated taking into account three
publications in the Journal of Management,fourin
Leadership Quarterly,oneinOrganization Science,
one in Academy of Management Perspectives,onein
the Journal of Applied Psychology,twoinStrategic
Management Journal,andthreeinOrganizational
Behavior and Human Decision Processes.These
publications represent those I am aware of, hence
excluding any forthcoming or in press articles
that have not been cited widely yet. I admit that
there is a possibility that an article has escaped
my attention. Even so, this is unlikely to funda-
mentally change the score presented. Due to space
limitations, I cannot include the whole list here.
However, it is available upon request.
Frontiers in Human Neuroscience www.frontiersin.org January 2014 | Volume 7 | A rticle 834
|
HUMAN NEUROSCIENCE
16
122

Lindebaum Ideology and organizational cognitive neuroscience
Human Relations (Lindebaum and Zundel,
2013) have been more receptive to my
work
2
.
I also would like to briefly reflect on
Butler’s (2014) wordstotheeffectthat
Iam“perceived by colleagues as straying
into science ideology” (p. 4). The first part
(in italics for emphasis) of that sentence
requires attention. Specifically, I wonder
whether Butler (2014) intended to make
a factual statement, or whether h is com-
ment is based upon hearsay of the kind
we can read in tabloids. If it is the for-
mer, the reader would appreciate evidence
in support of his claim. If it is the latter, I
am not sure whether this statement adds
substance to his article.
MISLEADING CLAIMS
The second point I would like to raise
in response to Butler (2014) is his depic-
tion of key points I offered previously.
To explicate, consider the following first
quote from his article:
“On the one hand, Lindebaum and
Zundel (2013) rightly maintain that
without explicit consideration of,
and solutions to, the challenges of
reductionism, the possibilities to
advance leadership studies theoretically
and empirically are limited” (p. 4).
While it is gratifying to see one’s work
being cited, it is also important that this
is executed correctly in congr uence with
academic conventions of citation prac-
tice. In this case, the above statement is
taken ad verbatim (starting with “main-
tain” and ending with “limited”) from
Lindebaum and Zundel (2013) and, there-
fore, must be accompanied by the page
number (i.e., p. 857). However, this is not
the case.
2
If we follow Duster (2006) in his claim that
funding in the US is increasingly directed
toward “markers inside the b ody” as predictors
of socio-economic and health outcomes, then
this tendency suggests another leverage of the
OCN ideology and its associated power. The
term “power” is most suitable here, as Scott
(1992) defines it as having access to resources
(in this case, research funding). Indeed, President
Obama has just recently announced a US$100
million dollar brain-mapping research initia-
tive. See http://blogs.nature.com/news/2013/04/
obama-launches-ambitious-brain-map-project-
with-100-million.html, accessed 21 October 2013.
There are two more problems
with Butler’s depiction of my work
on the topic in the following
statement:
“On the other hand, it has been
argued that Lindebaum (2012) mis-
characterizes neuro-feedback processes
for the purpose of leader develop-
ment, which then leads to misin-
formed statements about its potential
ethics (Cropanzano and Becker, 2013)”
(pp. 4–5).
The first problem is the reference to
Lindebaum (2012).Thisstudyisnot
devoted in any way to OCN (instead it
focuses on emotional standardizations at
work). The second point pertains to the
statement that I “mischaracterize neuro-
feedback processes” as applied to leader
development, “which then leads to mis-
informed statements about its potential
ethics.” Readers who have perused my
2013(b) article will quickly see that I have
characterized the neurofeedback process
by first defining it according to the view of
the International Society for Neurofeedback
and Research (Hammond et al., 2011). I
have also provided more characteristics of
the neurofeedback process with reference
to the Waldman et al. (2011) study (often
using direct quotes from that study).
Consequently, I cannot discern where
a mischaracterization has occurred. The
same applies to “misinformed statements
about potential ethics,” a point allegedly
made by Cropanzano and Becker (2013) in
response to my article. What Cropanzano
and B ecker (2013) suggest, however, is
that they “strongly endorse [my] call for
scholars and others to pay closer attent ion
to . . . ethical concerns” (p. 306) when neu-
roscience i s used in leadership research.
Of course, Cropanzano and Becker (2013)
also offer divergent and complementary
views on my critique, especially when the y
argue that my “ethical inquiry does not
go far enough” and that “a more complete
analysis suggests that there are additional
matters that should also be considered”(p.
306). However, it is somewhat curious that
Butler takes this to imply “misinformed
statements about its potential ethics.” Fo r
furtherclarificationonCropanzano and
Becker’s (2013) article, please consult
Lindebaum (2013a).
CONCLUDING THOUGHTS
Butler (2014) deserves credit for bringing
into the open the role of ideolog ies in the
construction of knowledge, especially on
a topic that enjoys hardly any substantive
critique, least of all in flagship US manage-
ment journals. However, the clarification
of ideological charges against my work
reveals that the exact opposite of Butler’s
(2014) argument is the case, namely, that
advocates of OCN represent a domi-
nant ideolog ical movement, one which,
through a system of ideas and beliefs, aims
to legitimize extant hierarchies and power
relations and preserve group identities as
indicated by the score presented earlier. It
is, therefore, important for future debates
to be based upon informed views, which
correctly and unequivocally reveal how the
meaning of a term is employed. Since
neuroscience as a theoretical and empiri-
cal toolkit is likely to further consolidate
its influences in management studies (and
how they fit with the theme of this research
forum), it is all the more imperative to
avoid terms being used to silence dis-
senting views or discredit prior work (for
instance, by discarding them as lacking rel-
evance and rigor). For a healthy unfolding
of the debate, I suggest it is also necessary
to engage more accurately with each oth-
ers’ work, for doing otherwise is likely to
unnecessarily create deeper chasms rather
than aiding to bridge them. I hope this
article serves this purpose.
ACKNOWLEDGMENTS
Sincere credit for very insightful sugges-
tionsonanearlierversionofthisarticle
goes to Effi Raftopoulou.
NOTE
This article by Lindebaum refers to a
previous version of the opinion arti-
cle “Operationalizing interdisciplinary
research—a model of co-production in
organizational cognitive neuroscience” by
Butler, which first appeared online in pro-
visional form on 11 October 2013 before
undergoing final publication. In light of
a potential conflict of interest identified
after the initial peer review, the opinion
article by Butler underwent an additional
round of review and was then published
in its current form. The final publication
differs from the original version that first
appeared online.
Frontiers in Human Neuroscience www.frontiersin.org January 2014 | Volume 7 | Article 834
|
123

Lindebaum Ideology and organizational cognitive neuroscience
REFERENCES
Althusser, L. (1971). Lenin and Philosophy and Other
Essays. London: New Left Books.
Alvesson, M., and Willmott, H. (1992). Critical
Management Studies. London: Sage.
Butler, M. J. (2014). Operationalizing interdis-
ciplinary research—a model of co-production
in organizational cognitive neuroscience. Front.
Hum. Neurosci. 7:720. doi: 10.3389/fnhum.2013.
00720
Cropanzano, R., and Becker, W. J. (2013). The promise
and peril of organizational neuroscience: today
and tomorrow. J. Manage. Inq. 22, 306–310. doi:
10.1177/1056492613478518
Duster, T. (2006). Comparative perspectives
and competing explanations: taking on the
newly configured reductionist challenge to
sociology. Am. Sociol. Rev. 71, 1–15. doi:
10.1177/000312240607100101
Fairclough, N. (1992). Discourse and Social Change.
Cambridge: Polity.
Fairclough, N. (1995). Critical Discourse Analysis: The
Critical Study of Language. London: Longman.
Gabriel, Y. (2010). Organization studies: a space for
ideas, identities and agonies. Organ. Stud. 31,
757–775. doi: 10.1177/0170840610372574
Hammond, D. C., Bodenhamer-Davis, G., Gluck, G.,
Stokes, D., Harper, S. H., Trudeau, D., et al. (2011).
Standards of practice for neurofeedback and neu-
rotherapy: a position paper of the international
society for neurofeedback & research. J. Neurother.
15, 54–64. doi: 10.1080/10874208.2010.545760
Lindebaum, D. (2012). I rebel—therefore we exist:
emotional standardization in organizations and
the emotionally intelligent individual. J. Manage.
Inq. 21, 262–277. doi: 10.1177/1056492611430125
Lindebaum, D. (2013a). Ethics and the neuro-
scientific study of leadership: a synthesis and
rejoinder to Ashkanasy, Cropanzano/Becker, and
McLagan. J. Manage. Inq. 22, 317–323. doi:
10.1177/1056492613478515
Lindebaum, D. (2013b). Pathologizing the healthy but
ineffective: some ethical reflections on using neu-
roscience in leadership research. J. Manage. Inq. 22,
295–305. doi: 10.1177/1056492612462766
Lindebaum, D., and Zundel, M. (2013). Not quite
a revolution: scrutinizing organizational neuro-
science in leadership studies. Hum. Relat. 66,
857–877. doi: 10.1177/0018726713482151
Raftopoulou, E., and Hogg, M. K. (2010). The polit-
ical role of government-sponsored social market-
ing campaigns. Eur. J. Mark. 44, 1206–1227. doi:
10.1108/03090561011047599
Scott, W. R. (1992). Organizations: R ational, Natural
and Open Systems. Englewood Cliffs, NJ: Prentice
Hall.
Van Dijk, T. A. (1995). Discourse semantics
and ideology. Discourse Soc. 6, 243–289. doi:
10.1177/0957926595006002006
Waldman, D. A., Balthazard, P. A., and Peterson, S.
J. (2011). Leadership and neuroscience: can we
revolutionize the way that inspirational leaders
are identified and developed? Acad. Manage.
Perspect. 25, 60–74. doi: 10.5465/AMP.2011.
59198450
Received: 21 October 2013; accepted: 03 January 2014;
published online: January 2014.
Citation: Lindebaum D (2014) Ideology in organiza-
tional cognitive neuroscience studies and other mislead-
ing claims. Front. Hum. Neurosci. 7:834. doi: 10.3389/
fnhum.2013.00834
This article was submitted to the journal Frontiers in
Human Neuroscience.
Copyright © 2014 Lindebaum. This is an open-access
article distr ibuted under the terms of the Creative
Commons Attribution License (CC BY). The use, dis-
tribution or reproduction in other forums is permitted,
provided the original author(s) or licensor are credited
and that the orig inal publication in this journal is cited,
in accordance with accepted academic practice. No use,
distribution or reproduction is permitted which does not
comply with these terms.
Frontiers in Human Neuroscience www.frontiersin.org January 2014 | Volume 7 | A rticle 834
|
16
124

HYPOTHESIS AND THEORY ARTICLE
published: 04 June 2014
doi: 10.3389/fnhum.2014.00363
The evolution of leader–follower reciprocity: the theory of
service-for-prestige
Michael E. Price
1
* and Mark Van Vugt
2,3
1
Department of Psychology, School of Social Sciences, Brunel University, Uxbridge, UK
2
Faculty of Psychology and Education, VU University Amsterdam, Amsterdam, Netherlands
3
University of Oxford, Oxford, UK
Edited by:
Carl Senior, Aston University, UK
Reviewed by:
Oliver Scott Curry, University of
Oxford, UK
Christopher Von Rueden, University of
Richmond, USA
*Correspondence:
Michael E. Price, Department of
Psychology, School of Social
Sciences, Brunel University, Uxbridge,
London, Middlesex UB8 3PH, UK
e-mail: michael.price@brunel.ac.uk
We describe the service-for-prestige theory of leadership, which proposes that voluntary
leader–follower relations evolved in humans via a process of reciprocal exchange that
generated adaptive benefits for both leaders and followers. We propose that although
leader–follower relations first emerged in the human lineage to solve problems related
to information sharing and social coordination, they ultimately evolved into exchange
relationships whereby followers could compensate leaders for services which would
otherwise have been prohibitively costly for leaders to provide. In this exchange, leaders
incur costs to provide followers with public goods, and in return, followers incur costs to
provide leaders with prestige (and associated fitness benefits). Because whole groups of
followers tend to gain from leader-provided public goods, and because prestige is costly for
followers to produce, the provisioning of prestige to leaders requires solutions to the “free
rider” problem of disrespectful followers (who benefit from leader services without sharing
the costs of producing prestige).Thus service-for-prestige makes the unique prediction that
disrespectful followers of beneficial leaders will be targeted by other followers for punitive
sentiment and/or social exclusion. Leader–follower relations should be more reciprocal
and mutually beneficial when leaders and followers have more equal social bargaining
power. However, as leaders gain more relative power, and their high st atus becomes
less dependent on their willingness to pay the costs of benefitting followers, service-for-
prestige predicts that leader–follower relations will become based more on leaders’ ability
to dominate and exploit rather than benefit followers. We review evidential support for a set
of predictions made by service-for-prestige, and discuss how service-for-prestige relates
to social neuroscience research on leadership.
Keywords: leadership, followership, reciprocity, collective action, evolutionary psychology, social status, domi-
nance, prestige
INTRODUCTION
Leadership and followership have evolved to facilitate information
sharing and coordinated group action in a wide variety of species
(King et al., 2009). Humans are apparently a dapted for complex
cooperative behaviors that require high levels of expertise, coor-
dination, and solutions to collective action problems (Tooby et al.,
2006), and it would not be surprising if the y, like so many other
species, have also evolved psychological adaptations for leader-
ship and followership (Van Vugt and Ahuja, 2010; Van Vugt and
Ronay, 2014). In this ar ticle, we propose that such adaptations
have indeed evolved, and that they govern the dynamics of leader–
follower relations in human organizations. Our focus is specifically
on leader–follower relations in humans, as opposed to any other
species. We describe a theory of leader–follower relations which we
think will ultimately enhance social neuroscientists’ understand-
ing of the neural processes that enable these relations. Scientists are
still in the early stages of understanding how the mind is adapted
to lead and follow, and of developing neuroscientific methods for
identifying psychological adaptations (Van Vugt, 2014). Never-
theless, the key conceptual elements of a coherent and plausible
evolutionary theory of leader–follower relations are already in
place (Price and Van Vugt, in press), and neuroscientists have
already begun using evolutionary theories of psychological adap-
tation to guide their research on social interactions (Rilling and
Sanfey, 2011). Thus, we propose that evolutionary social psychol-
ogists and social neuroscientists should begin engaging with each
other more on the topic of leader–follower relations, and thinking
about ways in which evolutionary approaches to these relations
could both inform and be informed by neuroscientific research.
From the perspective of evolutionary psychology (Tooby and
Cosmides, 1992, 2005), voluntary social relationships are likely to
evolve if they provide all partners in the relationship with indi-
vidual fitness benefits – that is, with benefits that enhance the
survival and reproduction of the individual (and/or the indi-
vidual’s ver y close genetic kin). We take this perspective on
leader–follower relations, so a key question driving our analysis
is: how might leader–follower relationships have been mutually
fitness-enhancing for both leaders and followers in the environ-
ments of the evolutionary past? We pay close attention to past
evolutionary environments, because any evolved psychological
Frontiers in Human Neuroscience www.frontiersin.org June 2014
|
Volume 8
|
Article 363
|
125

Price and Van Vugt The evolution of leader–follower reciprocity
mechanisms that exist today in the minds of modern humans,
including those governing leader–follower relationships, could
exist only if they functioned adaptively in these environments
(Tooby and Cosmides, 1990).
We propose that voluntary leader–follower relationships –
that is, interactions in which followers voluntarily follow, and
leaders voluntarily lead, because they each perceive some pos-
itive incentive to do so – were adaptive in the past for both
leaders and followers because they involved mutually beneficial
exchange. In this exchange, leaders enhanced the fitness of fol-
lowers by providing them with collectively shared benefits and
resources (often in the form of “public goods”) that enhanced
followers’ wealth, status, and ability to function in coordinated
and cooperative groups, and followers enhanced the fitness of
leaders by providing them with prestige. As we will discuss in
more detail below, by “prestige” we mean social status that is
voluntarily conferred on those who are useful to others, as dis-
tinguished from “dominance,” which is status that is attained
coercively by those who are threatening to others (Henrich and
Gil-White, 2001). Evidence suggests that prestige and dominance
are two distinguishably different paths that individuals can take
in order to increase their social status (Von Rueden et al., 2011;
Cheng et al., 2012).
The more equal the social bargaining power of leaders and
followers (i.e., the more equal their abilities to confer bene-
fits and/or impose costs on one another; Sell et al., 2009), the
more likely the leader–follower relationship would have remained
voluntary, mutually fitness-enhancing, and maximally beneficial
over all. However, the greater the bargaining power of leaders rel-
ative to followers, the more likely the relationship would have
been to transition from being reciprocal and prestige-based to
being coercive, exploitative, and dominance-based. This tran-
sition should occur because from the leader’s perspective, the
leader–follower relationship is advantageous primarily as a means
of acquiring and maintaining high social status. When followers
have relatively high relative bargaining power (e.g., high freedom
to exit the group, hig h power to reject or retaliate against lead-
ers), the easiest way for leaders to achieve hig h status will be to
make themselves useful to followers by offering them benefits in
exchange for prestige. In these situations, if leaders attempt to
claim high status without offering followers anything in return, or
by attempting to dominate and coerce followers, then their would-
be followers can simply reject them (e.g., exit the group or depose
the leader). However, when followers have relatively low bargain-
ing power, leaders will have increased ability to gain and maintain
status based on their ability to dominate, rather than benefit, fol-
lowers. For example, if followers have low power to exit a group or
to strip a leader of his or her high status, then the leader will have
little need to offer them benefits, in order to compel them to (a)
stay in the group or (b) grant the leader high status in exchange
for these benefits. Leaders may sometimes perceive dominance, as
compared to reciprocity, to be an appealingly cheap and efficient
route to high status, as it saves them the costs of having to produce
benefits for followers.
We refer to the above theory of how and why leader–follower
relationships vary from reciprocity to dominance as service-for-
prestige (Price and Van Vugt, in press).
HOW ARE LEADER–FOLLOWER RELATIONS DIFFERENT IN HUMANS
THAN IN OTHER SPECIES?
As noted above, leader–follower relations have evolved in a wide
variety of species to allow individuals to share information and
coordinate their behavior (King et al., 2009). For instance in many
taxa, individuals share knowledge in order to lead followers to the
locations of food, water, and other resources (examples include
ravens, elephants, and most famously honeybees, who map out
directions to resources via wagg le dances); in many fish species,
leader–follower dynamics result in groups (shoals and schools)
that are helpful for avoiding predators and finding food; and
among some primates such as chimpanzees, alpha males lead
aggressive group actions against enemy groups and predators
(Boehm, 1999; Krause and Ruxton, 2002; King et al., 2009). In
the human lineage, just as in other species, leadership probably
evolved initially to solve problems related to information sharing
and social coordination. However, we propose that eventually, evo-
lution enabled humans to use reciprocity to enhance the benefits
of leadership.
To understand why reciprocity could enhance leadership, con-
sider that leader–follower dynamics often evolve in situations
where individuals are better off acting in groups as opposed to
acting alone, for example, because group membership increases
one’s likelihoodof finding resources or escaping predators (Hamil-
ton, 1971; Van Vugt and Kurzban, 2007). Such group movements
present coordination problems, however, associated with deter-
mining who will lead and who will follow. For example, if
Individuals A and B both have an interest in visiting a waterhole
together (because there is safety in numbers), and have several
waterholes to choose from, how will the y choose which one to
visit? There are several ways in which leader–follower dynamics
could emerge to solve this problem (Van Vugt and Kurzban, 2007).
For example, imagine that A prefers a particular waterhole but
B has no preference, and as a result A moves first to choose the
preferred waterhole. Once A has made this move, B is best off
following A, as opposed to making a dangerous solo journey to
a waterhole that offers B no additional benefits. Leadership may
have evolved in many species to solve coordination problems such
as these, when there has been a fitness advantage to the individual
in assuming a leadership role (Van Vugt, 2006).
However, what about situations in which the individual is dis-
advantaged by assuming a leadership role? Many leadership roles
may involve substantial costs to leaders, and individuals may need
special incentives to a ccept these roles. If followers stand to benefit
from a leader’s assumption of a costly role (e.g., if this leadership
would provide protection for followers), then it might profit fol-
lowers to provide the leader with these incentives. This potential
for reciprocity could provide new opportunities for leadership to
evolve, such that leader–follower relations could become not just
matters of coordination but also matters of exchange. We pro-
pose that leader–follower relations evolved as service-for-prestige
transactions in contexts such as these, to enable leadership behav-
iors that would otherwise have been prohibitively costly. However,
engagement in reciprocity, particularly in the complexly coop-
erative social environments of human beings, requires specially
designed social-cognitive abilities that are uniquely sophisticated
in humans (Tooby and Cosmides, 1996; Hammerstein, 2002;
Frontiers in Human Neuroscience www.frontiersin.org June 2014
|
Volume 8
|
Article 363
|
126

Price and Van Vugt The evolution of leader–follower reciprocity
Tooby et al.,2006; Bowles and Gintis, 2011). Therefore, we propose
that service-for-prestige exchange is a crucial aspect of leader–
follower dynamics in humans, but not necessarily in any other
species.
THEORETICAL FOUNDATIONS OF SERVICE-FOR-PRESTIGE:
SYNTHESIZING THEORIES OF RECIPROCITY AND
COLLECTIVE ACTION, AND ACCOUNTING FOR
EVOLUTIONARY MISMATCH
EVOLUTIONARY THEORIES OF RECIPROCITY
Human leader–follower relationships are cooperative interactions
that occur between people who are not necessarily close genetic
kin. One of our key theoretical tools, therefore, will be the main
concept used by evolutionists to explain non-kin cooperation:
reciprocity (Trivers, 1971; Alexander, 1979; Tooby et al., 2006).
Reciprocit y theories assume that because cooperative individuals
incur fitness costs in order to deliver fitness benefits to others, they
must receive some return benefit f rom others as compensation for
these costs. In the absence of such compensation, cooperation will
be maladaptive for cooperators and w ill not evolve.
The most basic form of reciprocal cooperation is direct reci-
procity, described originally by Trivers (1971) as “reciprocal
altruism.” Trivers (1971) described mutually beneficial exchange
between a cooperator (or “altruist”) and a reciprocating partner.
For example, if X pays a cost of size 1 to provide Y with a ben-
efit of size 2, and Y precisely returns the favor, then X and Y
will each have paid a cost of 1 and received a benefit 2, and the
exchange will be mutually profitable. However, it is crucial to
note that Y could have profited even more by “cheating,” that is,
by taking X’s 2 without reciprocating 1. In order for reciprocity
to evolve in direct exchange contexts, cooperators must some-
how avoid being exploited by cheaters, for example, by avoiding
them altogether, or by neutralizing their advantage via punish-
ment. If cheaters consistently tend to come out ahead in these
interactions, they will eventually exploit cooperators to extinction
and cooperation will not evolve (Hamilton, 1964; Trivers, 1971;
Henrich, 2004; Price and Johnson, 2011). Individuals should thus
be predisposed to cooperate with reciprocators, and be averse
to cooperating with cheaters. This prediction is supported by
a large body of evidence from several behavioral science fields
(Price, 2006a). Reciprocity has long been considered a fundamen-
tal attribute of human social systems cross-culturally (Gouldner,
1960), and it is generally considered to be a universal, species-
typical, and highly fitness-relevant human behavior (Brown, 1991;
Rilling and Sanfey, 2011).
The reciprocity theory presented by Trivers (1971) primar-
ily describes reciprocity that is direct and dyadic (i.e., involv ing
direct exchange between two individuals). However, extensions of
this theory have been used to explain other forms of reciprocity.
The best known example is “indirect reciprocity,” that is, interac-
tions in which X’s altruism toward Y is reciprocated not by Y but
by a third party (Alexander, 1979; Nowak and Sigmund, 2005).
There have also been attempts to apply reciprocity theory to direct
exchanges between one individual and a group of other individuals
(Boyd and Richerson, 1988; Price, 2003, 2006a; To oby et al., 2006;
Takezawa and Price, 2010). Because leader–follower relations often
(although not exclusively) involve interaction between one leader
and multiple followers, this kind of reciprocity would seem most
relevant to an understanding of leader–follower exchange. How-
ever, it is not widely accepted among evolutionary researchers
that direct reciprocity can explain the evolution of cooperation in
group contexts such as these (Boyd and Richerson, 1988; Henrich,
2004; Bowles and Gintis, 2011). In the view of these researchers,
direct reciprocity can explain the evolution of simple dyadic coop-
eration, but totally different processes such as cultural group
selection are required to explain cooperation in groups. Our appli-
cation of reciprocity to these contexts, then, does not represent
the consensus view of evolutionary researchers, and important
theoretical questions still need to be resolved about precisely how
leader–follower exchange could evolve.
Nevertheless, despite this lack of a theoretical consensus,
we agree with previous suggestions (Price, 2003, 2006a; To o b y
et al., 2006) that direct reciprocity (in combination with indi-
rect reciprocity) may be a key factor in the evolution of group
cooperation in humans, and we do not think that it is pre-
mature or implausible to suggest that leaders and followers
often engage in mutually beneficial exchange. We propose that
reciprocity theory provides the most appropriate and predic-
tive evolutionary framework for understanding voluntary human
leader–follower interactions, because (1) leaders often incur costs
in their efforts to provide benefits for followers, (2) followers
often incur costs in order to provide prestige which benefits lead-
ers, (3) in order for each of these costly provisioning behaviors
to be adaptive in the ancestral past, both leaders and follow-
ers would have needed to recoup these costs somehow, and
(4) this recoupment could plausibly have occurred via a process
in which leader-produced benefits were exchanged for follower-
produced prestige. Illustrations of why it is often costly for
leaders to provide public goods and for followers to provide pres-
tige, and of why prestige entails fitness benefits, are presented
below.
LEADER–FOLLOWER RECIPROCITY AS A COLLECTIVE ACTION PROBLEM
Our second key theoretical tool is Olson’s (1965) theory of col-
lective action, which states that even if g roup members benefit on
average if their group cooperates effectively, individual members
can often reap the greatest private profits if they “free ride” while
the rest of the group pays the costs of cooperation. This free rider
problem – the private incentive that each individual member has to
free ride on everyone else’s contributions – often seriously under-
mines group efforts to cooperate, and is considered by behavioral
scientists to be the fundamental obstacle to successful collective
action (Yamagishi, 1986; Boyd and Richerson, 1988, 1992; Ostrom,
1990).
Service-for-prestige regards leader–followerreciprocity as a col-
lective action problem because many benefits provided by a leader
(e.g., increased group status, improved group defense, and access
to resources) will be public goods, shared widely and more or less
equally by followers. A leader’s motivation to provide such ben-
efits will thus also constitute a (second-order) public good. T he
public goods provided by the leader will often be costly to produce,
and if increased prestige is what motivates the leader to pay these
production costs (as service-for-prestige predicts), then followers
must succeed in providing the leader with prestige, in order to
Frontiers in Human Neuroscience www.frontiersin.org June 2014
|
Volume 8
|
Article 363
|
127

Price and Van Vugt The evolution of leader–follower reciprocity
maintain production of these public goods. If the prestige allo-
cated to leaders is costly for individual followers to provide, then
its allocation will present a collective action problem for followers
(Price, 2003; Price and Van Vugt, in press).
To understand why prestige allocation should constitute a col-
lective action problem for followers, it helps to first consider social
power more abstractly. Emerson (1962) provides a simple and
useful definition of social power when he notes the reciprocal rela-
tionship between power and dependence: Individual X has power
over Individual Y to the extent that Y must depend exclusively on
X for the achievement of some goal, that is, to the extent that Y’s
ability to achieve the goal is controlled by X. Similarly, because Y’s
goals will generally involve the acquisition of benefits and avoid-
ance of harm, the power of X (i.e., the dependence of Y on X,
and X’s control over Y’s goal achievement) can also be thought
of as X’s ability to confer benefits and/or impose harm on Y (Sell
et al., 2009). If X has high power, this should improve X’s access
to many kinds of resources: if X is highly able to benefit and/or
harm others, then those whom X can benefit/harm will be moti-
vated to act in ways that promote X’s welfare, so that they can
remain in good standing with X and thus acquire these benefits
and/or avoid this harm. As a result, people will tend to go out of
their way to promote X’s welfare (Henrich and Gil-White, 2001;
Sell et al., 2009), for example, by deferring to X’s interests, shar-
ing resources with X, taking pains to avoid causing harm to X,
and cooperating with X. High social power (“status”) is therefore
expected to benefit X’s fit ness by improving X’s access to many
kinds of resources (Von Rueden et al., 2011, in press; for more
on the nature of these resources, see below section on small-scale
societies).
The notion that social power is rooted in ones’ ability to benefit
and/or harm others corresponds well to Henrich and Gil-White’s
(2001) conceptualization of prestige and dominance as two differ-
ent kinds of social status (noted above), with prestige being status
that is voluntarily conferred on those who are perceived as offer-
ing benefits, and dominance being status that is attained coercively
by those who are perceived as threatening harm. (However, note
that these two paths to status w ill rarely be completely distinct,
since traits that lead to prestige can frequently lead to dominance,
and vice versa; Henrich and Gil-White, 2001; Von Rueden et al.,
2011). If prestige is conceptualized as something that is freely con-
ferred, then efforts made by the prestige allocator to promote the
prestigious individual’s welfare ought to be thought of – like any
kind of behavior in which one individual intentionally and vol-
untarily incurs costs to deliver benefits to another individual –
as a kind of biological “altruism” (Tooby and Cosmides, 1996).
We believe that conceptualizing prestige in this way, and distin-
guishing it from dominance, are useful means of understanding
the different ways in which leaders can acquire status. However,
unlike the service-for-prestige theory we present here, Henrich
and Gil-White (2001) regard prestige as something that is offered
in exchange not for public goods but for a private good: the priv-
ilege of affiliating socially with the prestigious individual. In their
view, individuals with high levels of expertise are allocated pres-
tige by those who wish to learn from and copy their behavior; by
allocating prestige to an expert (i.e., by acting in ways that benefit
the expert’s welfare), followers can ingratiate themselves to, and
thus enhance their own ability to copy, the expert. Although we
do agree that prestige allocation may often occur as a way to com-
pensate experts for providing private goods, we suggest that it also
often occurs as a way to compensate leaders for providing public
goods.
If prestige is indeed allocated in exchange for public goods, and
if prestige and its behavioral consequences are indeed costly to
produce, then it becomes easy to see why the allocation of pres-
tige to leaders will entail a collective action problem. In order
for followers to motivate leaders to provide public goods, they
must collectively pay the costs of respect. That is, they must as
a group incur costs to allocate prestige to the leader – and the
increased access to the group’s material, reproductive, and social
resources that this prestige will entail – to an extent that compen-
sates the leader for the cost of providing public goods. Because
this represents a collective action problem, a follower could gain a
free rider’s advantage by accepting the benefits of leadership while
refusing to pay these costs. For example, consider a leader who
routinely incurs costs (e.g., risks his own life in battle, assumes
stressful responsibilities, works long and hard on military strat-
egy) in order to guide his group to success in war. His services
enable his followers to acquire public goods such as better terri-
tory, shared resources, and increased group status. Imagine two
followers in this group, both of whom benefit equally from the
leader’s services. Follower 1 is respectful, and tends to engage
in costly acts that benefit the leader (e.g., does favors for and
shares resources with the leader; refrains from having an affair
with the leader’s wife; takes pains to look out for the welfare of
the leader’s children; strives to comply with the leader’s directives;
pays taxes or tribute to the leader; takes risks to ensure the safety
and health of the leader). Follower 2 free rides on the leader’s
services by doing none of these things, and thus enjoys higher
net benefits (benefits received from the leader’s ser vices, minus
costs paid to be respectful) than Follower 1. Because each follower
in this scenario has a personal incentive to free ride, there is the
risk that the collective effort will fail to produce sufficient pres-
tige to compensate the leader for the costs of providing public
goods.
Just like cheaters in reciprocal exchanges, free riders in collective
actions will exploit cooperators to extinction unless their advan-
tages are neutralized (Yamagishi, 1986; Boyd and Richerson, 1992).
As a result, cooperators strive to neutralize free riders’ advantages
via punishment or social exclusion (Fehr and Gächter, 2002; Price
and Johnson, 2011). The collective action scenario described here
is unusual in that it is a collective action for the purpose of engag-
ing in reciprocity. Collective actions are typically conceptualized as
functioning to produce or acquire some shared material resource
(for example, a group of citizens jointly generating tax revenue, or
a group of hunters jointly killing a large game animal), but in this
case, the joint effort is focused on producing sufficient prestige to
compensate the leader for services rendered. As a result, Follower
2 above is in the unusual position of simultaneously representing
both a cheater in a reciprocal interaction (for failing to engage in
a service-for-prestige transaction with the leader) and a f ree rider
in a collective action (for failing to cooperate with fellow followers
in collectively producing prestige for the leader). Follower 2 will
therefore be a prime target for hostility within the group: both
Frontiers in Human Neuroscience www.frontiersin.org June 2014
|
Volume 8
|
Article 363
|
128

Price and Van Vugt The evolution of leader–follower reciprocity
the leader and the other followers have incentives to punish or
ostracize Follower 2.
Because service-for-prestige is unique (as far as we know) in
regarding the allocation of prestige to leaders as a collective action
problem, it is also unique in predicting that this problem will
need to be solved via the punishment and/or social exclusion of
disrespectful followers. We say more about this prediction and
related predictions below.
MISMATCH THEORY: ANCIENT ADAPTATIONS IN MODERN
ENVIRONMENTS
A final key component of service-for-prestige is mismatch theory.
Because psychological adaptations evolved in ancestral environ-
ments that may be quite different in certain respects than present
environments, we cannot always expect for adaptations to func-
tion adaptively in modern societies (Tooby and Cosmides, 1990).
A common example is human gustatory preferences for fats, sug-
ars, and salts. Because these nutrients were essential but difficult to
acquire in ancestral environments, people have apparently evolved
to be strongly motivated to consume them. These motivations
may function maladaptively in environments where these nutri-
ents are easily obtained, by leading to health problems associated
with over-consumption (Nesse and Williams, 1994). Some aspects
of leader–follower relations may represent mismatches with mod-
ern environments (Van Vugt et al., 2008b); we provide several
examples below.
LEADER–FOLLOWER RELATIONS IN THE HUMAN
EVOLUTIONARY PAST
Before we focus on service-for-prestige in modern contexts, we
will examine how leadership and followership operated in small-
scale (i.e., hunter-gatherer and tribal) societies that most closely
approximate those in which our ancestors spent the vast fr action
of their evolutionary history.
The available evidence suggests that leadership and follow-
ership are universal aspects of human nature: these behaviors
appear at all levels of social organization that have existed since
prehistoric times, including hunter-gatherer and tribal societies
(Brow n, 1991; Van Vugt et al., 2008a). Leadership is used in these
societies to facilitate cooperation in activities such as warfare, forg-
ing political alliances, maintaining within-group order, big game
hunting, and moving camp (Service, 1966; Johnson and Earle,
1987), all of which are vital to the success, status, and fitness
of individuals living in groups. Ethnographic accounts of lead-
ers in these domains generally describe the leaders as men, rather
than women (Service, 1966; Johnson and Earle, 1987). However,
although women only rarely hold the most directly influential
political positions in small-scale societies, they commonly lead in
more indirect ways by exerting substantial influence on political
affairs (Low, 1992; Yanca and Low,2004; Bowser and Patton,2010).
A common obser vation about leadership in small-scale soci-
eties is that it tends to be infor mal and based on achievement
(Fried, 1967; Kelly, 1995). Compared to leaders in industr ial-
ized societies, these leaders have little power to force others to do
what they say. This is especially true in nomadic hunter-gatherer
societies, which, compared to sedentary small-scale societies,
involve smaller group sizes and lower population densities. There
are usually no formal leadership offices or duties in nomadic
hunter-gatherer societies, and leaders tend to lead by persua-
sion and demonstrations of their expertise and ability to benefit
others (Service, 1966; Johnson and Earle, 1987). Nomadic hunter-
gatherers rarely recognize anyone as a formal headman and tend
to express low tolerance for domineering leaders (Service, 1966;
Turnbull, 1968; Lee, 1993).
Small-scale societies also tend to recognize different leaders
in different domains (cf. the concept of distributed leadership;
Gronn, 2002). Leadership requires expertise, and different peo-
ple may have expertise in different a ctivities (Service, 1966). For
instance, the leader of a hunting expedition may not be the same
person who organizes an alliance with a friendly group or a raid
against an unfriendly one. The traditional authority system of the
Navajo, for example, included war leaders, peace leaders (who
organized friendly political interactions), hunt leaders, medical
leaders, and ceremonial song leaders (Shepardson, 1963).
By assisting the group in domains such as political relations
with external groups, maintenance of internal order, big game
hunting, and camp movements, leaders provided followers with
public goods. For instance, success in war can bring a wide vari-
ety of collective benefits, including increased access to territory,
mates, and other resources (Keeley, 1996), and success in hunting
large game produces meat that is widely shared among the entire
residential group (Kelly, 1995). Leaders often incur large costs
to generate these public goods. Big game hunting, for example,
can involve large investments of time and effort and significant
risks. A survey of “persistence hunts” among Kalahari hunter-
gatherers suggests that members of hunting parties chase large
game for 3–6 h across distances of 20–35 km (12–22 mi), in diffi-
cult conditions such as extreme heat and dense bush (Liebenberg,
2006). War leadership represents another example of costly public
goods provisioning; war leaders gain reputations for bravery by
taking risks (for example, fighting in the front lines) that enable
their groups to effectively compete for resources (Meggitt, 1977;
Chagnon, 1988).
Why are leaders willing to incur large costs in order to provide
followers with public goods? Plausibly because provisioning of
public goods is a key way in which members of small-scale groups
can acquire social status (Price, 2003, 2006a,b). Because leaders
in small-scale societies have little power to coerce and dominate
followers, their high status appears to be more similar to voluntar-
ily conferred prestige than to dominance (Henrich and Gil-White,
2001; Van Vugt and Ahuja, 2010). These leaders benefit from their
high status: prestigious individuals are highly valued by others as
friends and allies and therefore social and material resources tend
to flow their way. Leaders’ increased access to these resources may
sometimes be observable only over the long-term, as opposed to
the immediate short-term (Von Rueden et al., in press); for exam-
ple, among Ache forager-horticulturalists, those who consistently
produce and share large amounts of food appear to be rewarded
over the long-term by receiving more food from others when they
are sick or injured (Gurven et al., 2000). In a communit y of Tsi-
mane hunter-horticulturalists, the most prestigious and influential
men did not receive more shared food over the short-term, but
were more likely to receive social support (e.g., help with labor),
food, and cash during times of crop failure (Von Rueden, 2011
).
Frontiers in Human Neuroscience www.frontiersin.org June 2014
|
Volume 8
|
Article 363
|
129

Price and Van Vugt The evolution of leader–follower reciprocity
Similarly, magnanimous leadership among the Martu Aborigines
in Australia is believed to be rewarded over the long-term w ith
social and political suppor t (Bird and Bliege Bird, 2010).
A further important way in which status enhances male fit-
ness in these societies is by contributing to reproductive success.
Status is attractive both to women (Ellis, 1992; Li, 2007) and
to parents who wish to betroth their daughter to a high status
man as a way of creating a useful ally (Hart and Pilling, 1960;
Kelly, 1995). Ethnographic evidence suggests that in these soci-
eties, higher status men – or leaders – have more wives and sexual
partners, as well as higher-fertility wives and more surviving off-
spring (Levi-Strauss, 1967; Chagnon,1979, 1988; Betzig, 1986; Von
Rueden et al., 2008, 2011). For example, relatively high levels of
status and reproductive success are attained both by leaders in the
hunting domain who provide their g roup with large game as a
public good (Hawkes, 1993; Hawkes and Bliege Bird, 2002), and
by leaders in the war domain who contribute to their group’s abil-
ity to compete for resources (Matthiessen, 1962; Meggitt, 1977;
Chagnon, 1988).
The importance of leadership in small-scale societies tends to
correlate positively with the degree to which settlement patterns
are sedentary as opposed to nomadic, because sedentism permits
larger residential group sizes and higher population density (Fried,
1967; Johnson and Earle, 1987; Marlowe, 2011). When groups
are larger, coordination and collective action problems involved
in group action are harder to solve, and leadership is relatively
more important (Carneiro, 2000; Tooby et al., 2006; Hooper et al.,
2010). Within-group disputes between members (e.g., dyadic
conflicts) may also become more frequent in larger groups, neces-
sitating leadership to resolve them. Further, when population
density is lower and it’s easier to move camp, individuals can
more freely leave and switch groups. Nomadic hunter-gatherers
exhibit “fission–fusion” social organization, with unstable group
membership rosters. Groups may break apart or join together,
depending on the abundance of local resources and the quality of
social relationships within the group (Turnbull, 1968; Kelly, 1995).
This arrangement makes it relatively easy for group members to
escape a leader who becomes too dominant. But with increases
in sedentism and population density, fission–fusion social orga-
nization becomes less tenable, and followers become less capable
of exiting groups with dominant leaders (Boehm, 1999; Price and
Van Vugt, in press). Sedentism may also be associated with more
powerful leadership if it is enabled by the presence of a “patchy”
resource (i.e., one concentrated in a fixed location) that can be
monopolized and controlled by leaders, such as the salmon runs
of the Northwest Coast described below (Kelly, 1995).
The transition to agriculture is associated with increases
in g roup size, population density, and sedentism, as well as
increases in the power and dominance of leaders. Typical nomadic
hunter-gatherer bands consist of 25–50 members, but typical
hunter-hort iculturalist villages consist of 100–400 residents (John-
son and Earle, 1987; Kelly, 1995). Leaders are more powerful in
hunter-hort icultural compared to nomadic hunter-gatherer soci-
eties, with formally recognized “Big Men” exhibiting enduring
political authority, and with social organization becoming more
hierarchical (Meggitt, 1977; Johnson and Earle, 1987; Chagnon,
1997; Boehm, 1999). Greater sedentism and population density
also mean that hunter-horticultural settlements are more “socially
circumscribed”(i.e., hemmed in by neighboring settlements) than
the camps of nomadic hunter-gatherers (Chagnon, 1997), which
reducesthe feasibility of fission–fusion organizationand the ability
of followers to escape overly dominant leaders.
However, it is not agriculture per se, but rather the increased
group size and population density that agriculture permits, that
seems to lead to increases in the power and dominance of lead-
ers. The Indians of the American Pacific Northwest Coast provide
a useful illustration of how leaders can become more powerful
and dominant with increases in group size and population den-
sity, even in the absence of agriculture (Price and Van Vugt, in
press). By residing near salmon-rich rivers, these hunter-gatherers
could maintain sedentary villages of 500–800 people and popula-
tion
densities
of one to two people per square mile, both unusually
high figures for either hunter-gatherers or hunter-horticulturalists
(Johnson and Earle, 1987). These villages required strong leaders
because it is challenging to organize large groups for collective
action and resourceredistribution (Fried,1967; Johnson and Earle,
1987). Accordingly, Northwest Coast leaders were much more
powerful than typical hunter-gatherer leaders, and are regarded
by anthropologists as being the key to the functioning of the
Northwest Coast political economy (Johnson and Earle, 1987).
These leaders were clearly identified by followers as chiefs and as
essential group representatives in political interactions, and they
broadcast their wealth and status in lavish potlatch ceremonies in
which they distributed and sometimes destroyed large collections
of their material goods.
Not only were followers more dependent on leaders in the envi-
ronments of the Northwest Coast, they were also more helpless to
escape dominant leaders, due to the unfeasibility of fission–fusion
organization (that is, the sedentary lifestyle and high popula-
tion density made it more difficult for group members to hive
off from groups with bad leaders, in order to live and forage
in a different territory). Moreover, the patchy distribution of
salmon runs enabled chiefs to control a ccess to the region’s most
important food resource, which further increased follower depen-
dence (Kelly, 1995). The decreased exit options and increased
dependence of followers seem to have increased the extent of
dominance-based leader–follower relationships: although slavery
is rare in hunter-gatherer societies, it was common throughout the
Northwest Coast, with slaves composing 7–15% of a typical com-
munity (Kelly, 1995). As noted above, this association between
reduced follower bargaining power and increased dominance in
leader–follower relations is a prediction of service-for-prestige,
which assumes that leaders tend to maintain their high status in
the least costly way that they can; if they can maintain it without
having to pay the costs of providing benefits for followers, they will
tend to do so. That is, when followers are more powerless to escape,
reject, or retaliate against leaders, leaders will more likely attempt
to maintain their status via their ability to dominate and exploit
followers, as opposed to their ability to engage in reciprocity with
them.
The positive relationships between group size/population den-
sity and more powerful leadership can also be observed not just
by comparing different societies but by comparing different settle-
ment patterns within the same society. Carneiro (2000) describes
Frontiers in Human Neuroscience www.frontiersin.org June 2014
|
Volume 8
|
Article 363
|
130

Price and Van Vugt The evolution of leader–follower reciprocity
how these patterns changed seasonally among North American
Plains Indians. For most of the year they lived in small bands of
about 50 people, but during the summer buffalo hunt 20 or more
of these bands would coalesce to form a much larger group. The
dramatic size increase was accompanied by an equally dramatic
elaboration of leadership structure. Whereas leadership in the sin-
gle band involved little power and few duties (i.e., it was fairly
typical of a small nomadic foraging society), leadership in the large
aggregation involved a tribal council of band leaders headed by a
designated tribal chief, as well as several men’s societies, including
one that acted as a police force to maintain order in the settlement.
Like the different small-scale societies discussed above, the
hunter-gatherer societies of the human evolutionary past have
probably varied considerably in terms of key demographic fac-
tors such as group size and population density (Kelly, 1995). We
suggest that this variation affected the balance of power between
leaders and followers and therefore influenced the prevalence of
reciprocal versus coercive leadership of these societies. We also
suggest that human mental adaptations for leadership and follow-
ership were designed by the selection pressures that existed across
this range of different environments, and so are calibrated to gen-
erate a range of behavioral outputs, depending on the balance
of power between leaders and followers that is perceived in the
environment.
SERVICE-FOR-PRESTIGE IN INDUSTRIALIZED SOCIETIES
The human mind was designed by and for the environments of
small-scale ancestral societies (Tooby and Cosmides, 1990, 1992,
2005). The above examination of leader–follower relations in such
societies therefore provides an essential foundation for our next
task, which is to evaluate the extent to which predictions of service-
for-prestige are supported by observations of leader–follower
relations in industrialized societies.
PREDICTION 1: FOLLOWERS PREFER TO CHOOSE THEIR OWN LEADERS,
BY ALLOCATING PRESTIGE TO THOSE WHO PROVIDE THEM WITH
BENEFITS
Experimental evidence suggests that people in industrialized soci-
eties, just like in small-scale societies, prefer to follow leaders
who they have chosen themselves, rather than leaders who have
been imposed on them by an external agent (Van Vugt et al.,
2004). Further, their mechanism for choosing leaders is simi-
lar to that used in small-scale societies (Price, 2003, 2006a,b):
they reward group-beneficial contributions with prestige (Price
and Van Vugt, in press). Studies conducted among both univer-
sity students and business employees indicate that when group
members are allowed to allocate status to the co-members of
their choosing, they allocate it to those who have demonstrated
their willingness and ability to benefit the group (Flynn, 2003;
Hardy and Van Vugt, 2006; Anderson and Kilduff, 2009; Willer,
2009). This process of status acquisition via engagement in group-
beneficial tasks has been termed “competitive altruism” (Roberts,
1998; Barclay, 2004; Hardy and Van Vugt, 2006; McAndrew and
Perilloux, 2012): because group members obtain an individual
advantage by achieving high status, and because status can be
acquired via pro-group altruism, members compete with each
other to be the most group-beneficial.
Representative governments (e.g., forms of democracy) are also
characterized by processes whereby followers can choose their
own leaders, and award prestige to leaders who benefit them
(e.g., by voting them into office). Political philosophers have
long noted that these processes are key reasons why representa-
tive governments tend to be more effective in delivering benefits
to citizens, compared to less reciprocal arrangements such as
monarchy (Locke, 1689; Mill, 1861). In most businesses, how-
ever, such democratic processes are absent, and leaders are simply
imposed on followers. Thus a central dynamic of leader–follower
reciprocity – the process whereby followers choose their leaders,
and allocate prestige to them based on their ability to provide
group benefits – cannot occur in most businesses, which probably
results in followers becoming alienated and losing motivation to
cooperate voluntarily with leaders (Price and Van Vugt, in press).
Some successful businesses, however, are exceptions to this rule.
Leaders at W. L. Gore and associates, for example, are selected
via a process in which employees choose who they want to fol-
low, rather than one in which b osses are imposed on employees.
The philosophy behind this practice – “if you attract followers,
then you’re a leader” – recalls the bottom-up process of leader
selection that prevails among nomadic hunter-gatherers. W. L.
Gore’s very low employee turnover rate suggests that they are
implementing this practice to good effect (Van Vugt and Ahuja,
2010).
PREDICTION 2: PREFERENCES FOR LEADERS WILL BE BIASED IN FAVOR
OF PHYSICALLY FORMIDABLE AND INTELLIGENT MALES, AND MAY BE
MISMATCHED WITH MODERN ENVIRONMENTS
Because of processes in sexual selection (Darwin, 1871; Trivers,
1972), men are on average more physically formidable (e.g., taller
and stronger) than females. In the ancestral-type environments
of small-scale societies, some of the most important domains in
which leadership is required are male-dominated activities requir-
ing high physical formidability, such as hunting and war. The
leaders who are chosen in such domains are almost always males
(Service, 1966; Johnson and Earle, 1987). As a result, our minds
may have evolved to be biased toward assuming that all else equal,
physically formidable males make the most appropriate leaders
(Van Vugt and Ahuja, 2010). (Indeed more generally, people seem
to cognitively encode the concept of political power as a human
body, with higher power represented by a more formidable body;
Holbrook and Fessler, 2013).
Followers do appear to exhibit such biases in industrialized
societies: experimental and field studies of general leadership pref-
erences suggest that people tend to prefer leaders who are male
(Carlson et al., 2006; Elsesser and Lever, 2011), who are per-
ceived as taller based on their stature or facial height (Judge and
Cable, 2004; Gawley et al., 2009; Blaker et al., 2013; Re et al., 2013),
and who are perceived as healthier based on their bodily motion
(Kramer et al., 2010). Facial appearance may also provide cues
to pubertal testosterone levels and thus to physical formidability.
For example, male militar y academy graduates who were rated as
appearing more dominant in their student portraits went on to
achieve higher status in their careers (Mazur and Mueller, 1996).
Another formidability-related cue is physical attractiveness; traits
that areperceived as attractive are believed to be those which would
Frontiers in Human Neuroscience www.frontiersin.org June 2014
|
Volume 8
|
Article 363
|
131

Price and Van Vugt The evolution of leader–follower reciprocity
have indicated health and biological quality in the ancestral past
(Grammer et al., 2003). Accordingly, followers express preferences
for physically attractive leaders (Anderson et al., 2001; Van Vugt
and Ahuja, 2010).
Preferences for physically formidable male leaders may, how-
ever, be mismatched with leadership requirements in modern
organizations (Van Vugt et al., 2008b). Our ancestors’ need for
expertise in male-dominated, physically aggressive coalitional
activities such as hunting and war is much-reduced in modern
businesses, but biases in favor of physically formidable males per-
sist. As a result of such biases, people in industrialized societies
may, for reasons that have become largely obsolete, tend to over-
look females and physically unimpressive males as candidates for
leadership positions, even if these candidates are in fact well-suited
for leadership in modern contexts (VanVugt et al.,2008b; Price and
Van Vugt, in press). On the other hand, even if there is less of a
genuine need for physically formidable leaders in modern orga-
nizations than there was in the ancestral past, such leaders may
nevertheless perform especially effectively in some kinds of lead-
ership roles, due to how they are perceived by others. For example,
a leader’s high formidability could increase his bargaining power
in social interactions by making him seem more intimidating to
others (Sell et al., 2009; Lukaszewski, 2013); as a result that leader
might be relatively effective in tasks like deterring uncooperative
behaviors among followersand winning negotiations with external
groups.
Other leader traits that tend to be widely preferred are intelli-
gence and communication skills (Den Hartog et al., 1999; Judge
et al., 2004). These preferences also seem consistent with the
requirements of leadership roles in the ancestral past (Tooby et al.,
2006; Van Vugt et al., 2008a). For instance, intelligence is neces-
sar y for making decisions that will affect group welfare in a positive
way (e.g., developing a strategy for successful group cooperative
action), and communication skills are essential for implementing
these decisions (e.g., persuading followers about the wisdom of
that strategy, and ensuring that the group acts out that strategy
in a precise and coordinated way). Unlike traits related to physi-
cal formidability, however, intelligence and communication skills
are probably just as genuinely relevant to leadership roles in mod-
ern environments as they were in the ancestral past. Competent
leadership in an industrialized society generally has little to do
with killing large game or physically dominating rivals, but con-
tinues to have much to do with devising and communicating a
successful strategy for collective action (Price and Van Vugt, in
press).
PREDICTION 3: PREFERENCES FOR LEADERS WILL BE DIFFERENT IN
DIFFERENT DOMAINS, AND MAY BE MISMATCHED WITH MODERN
ENVIRONMENTS
Leadership ability can be domain specific, and just as small-scale
societies distinguish among several kinds of leaders (as noted
above), members of indust rialized societies prefer different leaders
for different roles (Price and Van Vugt, in press). This may be a
major reason why leadership is often shared in successful organi-
zations (Wassenaar and Pearce, 2011). For example, experimental
participants prefer leaders with a more masculine facial appear-
ance (like John McCain) in the context of war and intergroup
competition, and prefer leaders with a more feminine face (like
Barack Obama) in peaceful contexts (Little et al.,2006; Spisak et al.,
2012a,b). Domain-specific leadership preferences may even be
strong enough to override the general bias in favor of male leaders,
noted above: experimental evidence suggests that although male
leaders are preferred in times of intergroup competition, female
leaders are preferred when there is a need for conflict resolution
within the group (Van Vugt and Spisak, 2008).
On the other hand, our bias toward domain-specific leader-
ship may sometimes lead us astr ay, and can be another example
of mismatch (Van Vugt and Ronay, 2014; Price and Van Vugt, in
press). Hunter-gatherer collective actions tend to be small and
therefore relatively simple to organize and manage, so domain-
specific expertise (as opposed to management skills) may often
be the most important requirement for competent leadership.
It might make sense, for example, to choose the leader of a
three-member hunting expedition based on hunting expertise.
In a complex modern organization, however, the gulf between
domain-specific expertise and leadership can be more vast, and
managerial roles can require skills that have very little to do
with this expertise itself. In many professional sports, for exam-
ple, great former players are often preferred as managers, despite
an absence of evidence that better players make better managers
(Van Vugt and Ahuja, 2010). We should question our bias toward
assuming that superior ability in a specific activ ity will make one
particularly well-suited to lead an organization related to that
activity.
PREDICTION 4: FOLLOWERS WILL PREFER COMPETENT, PROSOCIAL,
AND “FAIR” LEADERS, BUT SOME PREFERENCES MAY BE
MISMATCHED WITH MODERN ENVIRONMENTS
According to service-for-prestige, followers are adapted to favor
leaders who are willing and able to provide them with benefits
(Price and Van Vugt, in press). Accordingly, research suggests
that people from a wide variety of cultures do prefer leaders
who score highly on both prosociality and competence (Van
Vugt et al., 2008a). The 61-culture GLOBE survey of univer-
sally valued leader traits (Den Hartog et al., 1999) indicates that
prosocial disposition (e.g., trustworthiness, fairness) and posses-
sion of group-beneficial skills (e.g., intelligence, competence) are
consistently valued attributes of leaders cross-culturally. These
findings complement a review by Hogan and Kaiser (2005), which
identified traits indicating prosociality (e.g., modesty, humil-
ity, and integrity) and group-beneficial skills (e.g., decisiveness,
competence, and vision) as the most important characteris-
tics of successful leaders. With regard to these prosocial traits,
note that Hogan and Kaiser (2005) define integrity as “keep-
ing one’s word, fulfilling one’s promises, not playing favorites,
and not taking advantage of one’s situation” (p. 173). Integrity
is thus essentially synonymous with trustworthiness, which is
an essential trait in a reliable reciprocal partner (Price, 2006a;
Rilling and Sanfey, 2011). The emphasis on modesty and humil-
ity suggests that followers prefer leaders who are not overly
self-centered, which would allow them to focus more on the
interests of followers (Price and Van Vugt, in press). Indeed,
other results from the GLOBE survey indicate universal dis-
taste for traits associated with leadership that is self-serving and
Frontiers in Human Neuroscience www.frontiersin.org June 2014
|
Volume 8
|
Article 363
|
132

Price and Van Vugt The evolution of leader–follower reciprocity
unconcerned w ith the interests of followers (e.g., dominance,
selfishness).
This aversion to overly self-centered leadership is the flip
side of the preference for prosocial leaders: leaders are reviled
if they control groups in a manner that benefits themselves
while harming followers (Tooby et al., 2006). A recent event that
epitomizes this principle is the extent to which New Jersey Gov-
ernor Chris Christie has been excoriated for his perceived role
in the “Bridgegate” scandal. Christie’s political allies allegedly
orchestrated the partial closure of the Fort Lee bridge from
New Jersey to New York – the busiest motor-vehicle bridge
in the world – in order to punish Fort Lee’s mayor for not
endorsing Christie’s candidacy (Kleinfeld et al., 2014). The lane
closures caused traffic chaos and imposed large costs on Christie’s
own electorate, all for the intended purpose of generating a
narrowly selfish and relatively trivial benefit for Christie. It is
also worth considering, in this context, that the extreme lev-
els of income inequality that can obtain in modern businesses
may be perceived by followers as exploitative failures of reci-
procity. CEOs in the United States between 2000 and 2013,
for example, made 200–400 times as much as the average
worker (Mishel and Sabadish, 2013), a level of inequality that
far exceeds those observed in hunter-gatherer societies (Smith
et al., 2010). Leaders who accept salaries that are massively
higher than those of followers may be seen as hoarding group
resources for their own selfish ends (Price and Van Vugt, in press;
Van Vugt et al., 2008a).
Finally, note that although people universally prefer “fair” lead-
ers (Den Hartog et al., 1999), this universality probably masks
some important underlying variance. Because different types of
followers prefer different kinds of fairness, it will often be difficult
for a leader to achievereciprocity with all followers simultaneously.
Whereas some followers may perceive social equality as maxi-
mally fair, others may see some forms of inequality as maximally
fair, for example, inequality that results from socially sanctioned
competition (such as better-qualified job candidates compet-
ing successfully for higher-paying jobs). Increased approval of
inequality and competition is expressed by individuals who are
better-positioned to win competitions for status and resources,
such as the highly educated, the wealthy, and members of ethnic
majorities (Ritzman and Tomaskovic-Devey, 1992; Pratto et al.,
2006; Kunovich and Slomczynski, 2007).
Other traits associated with approval of inequality and com-
petition may be more comprehensible in terms of ancestral
environments than modern ones. For example, men who are rela-
tively muscular are more likely to approve of social and economic
inequality (Price et al., 2011), particularly if they are relatively
wealthy (Petersen et al., 2013; however, this research also found
that relatively muscular men are less approving of inequality if they
are relatively poor). Muscular men are also more likely to endorse
aggressive methods of conflict resolution, including war (Sell et al.,
2009; Price et al., 2012). These preferences may have been adaptive
ancestrally, when muscularity was relatively key to success in social
competitions, but seem less rational in modern contexts in which
such success has more to do with education and technology. Thus,
the kind of “fair” leaders that followers prefer may sometimes be
mismatched with aspects of modern environments.
PREDICTION 5: FOLLOWERS WILL PREFER LEADERS WHO DELIVER
INGROUP ADVANTAGE
Ancestrally, one of the most vital benefits leaders could provide
was expertise in matters of intergroup competition, and in mod-
ern environments, followers prefer leaders who are perceived as
ingroup members and strong representatives of ingroup interests
(Hogg,2001). At times when the ingroup is threatened by an exter-
nal enemy, members will most exhibit this pro-ingroup bias and be
most supportive of their leader (the “rally effect”; Van Vugt et al.,
2008a). The rally effect benefits followers, who gain security via
their increased willingness to cooperate with the leader’s efforts
to organize them against the enemy, and it also benefits leaders,
who gain status due to their increased ability to benefit the group
(Van Vugt and De Cremer, 1999). Because the rally effect enhances
the leader’s status, there is the potential for abuse; leaders could
exaggerate or provoke an external threat in order to consolidate
their own power (Price and Van Vugt, in press).
On the other hand, leaders can also use the rally effect in a less
self-serving and more group-beneficial way. If followers are per-
suaded by a leader of a great need to beat a competitor, they may
cooperate particularly effectively: experimental evidence suggests
that groups are more cooperative and productive when they per-
ceive a competitive threat from an external group (Van Vugt et al.,
2007; McDonald et al., 2012). Note, however, that this tendency
appears to be stronger in males than females, which suggests that
it evolved in conditions of male coalitional violence (Van Vugt
et al., 2007). This suggestion is also made by evidence that peo-
ple who are experiencing or have experienced life during wartime
tend to play e conomic games in a more cooperative and egalitarian
manner (Gneezy and Fessler, 2012; Bauer et al., 2014).
PREDICTION 6: DOMINANT LEADERSHIP EMERGES WHEN FOLLOWERS
LACK EXIT OPTIONS
Service-for-prestige predicts that leaders benefit by adopting a
more dominant and coercive leadership style when they can get
away with it, because this saves them the costs of delivering ben-
efits to followers. Leaders should be able to get away with this
more in modern contexts in which their bargaining power relative
to followers is increased for whatever reason, for example, due to
it becoming institutionally normalized (Henrich and Gil-White,
2001) in a way that increases follower dependence (Emerson,
1962). One of the most important ways in which leaders’ rel-
ative power will be increased in modern societies, however, is
if followers have reduced power to exit groups. It was noted
above that leadership in small-scale societies seems to become
more dominant and less reciprocal when followers have bet-
ter exit options, and it has long been suggested that a similar
pattern exists in industrialized societies, with leadership becom-
ing more autocratic when members have fewer exit options (cf.
Hirschman, 1970).
In consideration of the above, service-for-prestige expects
that leaders of moder n organizations will more likely adopt a
dominance-based leadership style when employees are less able
or willing to leave their jobs, or to otherwise reject or retaliate
against non-beneficial leaders (Price and Van Vugt, in press). In
such situations, it will be less necessary for leaders to pay the
costs of providing benefits to followers in order to compel them
Frontiers in Human Neuroscience www.frontiersin.org June 2014
|
Volume 8
|
Article 363
|
133

Price and Van Vugt The evolution of leader–follower reciprocity
to remain in the organization. This may explain why employees
with better exit options tend to receive a greater share of organi-
zational rewards (Rusbult et al., 1988). If leaders adopt a coercive
leadership style when their followers do possess good exit options,
they w ill likely lose followers: in experimental research by Van Vugt
et al. (2004), members defected more from groups if they were led
by autocratic-style instead of democratic-style leaders.
When followers lack exit options, and thus have reduced
bargaining power to demand reciprocity with leaders, a more com-
fortable niche is created for leaders who are concerned only w ith
maximizing their own power and who have no genuine regard
for follower interests (Price and Van Vugt, in press). Such toxic
leadership may be exhibited by those with high scores on at least
one of the “dark triad” traits of Machiavellianism, narcissism, and
psychopathy (Paulhus and Williams, 2002; Van Vugt and Ahuja,
2010). Such traits appear to be more prevalent among corporate
leaders than among the general population (Babiak et al., 2010),
and employees who serve under leaders high in such traits report
reduced well-being and job satisfaction (Mathieu et al., 2014).
PREDICTIONS 7 AND 8: DISRESPECTFUL FOLLOWERS OF BENEFICIAL
LEADERS WILL ATTRACT SOCIAL PENALTIES (PUNISHMENT AND/OR
SOCIAL EXCLUSION) FROM OTHER FOLLOWERS, WHEREAS
DISRESPECTFUL FOLLOWERS OF NON-BENEFICIAL LEADERS WILL
ATTRACT SOCIAL REWARDS (ENHANCED REPUTATION AND PRESTIGE)
FROM OTHER FOLLOWERS
We conclude this section by looking at some of the novel pre-
dictions that service-for-prestige is able to make because it regards
leader–follower reciprocity as a collective action problem. As noted
above, service-for-prestige predicts that leaders provide public
goods to followers in exchange for prestige, which followers must
collectively supply. As in any collective action, this presents a
free rider problem: a follower who took leader-provided bene-
fits without paying the costs of respect (by going out of one’s
way to promote the welfare and interests of the leader, includ-
ing by defer ring to and cooperating with the leader) would be
advantaged over respectful followers. In order to solve this prob-
lem, this advantage would have to be neut ralized or reversed.
As in other collective actions, this neutralization/reversal would
be expected to occur via the imposition of social penalties on
the free rider, in the form of punishment (e.g., physically harm-
ing or appropriating resources from the disrespectful follower)
and/or social exclusion (i.e., preventing the disrespectful fol-
lower from participating in advantageous social and cooperative
interactions; Fehr and Gächter, 2002; Price and Johnson, 2011).
Thus, a general prediction of service-for-prestige is that disre-
spectful followers of beneficial (i.e., public-good-provisioning)
leaders will tend to attr act social penalties from other members
of their group. Note that because such a penalty would repre-
sent a cost imposed on not only a free rider in a collective action
but also a cheater in a reciprocal exchange (with the leader), it
could take the form of negative indirect reciprocity (Alexander,
1979; Nowak and Sigmund, 2005), whereby one follower imposes
costs on another for failing to engage in reciprocity with the
leader.
In considering the various ways by which social penalties could
be imposed on disrespectful followers, it is important to keep in
mind that to the extent that a penalty is costly to impose, it could
lead to a second-order free rider problem (Yamagishi, 1986; Boyd
and Richerson, 1992). Second-order free riders in this situation
would be followers who paid the costs of respect, but who did not
penalize disrespectful followers; they would obtain the benefit pro-
duced by these penalties (i.e., the leader’s continued motivation to
produce public goods), but by avoiding the costs of administering
these penalties, they would acquire higher net benefits than fol-
lowers who paid to allocate both prestige and penalties. There are
a variety of ways in which evolution could overcome the recur-
sive nature of free rider problems and there is no consensus about
howitdoesso(Price, 2003). However, researchers do agree that
evolution overcomes these problems somehow (Boyd et al., 2003;
Barclay, 2006; Bowles and Gintis, 2011).
Researchers also agree that the penalties used to solve these
problems can take the form of direct punishment, and that
cooperators in collective actions tend to experience punitive
sentiment toward free riders (Price et al., 2002; Mathew and
Boyd, 2014). Punitive sentiment leads those who experience it
to support and advocate the punishment of free riders, and
may lead them to administer this punishment themselves (Fehr
and Gächter, 2002; Price, 2005). It is therefore plausible that
respectful followers experience punitive sentiment toward disre-
spectful followers, and act on this sentiment either by punishing
these followers themselves, or else by advocating and support-
ing the punishment of these followers by other group members.
This punishment could be administered by one specific member
(O’Gorman et al., 2009), including the leader him/herself. Even
in situations in which leaders impose such penalties themselves,
we would expect for followers to experience punitive sentiment,
as it would lead them to lend political support to the leader’s
punitive actions. Punishment could also be administered in a
coordinated manner by more than one member; coordinated pun-
ishment could reduce the per capita costs of punishment and thus
mitigate the second-order free rider problem (Boyd et al., 2010;
Guala, 2012).
The social penalties of free riding do not have to involve direct
or explicit punishment, and in both small-scale and industrial-
ized societies they may take the form of informal social sanctions
that lead to reputational damage (Fried, 1967; Falk et al., 2005).
Among hunter-horticultural Shuar, for example, villagers who are
perceived as being less respectful of a popular leader are themselves
respected less (Price, 2003). The main costs of such reputational
damage may involve exclusion from advantageous social inter-
actions (Barclay and Willer, 2007; Sylwester and Roberts, 2010;
Baumard et al., 2013). In modern organizations, employees who
act disrespectfully toward popular leaders may be sanctioned by
other employees via social exclusion processes that are facilitated
by gossip (Barkow, 1992; Williams, 2007).
Note that the prediction of social penalties (punishment and/or
social exclusion) for disrespectful followers only applies to situa-
tions in which leaders are providing followers with public goods,
because this is the only context in which followers w ill need to
engage in reciprocity with leaders by collectively providing them
with prestige. If followers do not perceive that a leader is provid-
ing them with benefits, they should not be motivated to generate
prestige for that leader, nor to impose costs on other followers who
Frontiers in Human Neuroscience www.frontiersin.org June 2014
|
Volume 8
|
Article 363
|
134

Price and Van Vugt The evolution of leader–follower reciprocity
fail to generate prestige. On the contrary, if the leader is unpop-
ular, followers should tend to regard disrespectful followers in a
positive light. Leaders will be unpopular if they are seen as failing
to provide public goods for one reason or another, for example,
because they are incompetent or exploiting followers for their own
narrowly selfish ends (Tooby et al., 2006), and followers face the
problem of how to collectively strip such leaders of status. A dis-
respectful follower of an unpopular leader r isks retaliation from
the leader, and so will be seen by co-members as a selfless and
prestige-worthy contributor to the public good: if you brave the
wrath of Darth Vader, you will become a hero to the rebellion.
Thus according to serv ice-for-prestige, rescinding status from a
non-beneficial or exploitative leader, just like supplying it to a ben-
eficial one, is a collective a ction problem (Price and Van Vugt, in
press). Accordingly, service-for-prestige predicts that disrespectful
followers of such leaders will attract social rewards from other fol-
lowers. These rewards will come in the form of enhanced prestige,
which like all forms of prestige (as discussed above) should afford
increased access to material, reproductive, and/or social resources.
DISTINGUISHING SERVICE-FOR-PRESTIGE FROM OTHER
LEADERSHIP THEORIES
NOVEL PREDICTIONS OF SERVICE-FOR-PRESTIGE
A Lakatosian view (Lakatos, 1978) suggests that a progressive sci-
entific theory will make not only correct predictions shared by
other theories, but also novel correct predictions. Some predic-
tions of service-for-prestige presented above may be shared with
many leadership theories (e.g., that followers will prefer lead-
ers who are intelligent, competent, and able to deliver ingroup
advantage). We included these predictions not to suggest that they
are unique to service-for-prestige, but in order to demonstrate
that service-for-prestige is consistent with a broad range of well-
supported observations about leader–follower relations. These are
observations that any useful theory of leader–follower relations
should explain, even if other theories can explain them as well. In
order to judge the added value of service-for-prestige, however, we
must focus on whether it makes any novel predictions.
Because of its evolutionary foundations, service-for-prestige
makes some predictions that are not shared by most non-
evolutionary theories. These include predictions related to mis-
match theory, such as that followers will judge leaders based on
characteristics that are more relevant to small-scale societies than
to moder n organizations (e.g., physical formidability). However,
most of these mismatch-related predictions are also made by the
evolutionary leadership theory presented by Van Vugt and Ahuja
(2010). What truly distinguishes service-for-prestige is not its
evolutionary foundations per se, but rather its assumption that
leader–follower relations evolved via a reciprocal interaction that
entailed collective action problems for followers. Thus, the most
important novel predictions made by service-for-prestige are those
which emanate directly from this assumption, specifically, predic-
tions seven and eight above: disrespectful followers of beneficial
leaders will attract social penalties from other followers, whereas
disrespectful followers of non-beneficial leaders will attract social
rewards from other followers. As far as we are aware, no other
theor y of leader–follower relations makes not only predictions 1
through 6 above, but also predictions 7 and 8.
COMPARING SERVICE-FOR-PRESTIGE TO OTHER EVOLUTIONARY
THEORIES FOR WHY IT PAYS TO LEAD
Predictions 7 and 8 distinguish service-for-prestige not just from
the evolutionary leadership theory mentioned above (Van Vugt
and Ahuja, 2010), but also from two other notable evolutionary
theories of leadership. Both of these theories address the issue of
why, given the costs that leaders must incur in order to generate
public goods for followers, it would be adaptive for leaders to lead.
The first of these theories is costly signaling theory, which pro-
poses that acts of providing public goods to one’s group can serve
as a valuable opportunity to advertise one’s desirable qualities
to potential allies, cooperative partners, and mates (Gintis et al.,
2001; Hawkes and Bliege Bird, 2002). For example, the opportu-
nity to lead a hunt might afford one an opportunity to show off
attractive traits such as hunting skill, health, and formidability.
This advertising could lead to fitness-enhancing social and mat-
ing opportunities that would compensate the leader for leadership
costs. Although costly signaling offers a plausible explanation for
some aspects of leadership, it is distinguishable from service-for-
prestige because it does not predict that followers face the collective
action problemof generating prestige. Instead,it presumes that the
increased social affiliation that a follower offers a leader represents
a private good for both leader and follower. This focus on private
goods is why costly signaling theor y does not make predictions 7
or8above(Price, 2003).
The second evolutionary theory of leader compensation could
be called the “asymmetric interest” model. From this perspec-
tive, leaders of collective actions are compensated by virtue of
the fact that they have a greater interest in the success of the
collective action than do most followers. Their interest may be
greater, for example, because compared to followers they stand to
acquire a larger share of the resource produced, or because this
resource is inherently more valuable to them (Tooby and Cos-
mides, 1988; Ruttan and Borgerhoff Mulder, 1999; Hooper et al.,
2010). Before examining how this theor y is distinguishable from
service-for-prestige, it is important to note that some versions of
it could in fact be identical to service-for-prestige in everything
but name. This would be the case if the leader’s increased inter-
est in the collective action were the result of collectively allocated
prestige from followers, for example, if this prestige led follow-
ers to jointly and voluntarily grant the leader a relatively large
share of the spoils. If the leader’s increased interest in the collec-
tive action were not the result of such prestige, however, then this
theory would make different predictions than service-for-prestige.
Because it would predict that the leader was leading the collective
action out of a private interest in collective success, it would not
predict that the leader would require any additional compensa-
tion from followers (e.g., prestige), nor that followers would face
a collective action problem in generating this prestige. Therefore
this theory would not even make the prediction that leaders will
acquire more prestige than followers, let alone predictions 7 and 8
above.
COMPARING SERVICE-FOR-PRESTIGE TO EXISTING
NON-EVOLUTIONARY LEADERSHIP THEORIES
Service-for-prestige has some important aspects in common with
previous exchange theories of leadership that are not explicitly
Frontiers in Human Neuroscience www.frontiersin.org June 2014
|
Volume 8
|
Article 363
|
135

Price and Van Vugt The evolution of leader–follower reciprocity
grounded in evolutionary theory (Price and Van Vugt, in press).
One of these is leader–member exchange theory (LMX; Graen and
Uhl-Bien, 1995), which suggests that leadership quality depends
heavily on the quality of social relationships between a leader and
individual followers. Transactional theories of leadership are also
exchange theories; the exchange process that is usually empha-
sized in these theories is one in which leaders use punishments
and rewards to motivate followers to achieve group goals (Bass,
1991). Interestingly, however, Hollander (1992) suggests that this
transaction may take the form of leaders providing benefits to
followers in exchange for esteem. Also relevant is servant leader-
ship theory (Greenleaf, 2002; Gillet et al., 2011), which emphasizes
that the influence of good leaders stems from their compassion,
altruism, mor al authority, and ability to benefit followers.
Despite some clear points of similarity with these theories,
service-for-prestige possesses several unique attributes (Price and
Van Vugt, in press). Unlike servant leadership, service-for-prestige
sees the “altruism” of good leaders as something that not only
benefits followers, but also ultimately profits leaders (because
leaders exchange this altruism for prestige). Unlike LMX, service-
for-prestige focuses on relationship quality not in general but
specifically in terms on how evolution designed both leaders and
followers to achieve an efficient exchange of fitness-relevant ben-
efits. Further, service-for-prestige examines relationships between
leaders and groups of followers, whereas LMX focuses on dyadic
leader–follower relationships. Only service-for-prestige, therefore,
predicts that followers face a collective action problem in gen-
erating leader prestige. And unlike either servant leadership or
LMX, service-for-prestige attempts to explain not only how lead-
ership can most benefit followers, but also how it can most harm
them.
Finally, service-for-prestige can potentially explain not only
the transactional, material rewards and punishments provided
by leaders to followers, but also the “symbolic” benefits of lead-
ership such as enhanced cohesion and identity; such relatively
abstract benefits may plausibly have contributed to the fitness of
individual group members in the past, if they improved the group’s
solidarity and hence ability to compete for resources with other
groups. In other words, symbolic benefits mayrepresentproximate
mechanisms that over evolutionary time have enabled leaders and
followers to achieve more ultimate (fitness-related) goals. In this
respect, service-for-prestige has as much in common with trans-
formational leadership models of leadership (Bass, 1991, 1998)as
with transactional or social identity models of leadership (Price
and Van Vugt, in press).
SERVICE-FOR-PRESTIGE AND SOCIAL NEUROSCIENCE
Service-for-prestige proposes that voluntary leader–follower rela-
tions involve many of the same behaviors that are involved in coop-
erative interactions more generally, such as reciprocal exchange,
collective action, and punishment of non-cooperators. A grow ing
body of social neuroscience research focuses on these behaviors,
especially exchange and punishment (Rilling and Sanfey, 2011).
Most of this research has examined cooperation in dyadic con-
texts and relatively little has focused on group behaviors, which to
some extent limits the direct applicability of this research to the
group contexts of leadership. However, the science is developing
rapidly, and interest is now turning to the neuroscience of group
cooperationaswell(Zak and Barraza, 2013).
As social neuroscience is uniquely poised to reveal the spe-
cific neural systems that are involved in cooperative behaviors, it
may ultimately provide the best methods for testing some of the
most fundamental claims of service-for-prestige. One such claim
is that voluntary leader–follower exchange evolved as an elabo-
rated form of dyadic cooperation, which allowed for reciprocity
to occur between an individual and multiple group members. If
correct, then the same core neural systems involved in dyadic
cooperation are likely also involved in voluntary leader–follower
exchange. If social neuroscience could shed light on the validity of
this assumption, it would contribute to the resolution of a debate
among evolutionary researchers, some of whom claim that coop-
eration between an individual and multiple group members is
likely to involve direct reciprocity (Price, 2003, 2006a; Tooby et al.,
2006) and some of whom claim such cooperation couldevolve only
via completely different processes such as cultural group selection
(Boyd and Richerson, 1988; Henrich, 2004; Bowles and Gintis,
2011).
If service-for-prestige is correct to expect that neural systems
that evolved to enable dyadic reciprocity are also fundamental to
leader–follower exchange, then there already exists a fairly large
body of social neuroscience research that is relevant to service-
for-prestige. There has been quite a bit of neuroscience-related
research on behavior in the ultimatum game, for example, and
this game can be interpreted as a simple form of leader–follower
exchange. The ultimatum game is a two-player economics experi-
ment involving a proposer and a responder. The proposer is given
a sum of funds and decides how much to offer to the responder.
If the responder accepts the offer, then the deal goes through. For
example, if the proposer offers 40% of $10 to the responder and
the responder accepts, then the proposer keeps $6 and the respon-
der takes home $4. If the responder rejects the offer, however, then
both players get nothing. The “rational” decision for responders
is to accept any offer greater than 0, even if it is very low, because
if they reject they will always get 0. By the same token, the ratio-
nal decision for proposers would be to offer the lowest possible
amount above 0. However, research shows that responders tend
to reject offers that are too far below 50%, and that proposers’
offers tend to be close to 50% (Bowles and Gintis, 2011). The pro-
poser can be seen as the leader, and the proposer characteristics
that cause cooperation to fail in the game – that is, selfishness
and unfairness – are those that followers associate, as noted above,
with dominant and “bad” leadership (Den Hartog et al., 1999).
A rejected offer in the ultimatum game, therefore, is essentially
similar to a case of failed leadership.
Most studies on the neural and hormonal correlates of behavior
in the ultimatum game are concerned with responder behavior,
but a few focus on proposers. For instance, one study shows
that patients with damage to the ventromedial prefrontal cor-
tex (VMPFC), a condition associated with impaired concern for
other people, made more selfish proposals. Compared with a con-
trol group these patients offered significantly less and seemed
less motivated by the emotion of guilt (Krajbich et al., 2009).
These results suggest that such individuals would be less likely to
emerge as successful leaders in the context of service-for-prestige
Frontiers in Human Neuroscience www.frontiersin.org June 2014
|
Volume 8
|
Article 363
|
136

Price and Van Vugt The evolution of leader–follower reciprocity
exchanges. Other research found that men who received a small
dose of testosterone, a hormone associated with aggression and
status competition, made more unfair offers compared to men
whoreceivedaplacebo(Zak et al., 2009; cf. Burnham, 2007,
who found no significant relationship between circulating testos-
terone levels and ultimatum game offers in men). Considering
that unfair offers are more likely to be rejected, this result suggests
that some neurological effects of testosterone in men may reduce
effectiveness as a service-for-prestige leader (however, other effects
of testosterone, such as those increasing physical formidability,
may increase perceived suitability for leadership). A recent study
among a sample of managers shows that baseline testosterone
levels correlate positively with a more dominant leadership style,
and negatively with a laissez-faire leadership style (Van der Meij
et al., unpublished data).
Other studies have been conducted to examine the neural cor-
relates of responder behaviors in the ultimatum game, which can
be conceived of as a measure of followership. Data on patients with
brain damage, especially in the VMPFC, show that they are more
likely than healthy participants to reject offers that are deemed
unfair (Koenigs and Tranel, 2007). This brain area is thought to be
important for emotion regulation. Other studies have suggested
that people with higher levels of serotonin – which has been linked
to aggression, hostility and impulsivity – are less likely to accept
unfair offers from proposers (Crockett et al., 2008; Emanuele et al.,
2008). Higher levels of circulating testosterone have also been
linked to increased rejection of unfair offers (Burnham, 2007).
Taken together, these studies on VMPFC damage, serotonin and
testosterone support the view that rejection of unfairness is related
to impulsivity and negative emotion, and that individuals who are
less able to regulate negative emotion will be less likely to emerge
as followers in unequal leader–follower relationships. On the other
hand, better ability to regulate negative emotion might make one
more likely to accept unequal (e.g., highly dominant) leadership.
An fMRI study by Kirk et al. (2011) compared ultimatum game
behavior in people who regularly perform Buddhist meditation
(entailing training in the regulation of negative emotion) and a
control group. Meditators accepted unfair offers more often than
controls, and displayed reduced activ ity in the anterior insula, an
area associated with the emotion of disgust.
Studies have also begun to indicate the general brain regions
involved with the punishment of non-cooperators in dyadic trust
game contexts (de Quervain et al., 2004; Singer et al., 2006). With
increased methodological precision, and as studies broaden their
focus to include punishment of free riders in collective actions,
we will become increasingly able to answer punishment-related
questions raised by service-for-prestige, such as: when a follower
who respects a leader perceives another follower to be disrespecting
that leader, does he or she experience punitive sentiment that
is similar (in terms of the neural systems involved) to the anti-
free-rider punitive sentiment experienced by high-contributing
members of other kinds of collective actions (Fehr and Gächter,
2002; Price et al., 2002)? Such results will shed additional light
on debates between evolutionary researchers, mentioned above,
about the extent to which leader–follower relations were designed
by the same evolutionary processes that enable reciprocity and
collective action in other cooperative contexts, as opposed to being
designed by qualitatively different processes such as cultural group
selection.
CONCLUSION
Service-for-prestige does not claim that either kind of leader–
follower relationship descr ibed above – prestige-based reciprocity
or dominance-based coercion – is more “natural” than the other;
people are adapted for both kinds of interaction. However, reci-
procity clearly involves the greater degree of mutual benefit. Unlike
coercion, reciprocity allows followers to act on their leader pref-
erences, and collectively award prestige to people who, via their
ability to benefit followers, they deem worthy of leadership roles.
Reciprocit y is also more closely associated with what most would
consider “good” leadership (Den Hartog et al., 1999), that is, lead-
ership that most helps followers to achieve their shared goals, as
opposed to primarily serving the narrow interests of the leader
(Price and Van Vugt, in press).
There is also much that service-for-prestige does not explain
about the evolution of leadership. Most importantly, as noted
above, it does not explain why leadership has evolved in so many
non-human species, nor why it first appeared in the human
lineage. Leadership has evolved in many species to solve prob-
lems related to information-sharing and coordination problems
(King et al., 2009), and these were probably its initial func-
tions among human ancestors as well (Van Vugt and Kurzban,
2007; Van Vugt et al., 2008a). However, we suggest that humans,
much more than any other species, have been able to use reci-
procity to enhance the benefits of leadership, by providing leaders
with prestige i n exchange for services that would otherwise have
been too costly for leaders to provide. Our theory applies to
humans much more than any other species, because humans
are uniquely well-adapted for sophisticated cooperative behaviors
such as collective action and various forms of reciprocity (To o by
and Cosmides, 1996; Hammerstein, 2002; Tooby et al., 2006;
Bowles and Gintis, 2011).
By considering the kinds of problems that evolution had to
solve in order to enable leaders and followers to interact adaptively
in human ancestral environments, service-for-prestige is able to
make novel predictions about leader and follower behaviors in
modern environments. Service-for-prestige also promotes a syn-
thesis of the theoretical frameworks of positive reciprocity and
collective action. Although each of these frameworks has had an
enormous independent influence in behavioral science, they are
thought of by many evolutionary researchers as distinct and non-
overlapping (Boyd and Richerson, 1988; Henrich, 2004; Bowles
and Gintis, 2011). We suggest, as others have previously (Price,
2003, 2006a; Tooby et al., 2006), that reciprocity and collective
action are not as distinct as these researchers suggest, and that
syntheses of these theories will enable more predictive evolution-
ar y theories of complex human cooperation. Social neuroscience
is in a unique position to help resolve debates about the extent
to which these theories can in fact be integrated. If service-for-
prestige is correct, then many of the same neural systems involved
in cooperative behaviors such as reciprocity, collective action, and
free rider punishment should be similarly involved when these
processes occur in the specific context of leader–follower relations.
Neuroscientific methods are already proving useful in identifying
Frontiers in Human Neuroscience www.frontiersin.org June 2014
|
Volume 8
|
Article 363
|
137

Price and Van Vugt The evolution of leader–follower reciprocity
and illuminating the nature of these systems, and as they become
increasingly precise, they will become increasingly essential for
answering fundamental questions about how humans are adapted
for leadership, followership, and indeed all forms of social behav-
ior. More frequent occasions for interaction between evolutionary
social psychologists and social neuroscientists, such as that pro-
vided by this special issue, will enable us to take full advantage of
these new research opportunities.
ACKNOWLEDGMENTS
This article was greatly improved by the contributions of the two
reviewers.
REFERENCES
Alexander, R. A. (1979). D arw inism and Human Affairs. Seattle: University of
Washington Press.
Anderson, C., John, O. P., Keltner, D., and Kring, A. M. (2001). Who attains social
status? Effects of personality and physical attractiveness in social groups. J. Pers.
Soc. Psychol. 81, 116–132. doi: 10.1037/0022-3514.81.1.116
Anderson, C., and Kilduff, G. J. (2009). Why do dominant personalities attain influ-
ence in face-to-face groups? The competence-signaling effects of trait dominance.
J. Pers. Soc. Psychol. 96, 491–503. doi: 10.1037/a0014201
Babiak, P., Neumann, C. S., and Hare, R. D. (2010). Corporate psychopathy: talking
the walk. Behav. Sci. Law 28, 174–193. doi: 10.1002/bsl.925
Barclay, P. (2004). Trustworthiness and competitive altruism can also solve
the ‘tragedy of the commons.’ Evol. Hum. Behav. 25, 209–220. doi:
10.1016/j.evolhumbehav.2004.04.002
Barclay, P. (2006). Reputationalbenefits for altruistic punishment. Evol. Hum. Behav.
27, 325–344. doi: 10.1016/j.evolhumbehav.2006.01.003
Barclay, P., and Willer, R. (2007). Partner choice creates competitive altruism in
humans. Proc. R. Soc. Lond. B Biol. Sci. 274, 749–753. doi: 10.1098/rspb.2006.0209
Barkow, J. H. (1992). “Beneath new culture is old psychology: gossip and social
stratification,” in The Adapted Mind: Evolutionary Psychology and the Generation
of Culture, eds J. H. Barkow, L. Cosmides, and J. Tooby (New York: Oxford
University Press), 627–638.
Bass, B. M. (1991). From transactional to transformational leadership: learning to
share the vision. Organ. Dyn. 18, 19–31. doi: 10.1016/0090-2616(90)90061-S
Bass, B. M. (1998). Transfor mational Leadership: Industrial, Military, and Educa-
tional Impact. Mahwah, NJ: Lawrence Erlbaum.
Bauer, M., Cassar, A., Chytilová, J., and Henrich, J. (2014). War’s enduring effects
on the development of egalitarian motivations and in-group biases. Psychol. Sci.
25, 47–57. doi: 10.1177/0956797613493444
Baumard, N., André, J. B., and Sperber, D. (2013). A mutualistic approach to
morality: the evolution of fairness by partner choice. Behav. Brain Sci. 36, 59–78.
doi: 10.1017/S0140525X11002202
Betzig, L. L. (1986). Despotism and Differential Reproduction. New York: Aldine.
Bird, D. W., and Bliege Bird, R. (2010). “Competing to be leaderless: food sharing
and magnanimity among Martu Aborigines,” in The Evolution of Leadership:
Transitions in Decision Making from Small-Scale to Middle-Range Societies,eds
J. Kanter, K. Vahn, and J. Earkins (Santa Fe: SAR Press), 21–49.
Blaker, N. M., Rompa, I., Dessing, I. H., Vriend, A. F., Herschberg, C., and
van Vugt, M. (2013). The height leadership advantage in men and women:
testing evolutionary psychology predictions about the perceptions of tall lead-
ers. Group Process. Intergroup Relat. 16, 17–27. doi: 10.1177/1368430212
437211
Boehm, C. (1999). Hierarchy in the Forest: Egalitarianism and the Evolution of Human
Altruism. Cambridge: Harvard University Press.
Bowles, S., and Gintis, H. (2011). A Cooperative Species: Human Reciprocity and its
Evolution. Princeton: Princeton University Press.
Bowser, B., and Patton, J. Q. (2010). “Women’s leadership strategies in the Ecuado-
rian Amazon,” in The Emergence of Leadership: Transitions in Decision making from
Small-Scale to Middle-Range Societies, eds J. Kantner, K. Vaughn, and J. Eerkens
(Santa Fe: School of American Research), 51–71.
Boyd, R., Gintis, H., and Bowles, S. (2010). Coordinated punishment of defectors
sustains cooperation and can proliferate when rare. Science 328, 617–620. doi:
10.1126/science.1183665
Boyd, R., Gintis, H., Bowles, S., and Richerson, P. J. (2003). The evolution
of altruistic punishment. Proc. Natl. Acad. Sci. U.S.A. 100, 3531–3535. doi:
10.1073/pnas.0630443100
Boyd, R., and Richerson, P. J. (1988). The evolution of reciprocity in sizable groups.
J. Theor. Biol. 132, 337–356. doi: 10.1016/S0022-5193(88)80219-4
Boyd, R., and Richerson, P. J. (1992). Punishment allows the evolution of coop-
eration (or anything else) in sizable groups. Ethol. Sociobiol. 13, 171–195. doi:
10.1016/0162-3095(92)90032-Y
Brown, D. E. (1991). Human Universals
. New York: McGraw-Hill.
B
ur
nham, T. C. (2007). High-testosterone men reject low ultimatum game offers.
Proc. R. Soc. Lond. B Biol. Sci. 274, 2327–2330. doi: 10.1098/rspb.2007.0546
Carlson, D., Kacmar, M., and Whitten, D. (2006). What men think about executive
women. Harv. Bus. Rev. 84, 28–29.
Carneiro, R. L. (2000). The transition from quantity to quality: a neglected causal
mechanism in accounting for social evolution. Proc. Natl. Acad. Sci. U.S.A. 97,
12926–12931. doi: 10.1073/pnas.240462397
Chagnon, N. A. (1979). “Is reproductive success equal in egalitarian societies?,”
in Evolutionary Biology and Human Social Behavior: An Anthropological Perspec-
tive, eds N. A. Chagnon and W. Irons (North Scituate, MA: Duxbury Press),
374–401.
Chagnon, N. A. (1988). Life histories, blood revenge, and warfare in a tribal
population. Science 239, 985–992. doi: 10.1126/science.239.4843.985
Chagnon, N. A. (1997). Yanomamö. Fort Worth: Harcourt Brace.
Cheng, J. T., Tracy, J. L., Foulsham, T., Kingstone, A., and Henrich, J. (2012). Two
ways to the top: evidence that dominance and prestige are distinct yet viable
avenues to social rank and influence. J. Pers. Soc. Psychol. 104, 103–105. doi:
10.1037/a0030398
Crockett, M. J., Clark, L., Tabibnia, G., Lieberman, M. D., and Robbins, T. W. (2008).
Serotonin modulates behavioral reactions to unfairness. Science 320, 1739–1739.
doi: 10.1126/science.1155577
Darwin, C. (1871). The Descent of Man, and Selection in Relation to Sex.London:
John Murray. doi: 10.1037/12293-000
Den Hartog, D. N., House, R. J., Hanges, P. J., Ruiz-Quintanilla, S. A., and Dorf-
man, P. W. (1999). Culture specific and cross-culturally generalizable implicit
leadership theories: are attr ibutes of charismatic/transformational leadership
universally endorsed? Leadersh. Q. 10, 219–256. doi: 10.1016/S1048-9843(99)
00018-1
de Quervain, D. J., Fischbacher, U., Treyer, V., Schellhammer, M., Schnyder, U.,
Bunk, A., et al. (2004). The neural basis of altruistic punishment. Science 305,
1254–1258. doi: 10.1126/science.1100735
Ellis, B. J. (1992). “The evolution of sexual attraction: evaluative mechanisms in
women,” in The Adapted Mind: Evolutionary Psychology and the Generation of
Culture, eds J. H. Barkow, L. Cosmides, and J. Tooby (NewYork: Oxford University
Press), 267–288.
Elsesser, K. M., and Lever, J. (2011). Does gender bias against female leaders persist?
Quantitative and qualitative data from a large-scale survey. Hum. Relat. 64, 1555–
1578. doi: 10.1177/0018726711424323
Emanuele, E., Brondino, N., Bertona, M., Re, S., and Geroldi, D. (2008). Rela-
tionship between platelet serotonin content and rejections of unfair offers in
the ultimatum game. Neurosci. Lett. 437, 158–161. doi: 10.1016/j.neulet.2008.
04.006
Emerson, R. M. (1962). Power-dependence relations. Am. Sociol. Rev. 27, 31–41.
Falk, A., Fehr, E., and Fischbacher, U. (2005). Driving forces behind informal
sanctions. Econometrica 73, 2017–2030. doi: 10.1111/j.1468-0262.2005.00644.x
Fehr, E., and Gächter, S. (2002). Altruistic punishment in humans. Nature 415,
137–140. doi: 10.1038/415137a
Flynn, F. J. (2003). How much should I give and how often? The effects of generosity
and frequency of favor exchange on social status and productivity. Acad. Manage.
J. 46, 539–553. doi: 10.2307/30040648
Fried, M. H. (1967). The Evolution of Political Society. New York: Random House.
Gawley, T., Perks, T., and Curtis, J. (2009). Height, gender, and authority status at
work: analyses for a national sample of Canadian workers. Sex Roles 60, 208–222.
doi: 10.1007/s11199-008-9520-5
Gillet, J., Cartwright, E., and Van Vugt, M. (2011). Selfish or servant
leadership? Evolutionary predictions on leadership personalities in coordi-
nation games. Pers. Individ. Dif. 51, 231–236. doi: 10.1016/j.paid.2010.
06.003
Gintis, H., Smith, E. A., and Bowles, S. (2001). Cooperation and costly signaling.
J. Theor. Biol. 213, 103–119. doi: 10.1006/jtbi.2001.2406
Frontiers in Human Neuroscience www.frontiersin.org June 2014
|
Volume 8
|
Article 363
|
138

Price and Van Vugt The evolution of leader–follower reciprocity
Gneezy, A., and Fessler, D. M. (2012). Conflict, sticks and carrots: war increases
prosocial punishments and rewards. Proc. R. Soc. B Biol. Sci. 279, 219–223. doi:
10.1098/rspb.2011.0805
Gouldner, A. W. (1960). The norm of reciprocity: a preliminary statement.
Am. Sociol. Rev. 25, 161–178. doi: 10.2307/2092623
Graen, G. B., and Uhl-Bien, M. (1995). Relationship-based approach to lead-
ership: development of LMX theory of leadership over 25 years: apply-
ing a multi-level, multi-domain perspective. Leadersh. Q. 6, 219–247. doi:
10.1016/1048-9843(95)90036-5
Grammer, K., Fink, B., Møller, A. P., and Thornhill, R. (2003). Darwinian aes-
thetics: sexual selection and the biology of beauty. Biol. Rev. 78, 385–407. doi:
10.1017/S1464793102006085
Greenleaf, R. K. (2002). Ser vant Leadership: A Journey into the Nature of Legitimate
Power and Greatness (25th anniversary edition). New York: Paulist Press.
Gronn, P. (2002). Distributed leadership as unit of analysis. Leadersh. Q. 13, 423–
451. doi: 10.1016/S1048-9843(02)00120-0
Guala, F. (2012). Reciprocity: weak or strong? What punishment experi-
ments do (and do not) demonstrate. Behav. Brain Sci. 35, 1–15. doi:
10.1017/S0140525X11000069
Gurven, M., Allen-Arave, W., Hill, K., and Hurtado, M. (2000). “It’s a wonderful
life”: signaling generosity among the Ache of Paraguay. Evol. Hum. Behav. 21,
263–282. doi: 10.1016/S1090-5138(00)00032-5
Hamilton, W. D. (1964). The genetical evolution of social behavior, I–II. J. Theor.
Biol. 7, 1–52. doi: 10.1016/0022-5193(64)90038-4
Hamilton, W. D. (1971). Geometry for the selfish herd. J. Theor. Biol. 31, 295–311.
doi: 10.1016/0022-5193(71)90189-5
Hammerstein, P. (2002). “Why is reciprocity so rare in social animals? A protestant
appeal,” in Genet ic and Cultural Evolution of Cooperation, ed. P. Hammerstein
(Berlin: Dahlem University Press), 83–93.
Hardy, C., and Van Vugt, M. (2006). Nice guys finish first: the compet-
itive altruism hypothesis. Pers. Soc. Psychol. Bull. 32, 1402–1413. doi:
10.1177/0146167206291006
Hart, C. W. M., and Pilling, A. R. (1960). The Tiwi of North Australia.NewYork:
Holt.
Hawkes, K. (1993). Why hunter-gatherers work: an ancient version of the problem
of public goods. Curr. Anthropol. 34, 341–361. doi: 10.1086/204182
Hawkes, K., and Bliege Bird, R. (2002). Showing off, handicap signaling, and the
evolution of men’s work. Evol. Anthropol. 11, 58–67. doi: 10.1002/e van.20005
Henrich, J. (2004). Cultural group selection, coevolutionary processes and
large-scale cooperation. J. Econ. B ehav. Organ. 53, 3–35. doi: 10.1016/S0167-
2681(03)00094-5
Henrich, J., and Gil-White, F. J. (2001). The evolution of prestige: freely conferred
status as a mechanism for enhancing the benefits of cultural transmission. Evol.
Hum. Behav. 22, 165–196. doi: 10.1016/S1090-5138(00)00071-4
Hirschman, A. O. (1970). Exit, Voice, and Loyalty: Responses to Decline in Firms,
Organizations, and States. Cambridge, MA: Harvard University Press.
Hogan, R., and Kaiser, R. B. (2005). What we know about leadership. Rev. Gen.
Psychol. 9, 169–180. doi: 10.1037/1089-2680.9.2.169
Hogg, M. A. (2001). A social identity theory of leadership. Pers. Soc. Psychol. Rev. 5,
184–200. doi: 10.1207/S15327957PSPR0503_1
Holbrook, C., and Fessler, D. M. (2013). Sizing up the threat: the envisioned physical
formidability of terrorists tracks their leaders’ failures and successes. Cognition
127, 46–56. doi: 10.1016/j.cognition.2012.12.002
Hollander, E. P. (1992). The essential interdependence of leadership and follower-
ship. Curr.Dir.Psychol.Sci.1, 71–75. doi: 10.1111/1467-8721.ep11509752
Hooper, P. L., Kaplan, H. S., and Boone, J. L. (2010). A theory of leadership in human
cooperative groups. J. Theor. Biol. 265, 633–646. doi: 10.1016/j.jtbi.2010.05.034
Johnson, A. W., and Earle, T. (1987).
The Evolution of Human Societies.
Stanford:
Stanfor
d University Press.
Judge, T. A., and Cable, D. M. (2004). The effect of physical height on workplace suc-
cess and income. J. Appl. Psychol. 89, 428–441. doi: 10.1037/0021-9010.89.3.428
Judge, T. A., Colbert, A. E., and Ilies, R. (2004). Intelligence and leadership: a
quantitative review and test of theoretical propositions. J. Appl. Psychol. 89, 542–
552. doi: 10.1037/0021-9010.89.3.542
Keeley, L. H. (1996). War Before Civilization: The Myth of the Peaceful Savage. Oxford:
Oxford University Press.
Kelly, R. L. (1995). The Foraging Spectrum: Diversity in Hunter-Gatherer Lifeways.
Washington, DC: Smithsonian. doi: 10.1525/ae.1998.25.1.36
King, A., Johnson, D. D. P., and Van Vugt, M. (2009). The origins and evolution of
leadership. Curr. Biol. 19, R911–R916. doi: 10.1016/j.cub.2009.07.027
Kirk, U., Downar, J., and Montague, P. R. (2011). Interoception drives increased
rational decision-making in meditators playing the ultimatum game. Front.
Neurosci. 5:49. doi: 10.3389/fnins.2011.00049
Kleinfeld, N. R. (2014, January 12). A Bridge to Scandal: Behind the Fort Lee Ruse.
The New York Times. Available at: www.nytimes.com (accessed on February 19,
2014).
Koenigs, M., and Tranel, D. (2007). Irrational economic decision-making after
ventromedialprefrontaldamage: evidence from the Ultimatum Game. J. Neurosci.
27, 951–956. doi: 10.1523/JNEUROSCI.4606-06.2007
Krajbich, I., Adolphs, R., Tranel, D., Denburg, N. L., and Camerer, C. F. (2009).
Economic games quantify diminished sense of guilt in patients with damage to
the prefrontal cortex. J. Neurosci. 29, 2188–2192. doi: 10.1523/JNEUROSCI.5086-
08.2009
Kramer, R. S., Arend, I., and Ward, R. (2010). Perceived health from biolog-
ical motion predicts voting behaviour. Q. J. Exp. Psychol. 63, 625–632. doi:
10.1080/17470210903490977
Krause, J., and Ruxton, G. (2002). Living in Groups. Oxford: Oxford University
Press.
Kunovich, S., and Slomczynski, K. M. (2007). Systems of distribution and a sense of
equity: a multilevel analysis of meritocratic attitudes in post-industrial societies.
Eur. Sociol. Rev. 23, 649–663. doi: 10.1093/esr/jcm026
Lakatos, I. (1978). The Methodolog y of Scient ific Research Programmes, Vol. 1.
Cambridge: Cambridge University Press. doi: 10.1017/CBO9780511621123
Lee, R. B. (1993). The Dobe Ju/’hoansi. New York: Harcourt Brace.
Levi-Strauss, C. (1967). “The social and psychological aspects of chieftainship in a
primitive tribe: the Nambikuara of northwestern Mato Grosso,” in Comparative
Political Systems: Studies in the Politics of Pre-industrial Societies, eds R. Cohen
and J. Middleton (Garden City, NY: The Natural History Press), 45–62.
Li, N. P. (2007). Mate preference necessities in long-and short-term mating: people
prioritize in themselves what their mates prioritize in them. Acta Psychol. Sin. 39,
528–535.
Liebenberg, L. (2006). Persistence hunting by modern hunter-gatherers. Curr.
Anthropol. 47, 1017–1026. doi: 10.1086/508695
Little, A. C., Burris, R. P., Jones, B. C., and Roberts, S. C. (2006). Facial
appearance affects voting decisions. Evol. Hum. Behav. 28, 18–27. doi:
10.1016/j.evolhumbehav.2006.09.002
Locke, J. (1689). Two Treatises of Government. London: Awnsham Churchill.
Low, B. S. (1992). Sex, coalitions, and politics in preindustrial societies. Politics Life
Sci. 11, 63–80.
Lukaszewski, A. W. (2013). Testing an adaptationist theory of trait covariation:
relative bargaining power as a common calibrator of an interpersonal syndrome.
Eur. J. Pers. 27, 328–345. doi: 10.1002/per.1908
Marlowe, F. (2011). The Hadza: Hunter-Gatherer People of Tanzania.Berkeley:
University of California Press.
Mathew, S., and Boyd, R. (2014). The cost of cowardice: punitive sentiments
towards free riders in Turkana raids. Evol. Hum. Behav. 35, 58–64. doi:
10.1016/j.evolhumbehav.2013.10.001
Matthiessen, P. (1962). U
nder the
Mountain Wall. New York: Ballantine Books.
Mathieu, C., Neumann, C. S., Hare, R. D., and Babiak, P. (2014). A dark side
of leadership: corporate psychopathy and its influence on employee well-being
and job satisfaction. Pers. Indiv id. Differ. 59, 83–88. doi: 10.1016/j.paid.2013.
11.010
Mazur, A., and Mueller, U. (1996). “Facial dominance,” in Research in Biopolitics,
Vol. 4, eds A. Somit and S. Peterson (London: JAI Press), 99–111.
McAndrew, F. T., and Perilloux, C. (2012). Is self-sacrificial competitive altruism
primarily a male activity? Evol. Psychol. 10, 50.
McDonald, M. M., Navarrete, C. D., and Van Vugt, M. (2012). Evolution and the
psychology of intergroup conflict: the male warrior hypothesis. Philos. Trans. R.
Soc. Lond. B Biol. Sci. 367, 670–679. doi: 10.1098/rstb.2011.0301
Meggitt, M. J. (1977). Blood is Their Argument. Palo Alto: Mayfield.
Mill, J. S. (1861). Considerations on Representative Government. London: Parker,
Son, and Bourn.
Mishel, L., and Sabadish, N. (2013). CEO Pay in 2012 was Extraordinarily Hig h
Relative to Typical Workers and Other High Earners. Issue Brief #367. Washington,
DC: Economic Policy Institute.
Nesse, R. M., and Williams, G. C. (1994). Why We Get Sick. New York: Times Books.
Frontiers in Human Neuroscience www.frontiersin.org June 2014
|
Volume 8
|
Article 363
|
139

Price and Van Vugt The evolution of leader–follower reciprocity
Nowak, M. A., and Sig mund, K. (2005). Evolution of indirect reciprocity. Nature
437, 1291–1298. doi: 10.1038/nature04131
O’Gorman, R., Henrich, J., and Van Vugt, M. (2009). Constraining free riding
in public goods games: designated solitary punishers can sustain human coop-
eration. Proc. R. Soc. Lond. B Biol. Sci. 276, 323–329. doi: 10.1098/rspb.2008.
1082
Olson, M. (1965). The Logic of Collective Action: Public Goods and the Theory of
Groups. Cambridge, MA: Harvard University Press.
Ostrom, E. (1990). Governing the Commons: The Evolution of Institu-
tions for Collective Action. New York: Cambridge University Press. doi:
10.1017/CBO9780511807763
Paulhus, D. L., and Williams, K. M. (2002). The Dark Triad of personality: Nar-
cissism, Machiavellianism, and psychopathy. J. Res. Pers. 36, 556–563. doi:
10.1016/S0092-6566(02)00505-6
Petersen, M. B., Sznycer, D., Sell, A., Cosmides, L., and Tooby, J. (2013). The
ancestral logic of politics upper-body strength regulates men’s assertion of
self-interest over economic redistribution. Psychol. Sci. 24, 1098–1103. doi:
10.1177/0956797612466415
Pratto, F., Sidanius, J., and Levin, S. (2006). Social dominance theory and the
dynamics of intergroup relations: taking stock and looking forward. Eur . Rev.
Soc. Psychol. 17, 271–320. doi: 10.1080/10463280601055772
Price, M. E. (2003). Pro-community altr uism and social status in a Shuar village.
Hum. Nat. 14, 191–208. doi: 10.1007/s12110-003-1003-3
Price, M. E. (2005). Punitive sentiment among the Shuar and in industrial-
ized societies: cross-cultural similarities. Evol. Hum. Behav. 26, 279–287. doi:
10.1016/j.evolhumbehav.2004.08.009
Price, M. E. (2006a). Monitoring, reputation and“greenbeard”reciprocity in a Shuar
work team. J. Organ. Behav. 27, 201–219. doi: 10.1002/job.347
Price, M. E. (2006b). Judgments about cooperators and freeriders on a Shuar work
team: an evolutionary psychological perspective. Organ. B ehav. Hum. Decis.
Process. 101, 20–35. doi: 10.1016/j.obhdp.2006.06.001
Price, M. E., Cosmides, L., and Tooby, J. (2002). Punitive sentiment as an anti-free
rider psychological device. Evol. Hum. Behav. 23, 203–231. doi: 10.1016/S1090-
5138(01)00093-9
Price, M. E., Dunn, J., Hopkins, S., and Kang, J. (2012). Anthropomet-
ric correlates of human anger. Evol. Hum. Behav. 33, 174–181. doi:
10.1016/j.evolhumbehav.2011.08.004
Price, M. E., and Johnson, D. D. P. (2011). “The adaptationist theory of coop-
eration in groups: evolutionary predictions for organizational cooperation,” in
Evolutionary Psychology in the Business Sciences, ed. G. Saad (Berlin: Springer),
95–134.
Price, M. E., Kang, J., Dunn, J., and Hopkins, S. (2011). Muscularity and attractive-
ness as predictors of human egalitarianism. Pers. Individ. Differ. 50, 636–640. doi:
10.1016/j.paid.2010.12.009
Price, M. E., and Van Vugt, M. (in press). “The service-for-prestige theory of leader–
follower relations: a review of the evolutionary psychology and anthropology
literatures,” in Biological Foundations of Organizational Behavior, eds R. D. Ar vey
and S. M. Colarelli (Chicago: University of Chicago Press).
Re, D. E., Hunter, D. W., Coetzee, V., Tiddeman, B. P., Xiao, D., DeBru-
ine, L. M., et al. (2013). Looking like a leader–facial shape predicts perceived
height and leadership ability. PLoS ONE 8:e80957. doi: 10.1371/journal.pone.
0080957
Rilling, J. K., and Sanfey, A. G. (2011). The neuroscience of social decision-making.
Annu.Rev.Psychol.62, 23–48. doi: 10.1146/annurev.psych.121208.131647
Ritzman, R. L., and Tomaskovic-Devey, D. (1992). Life chances and support for
equality and equit y as normative and counternormative distribution rules. Soc.
Forces 70, 745–763. doi: 10.1093/sf/70.3.745
Roberts, G. (1998). Competitive altruism: from reciprocity to the handicap princi-
ple. Proc. R. Soc. Lond. B Biol. Sci. 265, 427–431. doi: 10.1098/rspb.1998.0312
Rusbult, C. E., Farrell, D. L., Rogers, O., and Mainous, A. O. III. (1988). The impact
of exchange variables on exit, voice, loyalty, and neglect: an integrative model
of responses to declining job satisfaction. Acad. Manage. J. 31, 599–627. doi:
10.2307/256461
Ruttan, L. M., and Borgerhoff Mulder, M. (1999). Are east African pastoralists truly
conservationists? Curr. Anthropol. 40, 621–652. doi: 10.1086/317387
Sell, A., Tooby, J., and Cosmides, L. (2009). Formidability and the logic
of
h
uman anger. Proc. Natl. Acad. Sci. U.S.A. 106, 15073–15078. doi:
10.1073/pnas.0904312106
Service, E. R. (1966). The Hunters. Englewood Cliffs, NJ: Prentice-Hall.
Shepardson, M. (1963). “The traditional authority system of the Navajos,” in
Comparative Political Systems: Studies in the Politics of Pre-Industrial Soci-
eties, eds R. Cohen and J. Middleton (New York: Natural History Press),
143–154.
Singer, T., Seymour, B., O’Doherty, J. P., Stephan, K. E., Dolan, R. J., and Frith, C.
D. (2006). Empathic neural responses are modulated by the perceived fairness of
others. Nature 439, 466–469. doi: 10.1038/nature04271
Smith, E. A., Hill, K., Marlowe, F. W., Nolin, D., Wiessner, P., Gurven, M.,
et al. (2010). Wealth transmission and inequality among hunter-gatherers. Curr.
Anthropol. 51, 19–34. doi: 10.1086/648530
Spisak, B. R., Dekker, P. H., Krüger, M., and van Vugt, M. (2012a). Warriors
and peacekeepers: testing a biosocial implicit leadership hypothesis of inter-
group relations using masculine and feminine faces. PLoS ONE 7:e30399. doi:
10.1371/journal.pone.0030399
Spisak, B. R., Homan, A. C., Grabo, A., and Van Vugt, M. (2012b). Facing the
situation: testing a biosocial contingency model of leadership in interg roup
relations using masculine and feminine faces. Leadersh. Q. 23, 273–280. doi:
10.1016/j.leaqua.2011.08.006
Sylwester, K., and Roberts, G. (2010). Cooperators benefit through reputation-
based partner choice in economic games. Biol. Lett. 6, 659–662. doi:
10.1098/rsbl.2010.0209
Takezawa, M., and Price, M. E. (2010). Revisiting “The e volution of reciprocity
in sizable groups”: continuous reciprocity in the repeated N-Person prisoner’s
dilemma. J. Theor. Biol. 264, 188–196. doi: 10.1016/j.jtbi.2010.01.028
Tooby, J., and Cosmides, L. (1988). The Evolution of War and its Cognitive Founda-
tions. Technical Report #88-1. Santa Barbara: Institute for Evolutionary Studies,
University of California at Santa Barbara.
Tooby, J., and Cosmides, L. (1990). The past explains the present: emotional adap-
tations and the structure of ancestral env ironments. Ethol. Sociobiol. 11, 375–424.
doi: 10.1016/0162-3095(90)90017-Z
Tooby, J., and Cosmides, L. (1992). “The psychological foundations of culture,” in
The Adapted Mind: Evolutionary Psychology and the Generation of Culture,eds
J. H. Barkow, L. Cosmides, and J. Tooby (New York: Oxford University Press),
19–136.
Tooby, J., and Cosmides, L. (1996). “Friendship and the Banker’s Paradox: other
pathways to the evolution of adaptations for altruism,” in Evolution of Social
Behaviour Patterns in Primates and Man. Proceedings of the British Academy, Vol.
88, eds W. G. Runciman, J. Maynard Smith, and R. I. M. Dunbar (Oxford: Oxford
University Press), 119–143.
Tooby, J., and Cosmides, L. (2005). “Conceptual foundations of evolutionary psy-
chology,” in The Handbook of Evolutionary Psychology, ed. D. M. Buss (Hoboken,
NJ: Wiley), 5–67.
Tooby, J., Cosmides, L., and Price, M. E. (2006). Cognitive adaptations for n-person
exchange: the evolutionary roots of organizational behavior. Manage. Decis. Econ.
27, 103–129. doi: 10.1002/mde.1287
Trivers, R. L. (1971). The evolution of reciprocal altruism. Q. Rev. Biol. 46, 35–57.
doi: 10.1086/406755
Trivers, R. L. (1972). “Parental investment and sexual selection,” in Sexual Selection
and the Descent of Man, 1871–1971, ed. B. Campbell (Chicago: Aldine), 136–179.
Turnbull, C. M. (1968). “The importance of flux in two hunting societies,” in Man
the Hunter, eds R. B. Lee and I. DeVore (New York: Aldine de Gruyter), 132–137.
Van Vugt, M. (2006). Evolutionary origins of leadership and followership. Pers. Soc.
Psychol. Rev. 10, 354–371. doi: 10.1207/s15327957pspr1004_5
Van Vugt, M. (2014). “On faces, gazes, votes, and followers: evolutionary psycholog-
ical and social neuroscience approaches to leadership,” in New Frontiers in Social
Neurosc ience, eds J. Decety and Y. Christen (Heidelberg: Springer), 93–110.
Van Vugt, M., and Ahuja, A. (2010). Selected: Why Some People Lead, Why Others
Follow, and Why it Matters. London: Profile Books.
Van Vugt, M., and De Cremer, D. (1999). Leadership in social dilemmas: social
identification effects on collective actions in public goods. J. Pers. Soc. Psychol. 76,
587–599. doi: 10.1037/0022-3514.76.4.587
Van Vugt, M., De Cremer, D., and Janssen, D. (2007). Gender differences in compe-
tition and cooperation: the male warrior hypothesis. P
sychol.
Sci. 18, 19–23. doi:
10.1111/j.1467-9280.2007.01842.x
Van Vugt, M., Hogan, R., and Kaiser, R. (2008a). Leadership, followership,
and evolution: some lessons from the past. Am. Psychol. 63, 182–196. doi:
10.1037/0003-066X.63.3.182
Frontiers in Human Neuroscience www.frontiersin.org June 2014
|
Volume 8
|
Article 363
|
140

Price and Van Vugt The evolution of leader–follower reciprocity
Van Vugt, M., Johnson, D., Kaiser, R., and O’Gorman, R. (2008b). “Evolution and
the social psychology of leadership: the mismatch hypothesis,” in Leadership at
the Crossroads: Psychology and Leadership, Vol. 1, eds C. L. Hoyt, G. R. Goethals,
and D. R. Forsyth (Westport, CT: Praeger), 262–282.
Van Vugt, M., Jepson, S., Hart, C., and De Cremer, D. (2004). Autocratic leadership
in social dilemmas: a threat to group stability. J. Exp. Soc. Psychol. 40, 1–13. doi:
10.1016/S0022-1031(03)00061-1
Van Vugt, M., and Kurzban, R. K. (2007). “Cognitive and social adaptations for
leadership and followership: evolutionary game theory and group dynamics,” in
Sydney Symposium of Social Psychology, Vol. 9, The Evolution of the Social Mind:
Evolutionary Psychology and Social Cognition, eds J. Forgas, W. von Hippel, and
M. Haselton (London: Psychology Press), 229–244.
Van Vugt, M., and Ronay, R. D. (2014). The evolutionary psychology of lead-
ership: theory, review, and roadmap. Organ. Psychol. Rev. 4, 74–95. doi:
10.1177/2041386613493635
VanVugt, M., and Spisak, B. R. (2008). Sex differencesin the emergenceof leadership
during competitions within and between groups. Psychol. Sci. 19, 854–858. doi:
10.1111/j.1467-9280.2008.02168.x
Von Rueden, C. (2011). The Acquisition of Social Status by Males in Small-scale
Human Societies (with an Emphasis on the Tsimane of Bolivia). Doctoral disser-
tation. Available from ProQuest (UMI No. 3495771). University of California at
Santa Barbara, Santa Barbar a.
Von Rueden, C., Gurven, M., and Kaplan, H. (2008). The multiple dimensions of
male social status in an Amazonian society. Evol. Hum. Behav. 29, 402 –415. doi:
10.1016/j.evolhumbehav.2008.05.001
Von Rueden, C., Gurven, M., and Kaplan, H. (2011). Why do men seek status?
Fitness payoffs to dominance and prestige. Proc. R. Soc. Lond. B Biol. Sci. 278,
2223–2232. doi: 10.1098/rspb.2010.2145
Von Rueden, C., Gurven, M., Kaplan, H., and Stieglitz, J. (in press). Leadership in
an egalitarian society. Hum. Nat.
Wassenaar, C. L., and Pearce, C. L. (2011). “The nature of shared leadership,” in
The Nature of Leadership, eds D. V. Day and J. Antonakis (Los Angeles, CA: Sage),
363–389.
Willer, R. (2009). Groups reward individual sacrifice: the status solu-
tion to the collective action problem. Am. Soc. Rev. 74, 23–43. doi:
10.1177/000312240907400102
Williams, K. (2007). Ostracism. Annu.Rev.Psychol.58, 425–452. doi:
10.1146/annurev.psych.58.110405.085641
Yamagishi, T. (1986). The provision of a sanctioning system as a pub-
lic good. J. Pers. Soc. Psychol. 51, 110–116. doi: 10.1037/0022-3514.
51.1.110
Yanca, C., and Low, B. S. (2004). Female allies and female power: a cross-
cultural analysis. Evol. Hum. Behav. 25, 9–23. doi: 10.1016/S1090-5138(03)
00065-5
Zak, P. J., and Barraza, J. A. (2013). The neurobiology of collective action. Front.
Neurosci. 7:211. doi: 10.3389/fnins.2013.00211
Zak, P. J., Kurzban, R., Ahmadi, S., Swerdloff, R. S., Park, J.,
Efremidze, L., et al. (2009). Testosterone administration decreases generos-
ity in the ultimatum game. PLoS ONE 4:e8330. doi: 10.1371/journal.pone.
0008330
Conflict of Interest Statement: The authors declare that the research was conducted
in the absence of any commercial or financial relationships that could be construed
as a potential conflict of interest.
Received: 19 March 2014; accepted: 13 May 2014; published online: 04 June 2014.
Citation: Price ME and Van Vugt M (2014) The evolution of leader–follower
reciprocity: the theory of service-for-prestige. Front. Hum. Neurosci. 8:363. doi:
10.3389/fnhum.2014.00363
This ar ticle was submitted to the journal Frontiers in Human Neuroscience.
Copyright © 2014 Price and Van Vugt. This is an open-access article distributed under
the terms of the Creative Commons Attribution License (CC BY). The use, distribution
or reproduction in other forums is permitted, provided the original author(s) or licensor
are credited and that the original publication in this journal is cited, in accordance with
accepted academic practice. No us e, distribution or reproduction is permitted which
does not comply with these terms.
Frontiers in Human Neuroscience www.frontiersin.org June 2014
|
Volume 8
|
Article 363
|
141

HUMAN NEUROSCIENCE
REVIEW ARTICLE
published: 28 August 2014
doi: 10.3389/fnhum.2014.00650
Recommendations for sex/gender neuroimaging research:
key principles and implications for research design,
analysis, and interpretation
Gina Rippon
1
*, Rebecca Jordan-Young
2
, Anelis Kaiser
3
and Cordelia Fine
4
1
Aston Brain Centre, School of Life and Health Sciences (Psychology), Aston University, Birmingham, West Midlands, UK
2
Department of Women’s, Gender and Sexuality Studies, Barnard College, Columbia University in the City of New York, New York, NY, USA
3
Department of Social Psychology, Institute of Psychology, University of Bern, Bern, Switzerland
4
Melbourne School of Psychological Sciences, Melbourne Business School, and Centre for Ethical Leadership, University of Melbourne, Carlton, VIC, Australia
Edited by:
Sven Braeutigam, University of
Oxford, UK
Reviewed by:
Sören Krach, Philipps-University
Marburg, Germany
Jennifer Blanche Swettenham,
University of Oxford, UK
Ana Susac, University of Zagreb,
Croatia
*Correspondence:
Gina Rippon, Aston Brain Centre,
School of Life and Health Sciences
(Psychology), Aston University,
Birmingham, West Midlands B4
7ET, UK
e-mail: g.rippon@aston.ac.uk
Neuroimaging (NI) technologies are having increasing impact in the study of complex
cognitive and social processes. In this emerging field of social cognitive neuroscience,
a central goal should be to increase the understanding of the interaction between the
neurobiology of the individual and the environment in which humans develop and function.
The study of sex/gender is often a focus for NI research, and may be motivated by a
desire to better understand general developmental principles, mental health problems that
show female-male disparities, and gendered differences in society. In order to ensure the
maximum possible contribution of NI research to these goals, we draw attention to four key
principles—overlap, mosaicism, contingency and entanglement—that have emerged from
sex/gender research and that should inform NI research design, analysis and interpretation.
We discuss the implications of these principles in the form of constructive guidelines and
suggestions for researchers, editors, reviewers and science communicators.
Keywords: brain imaging, sex differences, sex similarities, gender, stereotypes, essentialism, plasticity
INTRODUCTION
Over the past few decades, psychologists have documented a ten-
dency for lay-people to hold “essentialist” beliefs about social cat-
egories, including gender (for summary, see Haslam and Whelan,
2008). Essentialist thinking about social categories involves two
important dimensions (Rothbart and Taylor, 1992; Haslam et al.,
2000). Essentialized social categories are seen as “natural kinds”,
being natural, fixed, invariant across time and place, and dis-
crete (that is, with a sharply defined category boundary). In
addition, essentialized social categories are “reified”, being seen
as “inductively potent, homogenous, identity-determining, and
grounded in deep, inherent properties” (Haslam and Whelan,
2008, p. 1299).
Gender is a strongly essentialized category, particularly in the
degree to which it is seen as a natural kind (Haslam et al., 2000),
with interpersonal differences spontaneously interpreted through
a gendered lens (Prentice and Miller, 2006). 3G-sex (that is, the
genetic, gonadal, and genital endowment, of an individual (Joel,
2011)) is indeed highly—although not completely—internally
consistent, discrete and invariant across time and place and
thus much more of a “natural kind”. Yet decades of gender
scholarship have undermined the traditional essentialist view of
the behavioral manifestations of masculinity and femininity, and
their neural correlates, which are of interest to neuroscientists
(Schmitz and Höppner, 2014).
The key principles from gender scholarship of overlap,
mosaicism, contingency, and entanglement, reviewed in the
following sections, offer a serious challenge to essentialist notions
of sex/gender
1
as fixed, invariant, and highly informative. This
is an important message for neuroscientists because, unless they
have specific expertise or knowledge in gender scholarship, they
too are laypeople with respect to gender research, and may also be
susceptible to gender essentialist thinking. Indeed, sex/gender NI
2
research currently often appears to proceed as if a simple essen-
tialist view of the sexes were correct: that is, as if sexes clustered
distinctively and consistently at opposite ends of a single gender
continuum, due to distinctive female vs. male brain circuitry,
largely fixed by a sexually-differentiated genetic blueprint. Data
on the sex of participants are ubiquitously collected and available;
the two sexes may be routinely compared with only positive
findings reported (Maccoby and Jacklin, 1974; Hines, 2004); and
1
As we describe below, neural phenotypes represent the complex entan-
glement of biological and environmental factors, such that it is generally
not possible to entirely isolate the two. Thus, we use the composite term
“sex/gender” as a way to refer to this irreducible complexity (see also Kaiser,
2012).
2
Our focus in this paper is on the use of Magnetic Resonance Imaging MRI
techniques, both structural and functional (fMRI). The majority of studies in
this area, particularly those most commonly cited in the public domain, use
MRI/fMRI techniques. We are aware that techniques with better temporal res-
olution such as electroencephalography (EEG) and magnetoencephalography
(MEG) have been used in this field (and may, indeed, be more appropriate for
the cognitive processes being investigated) but detailed inclusion of these is
beyond the scope of this review. Almost all of the identified implications and
recommendations will also be relevant to EEG and MEG research.
Frontiers in Human Neuroscience www.frontiersin.org August 2014 | Volume 8 | Article 650 |
142

Rippon et al. Issues in functional neuroimaging sex/gender research
the emphasis on difference is institutionalized in databases that
allow only searches for sex/gender differences, not similarities
(Kaiser et al., 2009).
The all but ubiquitous group categorization on the basis of
biological sex seems to suggest the implicit assumption that a
person’s biological sex is a good proxy for gendered behavior
and that therefore categorizing a sample on the basis of sex will
yield distinct “feminine” vs. “masculine” profiles. The small sam-
ple sizes common in fMRI investigations reporting female/male
differences (Fine, 2013a) suggests the implicit assumption that
female vs. male brain functioning is so distinct that true effects
can be identified with small numbers of participants. Conversely,
with large sample sizes (seen mostly in structural comparisons),
the publication of statistically significant effects suggests the
implicit assumption that they are also of theoretical and func-
tional significance. The readiness with which researchers draw
on gender stereotypes in making reverse inferences (Bluhm,
2013b; Fine, 2013a) suggests an implicit assumption of dis-
tinctive female vs. male brains giving rise to “feminine” and
“masculine” behavior, respectively. Finally, the common use of
single “snapshot” female/male comparisons (Schmitz, 2002; Fine,
2013a) is in keeping with the implicit assumption of gen-
dered behavior and female and male brains as fixed and non-
contingent, meaning that such an approach promises to yield
“the” neural difference between the sexes for a particular gendered
behavior.
Thus, our goal in this article is to draw attention to the four key
principles of overlap, mosaicism, contingency and entanglement
that have emerged from sex/gender research, and discuss how they
should inform NI research design, analysis and interpretation.
PRINCIPLES FROM SEX/GENDER SCHOLARSHIP
OVERLAP
Studies examining sex/gender typically categorize participants as
female or male and apply statistical procedures of comparison.
Sex/gender differences in social behavior and cognitive skills are,
if found, far less profound than those portrayed by common
stereotypes. As Hyde (2005) found in her now classic review of
46 meta-analytic studies of sex differences, scores obtained from
groups of females and males substantially overlap on the majority
of social, cognitive, and personality variables. Of 124 effect
sizes (Cohen, 1988)
3
reviewed, 30% were between (+/−) 0 and
0.1 (e.g., negotiator competitiveness, reading comprehension,
vocabulary, interpersonal leadership style, happiness), while
48% were between (+/−) 0.11 and 0.35 (e.g., facial expression
processing in children, justice vs. care orientation in moral
reasoning, arousal to sexual stimuli, spatial visualization,
democratic vs. autocratic leadership styles). There is non-trivial
overlap even on “feminine” and “masculine” characteristics
such as physical aggression (d ranges from 0.33 to 0.84), tender-
mindedness (d = −0.91), and mental rotation (d ranges from 0.56
to 0.73). More recent reviews have also emphasized the extent of
this overlap (Miller and Halpern, 2013; Hyde, 2014).
3
By convention, a positive effect size refers to greater average male score, while
a negative effect size refers to a greater average female score.
There are more significant differences between women and
men in other categories of behavior, such as choice of occu-
pations and hobbies (Lippa, 1991). However, regardless of how
one wishes to characterize the data (that is, as demonstrating
that females and males are “different” or “similar”), or the
functional significance of differences of a particular size (con-
siderable or trivial), the important point for NI researchers is
that the distributions of social cognitive variables typically of
interest in research are likely to be highly overlapping between
the sexes, and this has implications for research design. It has
also been argued that many small differences may “add up”
to very significant differences overall (Del Giudice et al., 2012;
Cahill, 2014, although for critique of the latter, see Stewart-
Williams and Thomas, 2013; Hyde, 2014). However, not only
does this argument overlook the “mosaic” structure of sex/gender
(discussed in the next section) but, additionally, NI researchers
will generally be interested in isolating just one or two behavioral
variables.
Overlap in behavioral phenotype does not necessarily imply
overlap in cortical structural and functional phenotype, since
potentially the same behavioral ends may be reached via different
neural means—an important point when it comes to interpreta-
tion of group differences in neural characteristics (Fine, 2010b;
Hoffman, 2012). Indeed, it has been noted in non-human animals
that one average difference between the sexes in a brain char-
acteristic may compensate for another, giving rise to behavioral
similarity (De Vries, 2004). However, it nonetheless appears to be
the case that establishing non-ephemeral sex/gender differences
in cortical structures and functions has proved difficult. One
commonly cited difference, supported by several meta-analyses
and reviews, is that absolute brain volume is greater in men
than in women (Lenroot and Giedd, 2010; Sacher et al., 2013)
even when body size is controlled for (Cosgrove et al., 2007),
although, as with psychological characteristics, the distributions
overlap considerably. The significance of this is that, once volume
differences are controlled for, many previously reported regional
differences in specific structures disappear (e.g., Leonard et al.,
2008). For instance, the claim that callosal size is greater in males
is not supported when there is careful matching between the
sexes in brain-size (Bishop and Wahlsten, 1997; Jäncke et al.,
1997; Luders et al., 2014). However, this may not invariably be
the case, with clusters of regional female/male differences in gray
matter found to persist even in female and male participants
matched for brain size (Luders et al., 2009), consistent with
some previous findings (e.g., Good et al., 2001; Luders et al.,
2006) but not all (Lüders et al., 2002). In addition, Giedd et al.
(2012) note that the non-linear scaling relationship between
brain size and brain proportions affects white to gray matter
ratios, which could account for female/male differences in this
measure.
It is also important to note that it has proved difficult to repli-
cate well-accepted reports of sex/gender differences in functional
organization of brain regions underpinning specific cognitive
skills. A salutary example of this is the long-standing hypothesis
that the male brain is more lateralized for language processing.
A high-impact report that partially supported this hypothesis
(Shaywitz et al., 1995, see Kaiser et al., 2009) was subsequently
Frontiers in Human Neuroscience www.frontiersin.org August 2014 | Volume 8 | Article 650 |
143

Rippon et al. Issues in functional neuroimaging sex/gender research
shown to be spurious in two meta-analytic studies (Sommer et al.,
2004, 2008).
The substantive point here is not to argue that there are no
structural or functional brain differences between the sexes, but
to draw attention to the fact that neural characteristics are not so
distinctly different in the sexes that reliable differences are easily
identified. These data make it clear that dimorphism, the existence
of two distinct forms, is not an accurate way to characterize
sex/gender differences in neural phenotype.
MOSAICISM
Developments in understanding of the structure of gender (that
is, the traits, roles, behaviors, attitudes, and so on, associated
with femininity and masculinity) have challenged the earlier
assumption that the sexes cluster distinctively and consistently at
opposite ends of a single gender continuum (Terman and Miles,
1936) or can be located on two discrete “feminine” and “mas-
culine” dimensions (Bem, 1974). Because different feminine and
masculine characteristics are only weakly inter-correlated, if at all,
gender is now understood to be multi-factorial, rather than one-
or two-dimensional (Spence, 1993). Similarly, Carothers and Reis
(Carothers and Reis, 2013; Reis and Carothers, 2014), applying
taxometric methods to analyze the latent structure of gender,
have recently concluded that females’ and males’ psychological
attributes mostly differ in ways that are continuous rather than
categorical.
Similarly in neuroscience, the phenomenon of brain
mosaicism has been recognized for decades (Witelson, 1991;
Cahill, 2006; McCarthy and Arnold, 2011, see also Joel, 2011).
That is, an individual does not have a uniformly “female” or
“male” brain, but the “male” form (as statistically defined) in
some areas and the “female” form in others, and in ways that
differ across individuals. (Nor is this necessarily static, with
animal research indicating that even brief experiences such
as stress exposure can change brain characteristics from the
“female” to the “male” form, and vice versa; see Joel, 2011).
4
Thus, having a region in (say) the corpus callosum where a
structural or functional characteristic has been shown to be
statistically more characteristic of females is not a good predictor
for whether the same individual brain will also have a region in
(say) the amygdala that is associated with females. An implication
of this mosaicism is that specific brain areas that are labeled as
having a “female” or “male” phenotype can only be detected
through group-level statistical comparisons. In other words, just
as individuals are not comprehensively feminine or masculine
in traits, roles attitudes, etc., so too is it not possible for an
individual to have a “single-sex” brain.
Mosaicism of gendered behavior and brains is a critically
important point, because it conflicts with the more (although
not absolutely) categorical nature of biological sex, in which
female/male differences in sex chromosomes, gonads and gen-
itals are roughly dimorphic and highly interrelated, such that
4
The terms “female” and “male” here do not indicate an “innate” or “natural”
neural maleness or femaleness, but are rather place-holders for a statistical
approach that involves calculating the effect size of sex for a particular brain-
related data set.
individuals mostly have a unitary “male” or “female” phenotype.
As Joel (2012) has put the issue, “Using 3G-sex (genetic-gonadal-
genitals) as a model to understand sex differences in other
domains (e.g., brain, behavior) leads to the erroneous assump-
tion that sex differences in these other domains are also highly
dimorphic and highly consistent” (p. 1). Even where mosaicism
is acknowledged, the evidence may be undermined by common
terminology such as “female or male phenotype” (for describ-
ing global brain structure or psychology) or “sex dimorphism”
(Jordan-Young, 2014).
CONTINGENCY
Gendered behavior arises out of a dauntingly complex, recip-
rocally influencing interaction of multi-level factors, including
structural-level factors (e.g., prevailing cultural gender norms,
policies and inequalities), social-level factors (e.g., social status,
role, social context, interpersonal dynamics) as well as individual-
level factors such as biological characteristics (see “entanglement”
principle in the following section), gender identity, gendered
traits, attitudes, self-concepts, experiences, and skills. A few illus-
trative examples, which depart from the more “intuitive” concep-
tion of sex/gender differences as emerging from a causal pathway
that runs from genes to hormone to brain to behavior to social
structure, may be useful.
At the group level, women’s expression of “masculine” person-
ality traits (such as assertiveness) appears to be responsive to cul-
tural shifts in social status and role (Twenge, 1997, 2001), while in
the shorter term, gendered behavior is flexibly responsive to social
context and experience. For example, a meta-analysis conducted
by Ickes et al. (2000) found that a moderate female advantage
in empathic accuracy was only observed if participants were also
asked to make self-ratings of their accuracy (hypothesized to pref-
erentially enhance women’s motivation to perform well). Another
well-known example of social contextual effects on gendered
behavior is the “stereotype threat” phenomenon whereby, for
instance, female mathematical performance is diminished when
tests are presented in a way that makes salient the stereotype that
females are poor at mathematics (Nguyen and Ryan, 2008; Walton
and Spencer, 2009), although we acknowledge the more sceptical
conclusion regarding the size, robustness, and generality of the
stereotype threat effect from the meta-analysis by Stoet and Geary,
2012. As a third example, the average male advantage in mental
rotation is diminished by altering how the task is framed (e.g.,
Moè, 2009). Moreover, the beneficial effects of training, including
video-gaming, points to the contribution of gendered experience
to this skill (Feng et al., 2007). (For numerous additional examples
of stereotype threat effects on sex/gender differences, see Fine,
2010a).
From this brief discussion it should therefore not be surprising
that, in contrast with the near complete consistency of genetic,
gonadal and genital differences between the sexes, female/male
differences in behavior are variable across time, place, social or
ethnic group, and social situation. Indeed, intersectionality—the
principle that important social identities like gender, ethnicity,
and social class “mutually constitute, reinforce, and naturalize one
another” (Crenshaw, 1991, p. 302)—is an important tenet of gen-
der scholarship (Crenshaw, 1991; Shields, 2008). For example, as
Frontiers in Human Neuroscience www.frontiersin.org August 2014 | Volume 8 | Article 650 |
144

Rippon et al. Issues in functional neuroimaging sex/gender research
reviewed in Hyde (2014), female/male differences in mathematics
in the USA have not only decreased over time but also vary or
even reverse according to ethnic group. A review of differences
in math achievement in 69 nations by Else-Quest et al. (2010)
revealed that gender differences were not only very small, but
highly variable, with effect sizes ranging from −0.42 (a moderate
difference favoring females) to 0.40 (a moderate difference favor-
ing males); socio-cultural factors such as women’s parliamentary
representation, equity in school enrolment, and women’s share of
research jobs were significant predictors of gender gaps in math
achievement. As with cognitive skills, female/male differences in
personality (e.g., neuroticism/anxiety) or well-being (e.g., self-
esteem) that are seen in one country or ethnic group are not
necessarily observed in others (Costa et al., 2001, reviewed in
Hyde, 2014).
ENTANGLEMENT
As indicated above, there is considerable evidence that average
female/male differences can be modified, neutralized, or even
reversed by specific context, for example the manipulation of the
salience of such differences, or by chronic structural factors in the
environment, such as national wealth or gender equity (reviewed
in Miller and Halpern, 2013; Hyde, 2014). Clearly, this will be
reflected in the neural substrates of such behavior, which therefore
cannot be universal or fixed (see Fine, 2013b). This type of finding
is in keeping with the rejection of early models of the relationship
between brain and behavior in the study of sex/gender. These
were based on a fairly simple, almost unidirectional concept of
“hard-wiring”, in which brain characteristics were conceived as
being predetermined by the organizational effects of genetically-
programmed prenatal hormonal influences (Phoenix et al., 1959).
Here, each individual is endowed with a “female” or “male” brain
that gives rise to feminine and masculine behavior, respectively;
a neural substrate that social factors merely influence. This
assumption of distinctive female vs. male brain circuitry, largely
fixed by a sexually-differentiated genetic blueprint, is now clearly
challenged by changed models of neurodevelopment and wide-
spread consensus of on-going interactive and reciprocal influ-
ences of biology and environment in brain structure and function
(Li, 2003; Lickliter and Honeycutt, 2003; van Anders and Watson,
2006; Hausmann et al., 2009; McCarthy and Arnold, 2011; Miller
and Halpern, 2013). As NI research itself has been instrumental
in demonstrating, such interactions leave neural traces. A recent
review by May (2011) summarizes the evidence that new events,
environmental changes and skill learning can alter brain function
and the underlying neuroanatomic circuitry throughout our lives.
Such changes could be brought about by, for example, normal
learning experiences such as learning a language (Stein et al.,
2012) or specific training activities such as taxi-driving or juggling
(Maguire et al., 2000; Draganski et al., 2004; Chang, 2014). Other
research demonstrates brain characteristics that vary as a
function of socio-economic status (Hackman and Farah, 2009;
Noble et al., 2012) or even subjective or perceived socio-economic
status (Gianaros et al., 2007). Despite the key role played by NI
research in the emergent concept of the permanently plastic brain,
only a few NI studies have demonstrated how neuronal plasticity
has been related to sex/gender. Wraga et al. (2006), using a direct
comparison of task-related positive and negative stereotype prim-
ing, showed that the neural correlates of performance of the same
task reflected this priming, demonstrating short-term plasticity of
neural function. Longer-term functional and structural plasticity
was indicated in another within-sex study investigating the neural
effects in adolescent girls of 3 months of training with the visuo-
spatial problem solving computer game Tetris (Haier et al., 2009).
This dynamic and interactive conception of brain development
means that biological sex and the social phenomenon of gender
are “entangled” (Fausto-Sterling, 2000). That is, as a categoriza-
tion linked to social difference and inequality, an individual’s
biological sex systematically affects their psychological, physical,
and material experiences (Cheslack-Postava and Jordan-Young,
2012; Springer et al., 2012). For example, because gender is
an important organizing principle for social life, giving rise
to intensive gender socialization, including self-socialization
processes (e.g., Bussey and Bandura, 1999; Martin and Ruble,
2004; Leaper and Friedman, 2007; Tobin et al., 2010), both
formal training (e.g., school and vocational instruction) and daily
experiences (e.g., sports involvement, hobbies, games, poverty,
and harassment) are, at the group level, different for females
and males. It will be critical for NI work investigating hormone-
brain relations to take into account important insights into
entanglement from social neuroendocrinology. Contemporary
models identify hormones such as testosterone as key mediators
of behavioral plasticity, with animal research indicating both
genomic and non-genomic mechanisms involving both long-
term structural reorganization and short-term modulation of
sensitivity of neural circuitry (Adkins-Regan, 2005; Oliveira,
2009). This enables animals to be flexibly responsive to social
situations that, in humans, incorporate gendered norms with
respect to social phenomena such as competition, sexuality, and
nurturance (van Anders, 2013). For example, it has been shown
that fatherhood can reduce testosterone levels in males and that
this effect varies with the extent of paternal care and physical
contact with offspring (Gettler et al., 2011). Furthermore, a
comparison of two neighboring cultural groups in Tanzania
found lower testosterone levels among fathers from the popu-
lation in which paternal care was the cultural norm compared
with fathers from the group in which paternal care was typically
absent (Muller et al., 2009). Entanglement thus refers to the fact
that the social phenomenon of gender is literally incorporated,
shaping the brain and endocrine system (Fausto-Sterling, 2000),
becoming “part of our cerebral biology” (Kaiser et al., 2009, p. 57).
KEY PRINCIPLES: SUMMARY
The issues identified above indicate that, for NI researchers wish-
ing to examine sex/gender variables in studies of the human brain,
there are key factors which need to be taken into consideration in
the design, analysis, and interpretation of research in this category.
As illustrated in Figure 1, there will need to be adjustments made
to the assumptions underlying current typical research practices.
As will by now be clear from the discussion of the key principles
of sex/gender scholarship, gender essentialist assumptions are
inappropriate, and the experimental context complex and
contingent. Any one sample will consist of individuals with an
intricate mosaic of gendered attributes, the distributions for many
Frontiers in Human Neuroscience www.frontiersin.org August 2014 | Volume 8 | Article 650 |
145
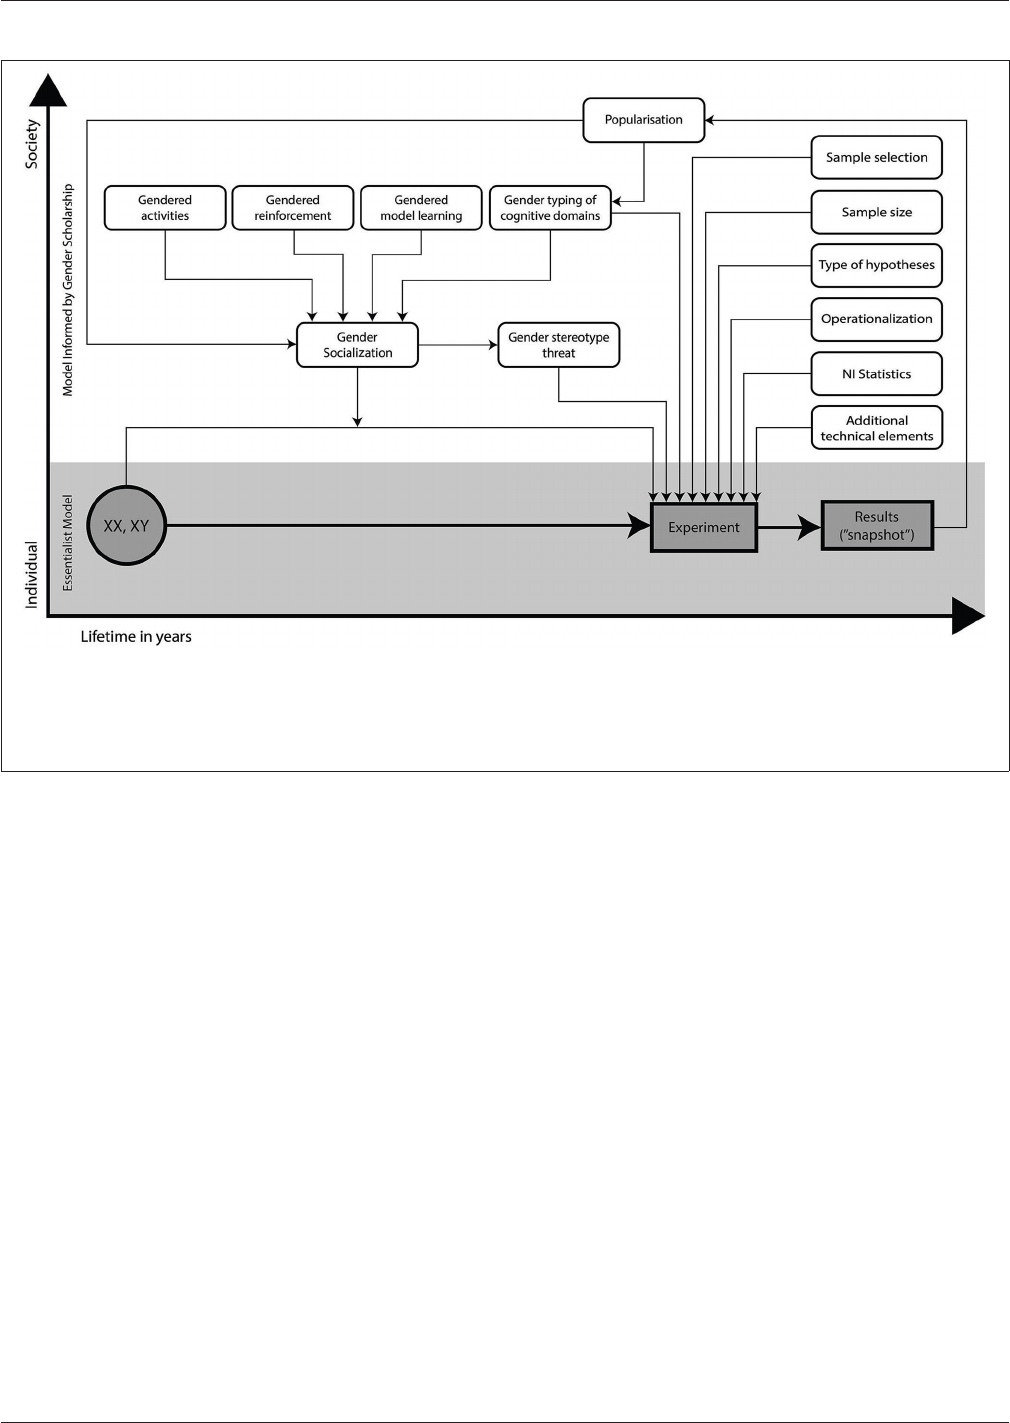
Rippon et al. Issues in functional neuroimaging sex/gender research
FIGURE 1 | Comparison of “Essentialist” vs. “Social Context”
models of experimental design in sex/gender research. (Shaded
section): the essentialist model that is often implicit in NI sex/gender
research: female-male differences appear to be directly traceable to
initial genetic differences between female and male individuals.
(Unshaded section): the social context model where social context
variables interact with individual biologies (contingency) and create
feedback loops with research design and practices (entanglement):
results of particular studies are understood as contingent and
entangled “snapshots”.
of which will be largely overlapping and may not differ at the
group level in that particular sample. Similarly, the individuals
in the sample will not have “female” or “male” brains as such,
but a mosaic of “feminine” and “masculine” characteristics.
Whatever female/male behavioral and therefore brain differences
are observed in that particular sample are contingent on both
chronic and short-term factors such as social group (such as social
class, ethnicity), place, historical period, and social context and
therefore cannot be assumed a priori to be generalizable to other
populations or even situations (such as the same task performed
in a different social context). Each individual’s behavioral and
neural phenotype at the moment of experimentation is the
dynamic product of a complex developmental process involving
reciprocally influential interactions between genes, brain, social
experience, and cultural context. Simpler, implicitly essentialist
models (see lower, shaded portion of Figure 1) will need
to be replaced by more complex multivariate models which
acknowledge the interactive contribution of many additional
sociocultural factors (see upper portion of Figure 1).
So what strategies do these key principles of sex/gender
scholarship imply for NI sex/gender research design, method-
ology, and interpretation? We now outline some of the key
implications and recommendations for research design, data
analysis, and interpretation, which we hope will result in changes
from standard practices (as illustrated in Figure 2A) to greater
acknowledgment of gender similarities as well as differences,
follow-up replication studies, and assessment of effect stabilities
where differences are found (see Figure 2B). We conclude with
a few comments concerning how these issues relate to ongoing
discussions regarding discipline-wide practices.
RECOMMENDATIONS
RESEARCH DESIGN
Sample size
Ultimately, sex/gender social and cognitive neuroscience is con-
cerned with the relationship between behavior and the brain,
and it is therefore critical that researchers be aware that the
key principle of overlap means that participants divided on the
basis of biological sex cannot be assumed to have neatly distinct
behavioral or cortical structural or functional profiles. Where
there is considerable overlap in distribution of scores between a
grouping factor (e.g., sex) and the dependent variable of interest,
the magnitude of any difference, or effect size (Cohen, 1988) will
be very small. Research designed to measure such a difference will
obviously need an adequately large sample size to reliably and
consistently identify such differences. Small sample size and asso-
ciated reduced statistical power has been identified as a central
problem in NI research (Carp, 2012; Button et al., 2013), as well
Frontiers in Human Neuroscience www.frontiersin.org August 2014 | Volume 8 | Article 650 |
146
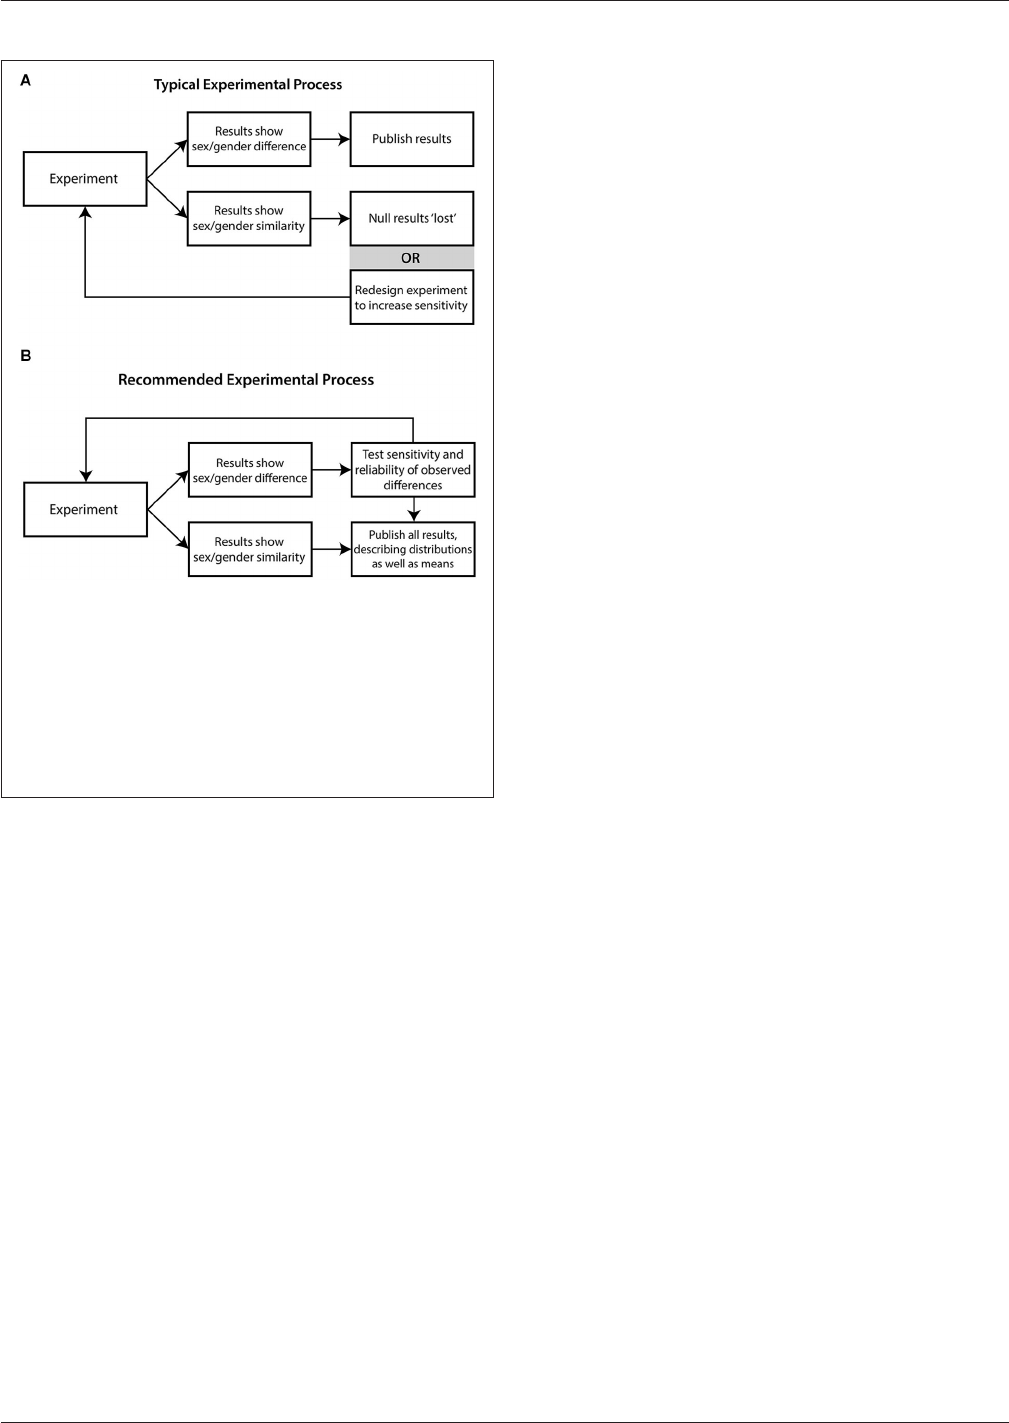
Rippon et al. Issues in functional neuroimaging sex/gender research
FIGURE 2 | Comparison of “typical” vs. “recommended” processes in
NI research. (A) Typical experimental process in NI research on sex/gender
is oriented towards identifying differences. Biological sex is considered
primary; two sexes are routinely compared, and findings of “no difference”
are often lost (though this may also stimulate redesign of study to better
detect difference). (B) The recommended experimental process proceeds
from the principle of overlap; when differences are observed, researchers
attempt to discern the reliability and sensitivity of these observations to
social and experimental context. Reports place equal emphasis on findings
of sex/gender difference and similarity, with emphasis on distributions.
as in sex/gender fMRI studies (Kaiser, 2010; Fine, 2013a). This
clearly raises a concern regarding the high probability of false-
negative findings. However, the low statistical power of many
studies also validates considerable concern that many reported
statistically significant findings are “false positive”. False-positive
errors are arguably the most costly errors in science (Simmons
et al., 2011), and can be remarkably persistent despite docu-
mented null findings (Fidler, 2011; Fine, 2013a). Although, in the-
ory, the probability of false positive errors should remain the same
regardless of sample size, as Fine and Fidler (2014) have noted,
a combination of publication bias, data noise, large intersubject
variability, and considerable scope for researcher discretion about
the construction of dependent variables may mean that, in prac-
tice, this is not the case. The difficulty, to date, of establishing
reliable, non-controversial sex differences in the brain becomes
less surprising in light of the key sex/gender principles discussed
here and indicates that studies with small sample sizes will lack
adequate statistical power and produce unreliable findings.
Independent and dependent variables
The evidence that gendered characteristics are often overlapping
and multi-dimensional indicates the usefulness of a dimensional
trait-based, rather than categorical sex-based, approach to
research (Jordan-Young and Rumiati, 2012). Although in
psychology the experimental registration of sex/gender in a multi-
parametric way is in its infancy, attempts are being made to trace
the many different facets of what is an “enormous conglomeration
of socialized, behavioral, cognitive, and culturally embedded
biomarkers” (Kaiser, 2014). To give some examples, relevant and
multiple information about sex/gender can be assessed through
the utilization of questionnaires assessing gendered personality
dimensions (Personal Attributes Questionnaire, PAQ; Spence
and Helmreich, 1978), gender attitudes (Ambivalent Sexism
Inventory, ASI; Glick and Fiske, 1996), self-attributed gender
norms (Conformity To Masculine Norms Inventory, Mahalik
et al., 2003, Conformity To Feminine Norms Inventory, CMFI;
Mahalik et al., 2005), specific aspects of gender socialization (The
Child Gender Socialization Scale, Blakemore and Hill, 2008),
gender identity (Joel et al., 2013) and others (for reviews, see
Smiler and Epstein, 2010; Moradi and Parent, 2013). A multi-
parametric registration of sex/gender combines multiple binary
classifications in various ways, similar to the mosaic-approach
of Joel (2011). Most importantly, it promises to emphasize the
multi-dimensionality of the factor sex/gender which is usually
only measured by checking the F or M box (see Figure 1). In
this way, specific sex/gender related information about gendered
experiences, gendered socialization, gendered behavior, gendered
cognition could be collected. With the emergent availability of
large neuroimaging (NI) datasets, much more subtle interro-
gation of these data would be possible if the demographic data
collected on the participants reflected the entangled complexity
of their psychological, physical, and material experiences, rather
than just their age and sex, as is currently typically the case.
As discussed above, there are physical characteristics of partic-
ipants that are specifically relevant to sex/gender NI research such
as head size (Barnes et al., 2010), given its relationship to brain
volume. Similarly, height and weight should be noted in order to
carry out the appropriate adjustments to brain volume measures;
failure to do this must undermine the validity of any reports of sex
differences in brain structure, as acknowledged by Ruigrok et al.
(2014). There is the possibility that variations in hormone levels
might produce (or mask) relevant sex/gender differences in brain
structure and function. There is not currently strong evidence
for such effects, but future research should be sure to take into
account a range of sources of variation (e.g., diurnal, seasonal, and
activity-related), and investigate variations in all research partici-
pants, as opposed to a singular focus, for example, on menstrual
cyclicity and variations in women only. If there is a focus on
hormonal variables, it should be noted that menstrual cycle phase
is not, in fact, a good proxy for hormone fluctuations and direct
measures will be required (Schwartz et al., 2012). Researchers
should also be aware that popular beliefs/well-publicized claims
regarding the psychological effects of menstrual phase on mood
and male attractiveness ratings, have not been supported by
recent meta-analyses (Romans et al., 2012; Wood et al., 2014, for
contrary conclusion, see Gildersleeve et al., 2014, for critique, see
Wood and Carden, in press).
If the basis of the research question is a link between
measured differences in brain structure or activation patterns
and behavioral or cognitive profiles, then a study’s dependent
Frontiers in Human Neuroscience www.frontiersin.org August 2014 | Volume 8 | Article 650 |
147

Rippon et al. Issues in functional neuroimaging sex/gender research
variables should obviously include appropriate measures of the
relevant behavior or cognitive skill, and not just assume that such
differences are well-known (and therefore do not need measur-
ing) (Tomasi and Volkow, 2012). Whatever behavioral measures
researchers choose in order to investigate the phenomenon of
interest, it will be necessary to acknowledge that no sex/gender
differences are “fixed” but contingent, the implication being that
research findings will at best be a snapshot of the relationship of
interest. Thus, an important research possibility is to addition-
ally draw on the principles of contingency and entanglement to
challenge the stabilities of observed differences and similarities, by
experimenting with context or population, for example. This can
be seen, for example, in studies investigating the extent to which
training can alter pre-existing sex/gender differences in visuo-
spatial processing (Feng et al., 2007). This type of research design
would enable researchers to perform a “sensitivity analysis” of
the conditions under which sex/gender is related to some kind of
neural function or structure, facilitating knowledge of the stability
and contingency of observed group differences. Hyde (2014) has
similarly recommended a focus on the exploration of contexts in
which gender differences appear and disappear as a way forward
in such research.
Research models and hypotheses
Although whole brain analysis is possible with all NI techniques,
many researchers choose to specify Regions of Interest (ROIs),
particular areas of the brain identified as of interest due to
previous research findings or predictions from particular neu-
rocognitive models. This approach can, for example, reduce the
multiple comparison problem resulting from comparing voxels
across the whole brain. Where an ROI approach is chosen for
either structure or function measures, the regions need to be
clearly specified in advance (Poldrack et al., 2008) which may
be difficult in the absence of a well-specified neurocognitive
model (see Bluhm, 2013a). Researchers may instead be drawn
to a priori hypotheses based on gender stereotypes (see Bluhm,
2013b), but clearly it needs to be carefully established whether
such stereotypes are more than trivially true.
Changing models of brain–behavior relationships require
adaptation of research exploring such relationships with atten-
tion to more and/or different categories of independent vari-
ables, including ways of capturing the role of the environment.
McCarthy and Arnold (2011, p. 681) note the need for a “more
nuanced portrayal of the types of variables that cause sex dif-
ferences”, acknowledging that environmental influences “have
an enormous effect on gender in humans and are arguably
more potent in sculpting the gender-based social phenotype of
humans” (p. 682). Jordan-Young (2010) and Jordan-Young and
Rumiati (2012) similarly identify problems associated with the
hard-wiring, “brain organization” theory in brain and brain
development research and note that if researchers wish to bring
understanding of how differences arise, then there is a need to
focus more on the dynamic aspects of brain development, on
the plasticity of the brain, and on identifying those events that
enhance or change the course of development. For example,
Cheslack-Postava and Jordan-Young (2012) reviewed research on
the epidemiology of autism, focusing on studies that described or
advanced explanations for the observed male preponderance in
autism diagnosis. They found no studies that explored potential
biosocial interactions of sex-linked biology and gender relations.
Instead, the female/male difference was attributed to biological
factors by default, though multiple lines of evidence suggest that
gender could play a role in either the development of the disorder,
or the likelihood of diagnosis once it is developed.
Given the major role played by NI itself in transforming our
understanding of brain plasticity, it is surprising that there are so
few examples of study design, cohort selection, and/or data inter-
pretation where the entanglement of sex and gender is considered.
The predominant approach is a “snapshot” comparison of females
and males, which will only give limited insights regarding why,
when or in whom such differences exist (Schmitz, 2002; Fine,
2013a,b). Importantly, although neuroscientists are well-aware
that “in the brain” does not mean “hardwired”, the predominant
use of “snap-shot” comparisons in sex/gender NI is guaranteed
not to produce data that might challenge the idea of universal,
fixed female/male brain differences (Fine, 2013a). The limitations
of a “snapshot” approach should be acknowledged in the research
design, where the choice of participants and/or their demograph-
ics should reflect more than just their biological sex (and possibly
age) but also perhaps factors such as educational history and
socio-economic and occupational status, with these factors con-
trolled for in any subsequent analyses. Particular attention should
be paid to the fact that there will be missing information concern-
ing gendered socialization of participants. It is very probable that
attitudes and behaviors of an individual have been sex-typically
reinforced by the environment throughout her/his life and that
development has been influenced by the particular importance of
social learning in humans in combination with culturally shared
gender stereotypes, norms, and roles (see Wood and Eagly, 2013).
As identified above, assessment tools for measuring information
about individual gender socialization are rare (Blakemore and
Hill, 2008), no doubt in part because the whole process of gender
socialization is highly complex and long-lasting, but also because
it is mostly implicit and habitual, rather than deliberate. However,
measures of gendered personal traits, attitudes, or cognitive devel-
opment can indirectly reflect the effects of gender socialization.
Fine and Fidler (2014) have argued that the principles of
overlap and mosaicism, together with the complexities arising
from the consequences of contingency and entanglement, raise
the important conceptual question of whether it makes sense at all
to try to identify an effect size of the impact of biological sex on
brain structure or function. But whatever precise research ques-
tion is pursued, uncovering what are undoubtedly highly com-
plex interactions against a background of noise and considerable
individual differences will require more complex experimental
designs. As the complexity of design increases, with multiple
groups and multiple comparisons, so too must the sample size
increase if adequate statistical power is to be achieved.
DATA ANALYSIS
Given the overlapping nature of sex/gender differences, it is
important that effect sizes for each of the individual variables
are reported. When studies reporting sex/gender differences
only provide information about statistical differences, a
Frontiers in Human Neuroscience www.frontiersin.org August 2014 | Volume 8 | Article 650 |
148

Rippon et al. Issues in functional neuroimaging sex/gender research
misleading impression can be given of a near distinctive—
or even oppositional—dichotomous finding. This was recently
well illustrated by a large-scale (n = 949) report of significant
sex differences in the structural connectome of the human
brain (Ingalhalikar et al., 2014), accompanied by statements
that the results “establish that male brains are optimized
for intrahemispheric and female brains for interhemispheric
communication” (p. 823). This was suggested to underpin
“pronounced [behavioral] sex differences” (p. 826). However, no
corrections for brain volume were made, and the actual effect
sizes for brain differences were unreported, while behavioral
differences in the larger population from which the sample were
drawn were very modest (Joel and Tarrasch, 2014), being between
0 and 0.33 for behavioral differences, with 11 of 26 effect sizes
being null/d < 0.1 (Gur et al., 2012).
A second statistical issue relating to the presentation of find-
ings is the problematic statistical practice observed in neu-
roscience generally (Nieuwenhuis et al., 2011), as well as in
NI sex/gender research (Kaiser et al., 2009; Bluhm, 2013a), of
analyzing group data separately and then doing a “qualitative”
comparison. Thus in sex/gender research, if a difference is found
in one group and not the other, it is reported as a sex difference,
even though no statistically significant difference has been estab-
lished. In some cases, both within-group and direct comparisons
are carried out, but only the former reported on. As Bluhm
(2013a) points out, only by a direct statistical comparison, can a
genuine difference be established, which should be illustrated by a
single image showing the group differences, not 2 separate images
for the 2 groups.
As will by now be clear, sex/gender NI research will require
complex statistical frameworks to integrate the key variables
associated with the participant cohort, to deal with the presence
of potential nuisance variables, as well as incorporating imaging
and behavioral data. This is obviously true of all NI research,
and currently generally addressed by the use of General Linear
Models (GLMs). However, the particularly “entangled” nature
of the demographic, biological, and psychological variables in
sex/gender research and the associated non-parametric nature
of much of the data should be acknowledged if using a stan-
dard GLM analysis (Poline and Brett, 2012)—or, better, non-
parametric methods such as permutation tests could be applied
(Winkler et al., 2014). It is important that, whatever it comprises,
the analysis pipeline is clearly specified (Bennett and Miller, 2010;
Carp, 2012).
INTERPRETATION
The principle of overlap in gendered behavior is particularly
important to bear in mind when it comes to inferring functional
interpretations from neural differences (Fine, 2010b; Roy, 2012).
It would seem obvious to add that this should be particularly
true where there is no actual measure of the behavior/cognitive
skill. The problematic nature of “reverse inference” is, of course,
well-known in the neuroscientific community (e.g., Poldrack,
2006). In reverse inference, activation in particular brain regions
is taken to equate to a specific mental process and, by extension,
differences in activation can be taken to indicate differences in
ability or efficiency. The danger is that gender stereotypes are
inappropriately drawn upon in making such reverse inferences.
This can happen particularly readily when, as is very often the
case, there is no a priori neurocognitive model guiding hypothe-
ses (Bluhm, 2013a; Fine, 2013a). This can lead to “stereotype-
inspired” reverse inferences even where these are contradicted by
behavioral similarity (see Fine, 2013a). In making reverse infer-
ences that are consistent with gender stereotypes, different groups
of researchers may even make precisely opposite assumptions
about the behavioral significance of more vs. less activation in the
same brain region (Bluhm, 2013b).
Although reverse inference is a generic issue in NI research,
the ease and intuitive plausibility of such inferences in sex/gender
NI studies makes it of particular concern. Reverse inference can
certainly be a useful research tool when used to generate hypothe-
ses to put to test in further work (Poldrack, 2008), and Fine
(2013b) has noted the legitimacy of such an approach as part of a
strategy of systematic development and testing of neurocognitive
models and predictions. However, what is more common is to
draw on stereotypical (and often inaccurate) assumptions about
female/male differences in behavior or skill set post hoc to inform
these inferences (Fine, 2013a). Given the sex/gender principle of
overlap, this is poor scientific practice.
A final point of interpretation relates to entanglement. A recent
review of sex/gender differences in decision-making “noted that
we will use sex differences rather than gender differences in this
review as we are focussed on biologically founded rather than
culturally or socio-economically founded differences” (Van de
Bos et al., 2013, p. 96). However, it is the nature of the entangle-
ment problem that the variables of sex and gender are irreducibly
entwined—it is not, in practice, possible to “control” for the
gendered environment and examine only sex. This should be
acknowledged, then, in the interpretation of findings. In addition,
any evidence that the dependent variables being measured may be
subject to alteration by training or focussed intervention should
also be recognized. In addition, researchers should avoid framing
findings of female-male differences as being “biological” or “fun-
damental”. Likewise, it is generally advisable to avoid the language
that some variable is “affected by sex”, because that suggests the
effect of biology apart from the gendered environment. Instead,
the language “affected by sex/gender” or “linked with sex” would
be preferable. It should, indeed, be considered that a study that
approaches sex/gender as subject variable is only an ex-post facto
study and, thus, it cannot demonstrate that sex/gender causes
differences in any behavior (Brannon, 2008).
DISCIPLINE-WIDE IMPLICATIONS
While the aim of the recommendations above is to inform the
planning, interpreting, and quality assessment of sex/gender
research, we also think it is worth relating these issues to ongoing
discussions regarding collective, discipline-wide strategies that
could be helpful for ameliorating some of the issues in NI
sex/gender research. One interesting proposal to consider is
that of the “pre-registration” of protocols. This “in principle
acceptance” (IPA) has recently been suggested in psychology
circles (Chambers, 2013). A study protocol is submitted for
peer review before the study is carried out; details include the
relevant background literature and hypotheses, together with the
Frontiers in Human Neuroscience www.frontiersin.org August 2014 | Volume 8 | Article 650 |
149

Rippon et al. Issues in functional neuroimaging sex/gender research
specific procedures and analysis protocol (including sample size
and a priori power analysis). Once accepted, the study is carried
out exactly according to the agreed procedures and all findings
published. This process could overcome many of those factors
we have identified in this paper as significantly detrimental to
NI sex/gender research. Publication bias could be reduced, as
manuscript acceptance would be a function of the significance of
the research question and associated methodology, not whether
or not the results exceeded the magical p < 0.05 threshold. Thus,
over time, it would be possible to better ascertain the ratio of
negative to positive findings in any research sphere. While we
acknowledge the value and role of exploratory research in the
scientific research, declaring the analysis pipeline in advance
would put constraints on practices such as post hoc data mining
(Wagenmakers et al., 2011) and ensure that any failures to
support hypotheses were identified as well as the converse. It
could also preclude the post hoc introduction of interpretations,
e.g., stereotypical assumptions about participant characteristics
that were not measured as part of the study.
A long-standing proposal also relevant to some of the issues
discussed here (see Fine and Fidler, 2014) is that of following
the discipline of medicine in shifting away from null hypothesis
significance testing towards an estimation approach of effect sizes
and measures of their associated uncertainty, and greater use
of meta-analysis. Proponents of the estimation approach (for
extensive reviews, see Kline, 2004; Cumming, 2012), argue for a
number of advantages over a null hypothesis significance testing
approach, including reduced scope for false positive and false neg-
ative errors, and diminished conflation of statistical significance
with practical or theoretical significance.
While the case for these two proposals is being made for
behavioral science as a whole, the next two suggestions are more
specific to sex/gender research, and arise out of the ease of default
testing for sex/gender differences post hoc. One consequence of
this is that the domain-general publication bias towards positive
findings in behavioral science (Simmons et al., 2011; Fanelli, 2012;
Yong, 2012) is greatly exacerbated in sex/gender research (e.g.,
Maccoby and Jacklin, 1974). Reviews of sex/gender NI research
have demonstrated that this is a field that is indeed vulnerable
to an overemphasis on positive findings and “loss” of null results
(Bishop and Wahlsten, 1997; Fausto-Sterling, 2000; Kaiser et al.,
2007; Fine, 2013a; see Figure 2). The first proposal is for the
institutionalization of sex/gender similarity as well as difference
in databases, to make it more likely that null findings are both
recorded and identifiable. The second proposal is for editors of
NI journals to request that sex/gender differences are replicated
in an independent sample (obviously with discretion, depending
on the rigor of the initial findings), to reduce the littering of the
scientific literature with false-positive results.
Although, de facto, all research areas will wish to follow best
practice guidelines, it is particularly important that the sex/gender
NI research community is aware of the potential social signifi-
cance of their findings (Roy, 2012; Schmitz, 2012). As reviewed
elsewhere (e.g., Fine, 2012; Fine and Fidler, 2014), Choudhury
et al. have argued that the representation of “brain facts” in
the media, policy, and lay perceptions influence society in ways
that can affect the very mental phenomena under investigation
(Choudhury et al., 2009). This is illustrated in the upper part
of Figure 1, whereby the result of the experiment itself, through
its popularization, becomes part of gender socialization, and
thus the experiment becomes entangled with the phenomenon
of interest. With respect to NI research, this feedback effect may
be enhanced by the popular and powerful impact of “brain
facts” (Weisberg et al., 2008). The original finding of persua-
sive power of brain images (McCabe and Castel, 2008) has
been disputed both qualitatively (Farah and Hook, 2013) and
quantitatively in a recent meta-analysis (Michael et al., 2013).
However, “brain facts”, regardless of the presence or absence
of brain images, may enhance how satisfactory or valuable lay
people judge scientific explanations of psychological phenom-
ena to be (Morton et al., 2006; Weisberg et al., 2008; Michael
et al., 2013). Gender essentialist thinking has been associated
with a range of negative psychological consequences, including
greater endorsement of gender stereotypes both in relation to
self (Coleman and Hong, 2008) and others (Martin and Parker,
1995; Brescoll and LaFrance, 2004), stereotype threat effects
(Dar-Nimrod and Heine, 2006; Thoman et al., 2008), greater
acceptance of sexism, and increased tolerance for the status quo
(Morton et al., 2009). This is in line with what Hacking (1995, p.
351) has described as “looping” or “feedback effects in cognition
and culture”, whereby the causal understanding of a particular
group changes the very character of the group, leading to further
change in causal understanding. In other words, the outputs of
sex/gender NI can affect the very object of their investigation,
putting a particular responsibility on scientists to follow good
practice guidelines for research. By taking steps to avoid false
positives, to avoid the use of stereotypical reverse inferences,
to give equal weight to sex/gender similarities as well as differ-
ences and to acknowledge the dynamic and entangled aspect of
sex/gender variables, with research findings only representing a
static “snapshot” in time, scientists can do much to avoid the
undesirable consequences outlined above (see also Fine et al.,
2013).
CONCLUSION
We have outlined above the consequences for NI sex/gender
research design, analytical protocols, and data interpretation of
the four key principles of overlap, mosaicism, contingency, and
entanglement and have summarized the consequences of these
as a set of guidelines. These key principles and recommendations
could also inform editorial boards and journal reviewers, as well
as those who view, communicate, and interpret such research.
In Figure 3, we offer a set of guidelines for the assessment of
NI sex/gender research in order to assure that such research
has addressed these implications (or, indeed, can). NI research
is costly, time-consuming, and labor intensive. If it is to be
applied in the field of sex/gender research then attention to
the issues discussed here could reduce the incidence of under-
informed research designs with consequent lack of reliable find-
ings and/or waste of potentially valuable datasets. Changes to
current research practices should result in a greater contribution
to an understanding of the interaction between the neurobiology
of the individual and the environment in which s/he develops and
functions.
Frontiers in Human Neuroscience www.frontiersin.org August 2014 | Volume 8 | Article 650 |
150
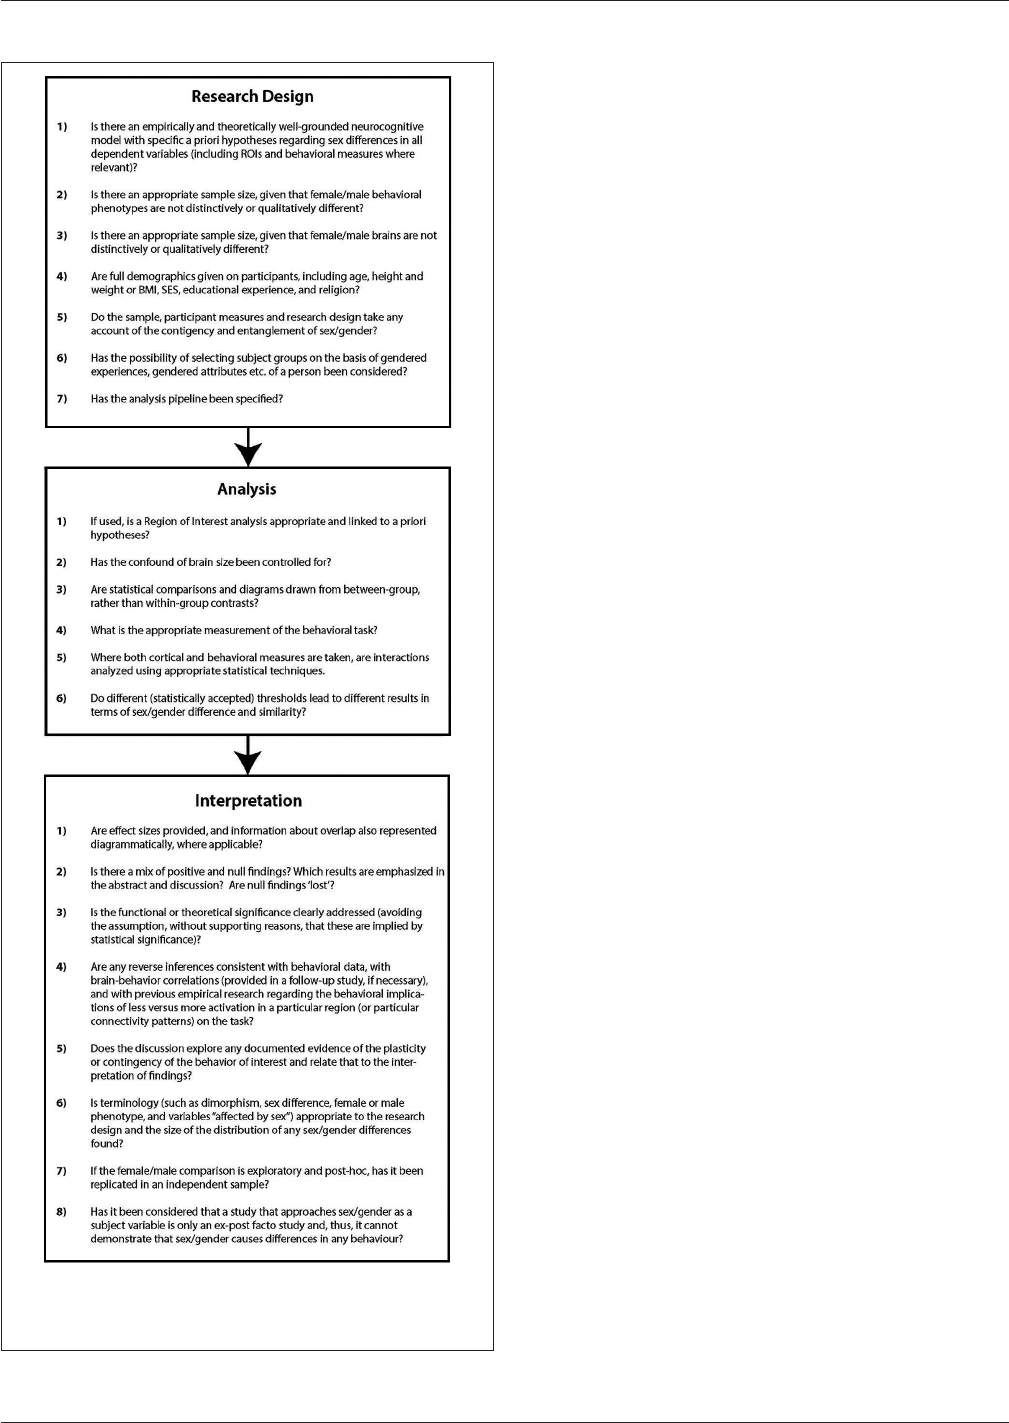
Rippon et al. Issues in functional neuroimaging sex/gender research
FIGURE 3 | Proposed guidelines for sex/gender research in
neuroscience: critical questions for research design, analysis, and
interpretation.
ACKNOWLEDGMENTS
The authors thank Donovan J. Roediger MA for thoughtful con-
struction of the figures. We would also like to thank the reviewers
for helpful and constructive comments on the original submis-
sion. Cordelia Fine is supported by an Australian Research Coun-
cil Future Fellowship FT110100658. Rebecca Jordan-Young’s work
on this manuscript was supported by a grant from the Tow
Family Foundation. Anelis Kaiser is supported by the Swiss
National Science Foundation (Marie Heim-Vögtlin Programme)
PMPDP1_145452.
REFERENCES
Adkins-Regan, E. (2005). Hormones and Animal Social Behavior. Princeton, NJ,
Princeton: University Press.
Barnes, J., Ridgway, G. R., Bartlett, J., Henley, S. M. D., Lehmann, M., Hobbs, N.,
et al. (2010). Head size, age and gender adjustment in MRI studies: a necessary
nuisance? Neuroimage 53, 1244–1255. doi: 10.1016/j.neuroimage.2010.06.025
Bem, S. L. (1974). The measurement of psychological androgyny. J. Consult. Clin.
Psychol. 42, 155–162. doi: 10.1037/h0036215
Bennett, C. M., and Miller, M. B. (2010). How reliable are the results from
functional magnetic resonance imaging? Ann. N Y Acad. Sci. 1191, 133–135.
doi: 10.1111/j.1749-6632.2010.05446.x
Bishop, K., and Wahlsten, D. (1997). Sex differences in the human corpus callosum:
myth or reality? Neurosci. Biobehav. Rev. 21, 581–601. doi: 10.1016/s0149-
7634(96)00049-8
Blakemore, J., and Hill, C. (2008). The child gender socialization scale: a measure
to compare traditional and feminist parents. Sex Roles 58, 192–207. doi: 10.
1007/s11199-007-9333-y
Bluhm, R. (2013a). New research, old problems: methodological and ethical issues
in fMRI research examining sex/gender differences in emotion processing.
Neuroethics 6, 319–330. doi: 10.1007/s12152-011-9143-3
Bluhm, R. (2013b). Self-fulfilling prophecies: the influence of gender stereotypes
on functional neuroimaging research on emotion. Hypatia 28, 870–886. doi: 10.
1111/j.1527-2001.2012.01311.x
Brannon, L. (2008). Gender: Psychological Perspectives. Boston, MA: Pearson.
Brescoll, V., and LaFrance, M. (2004). The correlates and consequences of news-
paper reports of research on sex differences. Psychol. Sci. 15, 515–520. doi: 10.
1111/j.0956-7976.2004.00712.x
Bussey, K., and Bandura, A. (1999). Social cognitive theory of gender development
and differentiation. Psychol. Rev. 106, 676–713. doi: 10.1037/0033-295x.106.
4.676
Button, K. S., Ioannidis, J. P. A., Mokrysz, C., Nosek, B. A., Flint, J., Robinson,
E. S. J., et al. (2013). Power failure: why small sample size undermines the relia-
bility of neuroscience. Nat. Rev. Neurosci. 14, 365–376. doi: 10.1038/nrn3475
Cahill, L. (2006). Why sex matters for neuroscience. Nat. Rev. Neurosci. 7, 477–484.
doi: 10.1038/nrn1909
Cahill, L. (2014). Equal 6= the same: sex differences in the human brain. Cerebrum
[Online]. Available online at: http://www.dana.org/Cerebrum/2014/Equal_%E2
%89%A0 The Same Sex Differences in the Human Brain/. [Accessed 11 July,
2014].
Carothers, B. J., and Reis, H. T. (2013). Men and women are from earth: examining
the latent structure of gender. J. Pers. Soc. Psychol. 104, 385–407. doi: 10.
1037/a0030437
Carp, J. (2012). The secret lives of experiments: methods reporting in the fMRI
literature. Neuroimage 63, 289–300. doi: 10.1016/j.neuroimage.2012.07.004
Chambers, C. D. (2013). Registered reports: a new publishing initiative at cortex.
Cortex 49, 609–610. doi: 10.1016/j.cortex.2012.12.016
Chang, Y. (2014). Reorganization and plastic changes of the human brain asso-
ciated with skill learning and expertise. Front. Hum. Neurosci. 8:35. doi: 10.
3389/fnhum.2014.00035
Cheslack-Postava, K., and Jordan-Young, R. M. (2012). Autism spectrum disorders:
toward a gendered embodiment model. Soc. Sci. Med. 74, 1667–1674. doi: 10.
1016/j.socscimed.2011.06.013
Choudhury, S., Nagel, S., and Slaby, J. (2009). Critical neuroscience: linking
neuroscience and society through critical practice. Biosocieties 4, 61–77. doi: 10.
1017/s1745855209006437
Frontiers in Human Neuroscience www.frontiersin.org August 2014 | Volume 8 | Article 650 |
151

Rippon et al. Issues in functional neuroimaging sex/gender research
Cohen, J. (1988). Statistical Power Analysis for the Behavioral Sciences. Hillsdale, NJ:
Erlbaum Associates.
Coleman, J., and Hong, Y.-Y. (2008). Beyond nature and nurture: the influence
of lay gender theories on self-stereotyping. Self Identity 7, 34–53. doi: 10.
1080/15298860600980185
Cosgrove, K. P., Mazure, C. M., and Staley, J. K. (2007). Evolving knowledge of sex
differences in brain structure, function and chemistry. Biol. Psychiatry 62, 847–
855. doi: 10.1016/j.biopsych.2007.03.001
Costa, P. Jr., Terracciano, A., and McCrae, R. (2001). Gender differences in person-
ality traits across cultures: robust and surprising findings. J. Pers. Soc. Psychol.
81, 322–331. doi: 10.1037//0022-3514.81.2.322
Crenshaw, K. (1991). Mapping the margins: intersectionality, identity politics and
violence against women of color. Stanford Law Rev. 43, 1241–1299. doi: 10.
2307/1229039
Cumming, G. (2012). Uniderstanding the New Statistics: Effect Sizes, Confidence
Intervals and Meta-Analysis. New York, NY: Routledge.
Dar-Nimrod, I., and Heine, S. (2006). Exposure to scientific theories affects
women’s math performance. Science 314:435. doi: 10.1126/science.1131100
Del Giudice, M., Booth, T., and Irwing, P. (2012). The distance between mars
and venus: measuring global sex differences in personality. PLoS One 7:e29265.
doi: 10.1371/journal.pone.0029265
De Vries, G. (2004). Minireview: sex differences in adult and developing brains:
compensation, compensation, compensation. Endocrinology 145, 1063–1068.
doi: 10.1210/en.2003-1504
Draganski, B., Gaser, C., Busch, V., Schuierer, G., Bogdahn, U., and May, A. (2004).
Neuroplasticity: changes in grey matter induced by training. Nature 427, 311–
312. doi: 10.1038/427311a
Else-Quest, N. M., Hyde, J. S., and Linn, M. C. (2010). Cross-national patterns of
gender differences in mathematics: a meta-analysis. Psychol. Bull. 136, 103–127.
doi: 10.1037/a0018053
Fanelli, D. (2012). Negative results are disappearing from most disciplines and
countries. Scientometrics 90, 891–904. doi: 10.1007/s11192-011-0494-7
Farah, M. J., and Hook, C. J. (2013). The seductive allure of “Seductive Allure”.
Perspect. Psychol. Sci. 8, 88–90. doi: 10.1177/1745691612469035
Fausto-Sterling, A. (2000). Sexing the Body: Gender Politics and the Construction of
Sexuality. New York: Basic Books.
Feng, J., Spence, I., and Pratt, J. (2007). Playing an action video game reduces gender
differences in spatial cognition. Psychol. Sci. 18, 850–855. doi: 10.1111/j.1467-
9280.2007.01990.x
Fidler, F. (2011). “Ethics and statistical reform: lessons from medicine,” in The
Ethics of Quantitative Methodology: A Handbook for Researchers, eds A. Panter
and S. Sterba (London: Taylor and Francis (Multivariate Application Book
Series)), 445–462.
Fine, C. (2010a). Delusions of Gender: How Our Minds, Society and Neurosexism
Create Difference. New York: WW Norton.
Fine, C. (2010b). From scanner to sound bite: issues in interpreting and reporting
sex differences in the brain. Curr. Dir. Psychol. Sci. 19, 280–283. doi: 10.
1177/0963721410383248
Fine, C. (2012). Explaining, or sustaining, the status quo? The potentially self-
fulfilling effects of ‘hardwired’ accounts of sex differences. Neuroethics 5, 285–
294. doi: 10.1007/s12152-011-9118-4
Fine, C. (2013a). Is there neurosexism in functional neuroimaging investigations of
sex differences? Neuroethics 6, 369–409. doi: 10.1007/s12152-012-9169-1
Fine, C. (2013b). “Neurosexism in functional neuroimaging: from scanner to
pseudo-science to psyche,” in The Sage Handbook of Gender and Psychology, eds
M. Ryan and N. Branscombe (Thousand Oaks, CA: Sage), 45–61.
Fine, C., and Fidler, F. (2014). “Sex and power: why sex/gender neuroscience should
motivate statistical reform,” in Handbook of Neuroethics, eds J. Clausen and N.
Levy (Dordrecht: Springer Science and Business Media), 1447–1462.
Fine, C., Jordan-Young, R. M., Kaiser, A., and Rippon, G. (2013). Plasticity,
plasticity, plasticity . . . and the rigid problem of sex. Trends Cogn. Sci. 17, 550–
551. doi: 10.1016/j.tics.2013.08.010
Gettler, L., McDade, T., Feranil, A., and Kuzawa, C. (2011). Longitudinal evidence
that fatherhood decreases testosterone in human males. Proc. Natl. Acad. Sci.
U S A 108, 13194–16199. doi: 10.1073/pnas.1105403108
Gianaros, P. J., Horenstein, J. A., Cohen, S., Matthews, K. A., Brown, S. M.,
Flory, J. D., et al. (2007). Perigenual anterior cingulate morphology covaries
with perceived social standing. Soc. Cogn. Affect. Neurosci. 2, 161–173. doi: 10.
1093/scan/nsm013
Giedd, J., Raznahan, A., Mills, K., and Lenroot, R. (2012). Review: magnetic reso-
nance imaging of male/female differences in human adolescent brain anatomy.
Biol. Sex Differ. 3:19. doi: 10.1186/2042-6410-3-19
Gildersleeve, K., Haselton, M. G., and Fales, M. R. (2014). Do women’s mate
preferences change across the ovulatory cycle? A meta-analytic review. Psychol.
Bull. doi: 10.1037/a0035438. [Epub ahead of print].
Glick, P., and Fiske, S. T. (1996). The ambivalent sexism inventory: differentiating
hostile and benevolent sexism. J. Pers. Soc. Psychol. 70, 491–512. doi: 10.
1037/0022-3514.70.3.491
Good, C. D., Johnsrude, I., Ashburner, J., Henson, R. N. A., Friston, K. J., and
Frackowiak, R. S. J. (2001). Cerebral asymmetry and the effects of sex and
handedness on brain structure: a voxel-based morphometric analysis of 465
normal adult human brains. Neuroimage 14, 685–700. doi: 10.1006/nimg.2001.
0857
Gur, R. C., Richard, J., Calkins, M. E., Chiavacci, R., Hansen, J. A., Bilker, W. B.,
et al. (2012). Age group and sex differences in performance on a computerized
neurocognitive battery in children age 8–21. Neuropsychology 26, 251–265.
doi: 10.1037/a0026712
Hacking, I. (1995). “The looping effects of human kinds,” in Causal Cognition:
A Multidisciplinary Approach, eds D. Sperber, D. Premack and A. Premack
(Oxford: Oxford University Press), 351–383.
Hackman, D. A., and Farah, M. J. (2009). Socioeconomic status and the developing
brain. Trends Cogn. Sci. 13, 65–73. doi: 10.1016/j.tics.2008.11.003
Haier, R., Karama, S., Leyba, L., and Jung, R. (2009). MRI assessment of cortical
thickness and functional activity changes in adolescent girls following three
months of practice on a visual-spatial task. BMC Res. Notes 2:174. doi: 10.
1186/1756-0500-2-174
Haslam, N., Rothschild, L., and Ernst, D. (2000). Essentialist beliefs about
social categories. Br. J. Soc. Psychol. 39, 113–127. doi: 10.1348/0144666001
64363
Haslam, N., and Whelan, J. (2008). Human natures: psychological essentialism in
thinking about differences between people. Soc. Personal. Psychol. Compass 2,
1297–1312. doi: 10.1111/j.1751-9004.2008.00112.x
Hausmann, M., Schoofs, D., Rosenthal, H. E. S., and Jordan, K. (2009). Interactive
effects of sex hormones and gender stereotypes on cognitive sex differences—
a psychobiological approach. Psychoneuroendocrinology 34, 389–401. doi: 10.
1016/j.psyneuen.2008.09.019
Hines, M. (2004). Brain Gender. New York: Oxford University Press.
Hoffman, G. (2012). “What, if anything, can neuroscience tell us about gender
differences?,” in Neurofeminism: Issues at the Intersection of Feminist Theory and
Cognitive Science, eds R. Bluhm, A. Jacobson and H. Maibom (Basingstoke:
Palgrave Macmillan), 30–56.
Hyde, J. (2005). The gender similarities hypothesis. Am. Psychol. 60, 581–592.
doi: 10.1037/0003-066x.60.6.581
Hyde, J. S. (2014). Gender similarities and differences. Annu. Rev. Psychol. 65, 373–
398. doi: 10.1146/annurev-psych-010213-115057
Ickes, W., Gesn, P., and Graham, T. (2000). Gender differences in empathic
accuracy: differential ability or differential motivation? Pers. Relatsh. 7, 95–109.
doi: 10.1111/j.1475-6811.2000.tb00006.x
Ingalhalikar, M., Smith, A., Parker, D., Satterthwaite, T. D., Elliott, M. A., Ruparel,
K., et al. (2014). Sex differences in the structural connectome of the human
brain. Proc. Natl. Acad. Sci. U S A 111, 823–828. doi: 10.1073/pnas.13169
09110
Jäncke, L., Staiger, J. F., Schlaug, G., Huang, Y., and Steinmetz, H. (1997). The
relationship between corpus callosum size and forebrain volume. Cereb. Cortex
7, 48–56. doi: 10.1093/cercor/7.1.48
Joel, D. (2011). Male or female? Brains are intersex. Front. Integr. Neurosci. 5:57.
doi: 10.3389/fnint.2011.00057
Joel, D. (2012). Genetic-gonadal-genitals sex (3G-sex) and the misconception of
brain and gender, or, why 3G-males and 3G-females have intersex brain and
intersex gender. Biol. Sex Differ. 3:27. doi: 10.1186/2042-6410-3-27
Joel, D., and Tarrasch, R. (2014). On the mis-presentation and misinterpretation of
gender-related data: the case of Ingalhalikar’s human connectome study. Proc.
Natl. Acad. Sci. U S A 111:E637. doi: 10.1073/pnas.1323319111
Joel, D., Tarrasch, R., Berman, Z., Mukamel, M., and Ziv, E. (2013). Queering
gender: studying gender identity in ‘normative’ individuals. Psychol. Sex., 1–31.
doi: 10.1080/19419899.2013.830640
Jordan-Young, R. (2010). Brain Storm: The Flaws in the Science of Sex Differences.
Cambridge, MA: Harvard University Press.
Frontiers in Human Neuroscience www.frontiersin.org August 2014 | Volume 8 | Article 650 |
152

Rippon et al. Issues in functional neuroimaging sex/gender research
Jordan-Young, R. M. (2014). “Fragments for the future,” in Gendered Neurocultures:
Feminist and Queer Perspectives on Current Brain Discourses, eds S. Schmitz and
G. Höppner (Vienna: Zaglossus), 375–391.
Jordan-Young, R., and Rumiati, R. (2012). Hardwired for sexism? Approaches to
sex/gender in neuroscience. Neuroethics 5, 305–315. doi: 10.1007/s12152-011-
9134-4
Kaiser, A. (2010). “Sex/gender and neuroscience: focusing on current research,”
in Never Mind the Gap! Crossroads of Knowledge 14, eds M. Blomquist and
E. Ehnsmyr (Uppsala: Skrifter från Centrum för genusvetenskap. University
Printers), 189–210.
Kaiser, A. (2012). Re-conceptualizing “sex” and “gender” in the human brain. J.
Psychol. 220, 130–136. doi: 10.1027/2151-2604/a000104
Kaiser, A. (2014). “On the (im)possibility of a feminist and queer neuroexperi-
ment,” in Gendered Neurocultures: Feminist and Queer Perspectives on Current
Brain Discourses, eds S. Schmitz and G. Höppner (Vienna: Zaglossus), 41–66.
Kaiser, A., Haller, S., Schmitz, S., and Nitsch, C. (2009). On sex/gender related
similarities and differences in fMRI language research. Brain Res. Rev. 61, 49–
59. doi: 10.1016/j.brainresrev.2009.03.005
Kaiser, A., Kuenzli, E., Zappatore, D., and Nitsch, C. (2007). On females’ lateral
and males’ bilateral activation during language production: a fMRI study. Int. J.
Psychophysiol. 63, 192–198. doi: 10.1016/j.ijpsycho.2006.03.008
Kline, R. (2004). Beyond Significance Testing: Reforming Data Analysis Meth-
ods in Behavioral Research. Washington DC, USA: American Psychological
Association.
Leaper, C., and Friedman, C. (2007). “The socialization of gender,” in Handbook of
Socialization: Theory and Research, eds J. Grusec and P. Hastings (New York, NY:
Guilford), 561–588.
Lenroot, R. K., and Giedd, J. N. (2010). Sex differences in the adolescent brain.
Brain Cogn. 72, 46–55. doi: 10.1016/j.bandc.2009.10.008
Leonard, C. M., Towler, S., Welcome, S., Halderman, L. K., Otto, R., Eckert,
M. A., et al. (2008). Size matters: cerebral volume influences sex differences in
neuroanatomy. Cereb. Cortex 18, 2920–2931. doi: 10.1093/cercor/bhn052
Li, S.-C. (2003). Biocultural orchestration of developmental plasticity across levels:
the interplay of biology and culture in shaping the mind and behavior across the
life span. Psychol. Bull. 129, 171–194. doi: 10.1037/0033-2909.129.2.171
Lickliter, R., and Honeycutt, H. (2003). Developmental dynamics: toward a bio-
logically plausible evolutionary psychology. Psychol. Bull. 129, 819–835. doi: 10.
1037/0033-2909.129.6.819
Lippa, R. (1991). Some psychometric characteristics of gender diagnosticity mea-
sures: reliability, validity, consistency across domains and relationship to the
big five. J. Pers. Soc. Psychol. 61, 1000–1011. doi: 10.1037/0022-3514.61.6.
1000
Luders, E., Gaser, C., Narr, K., and Toga, A. (2009). Why sex matters: brain size
independent differences in gray matter distributions between men and women.
J. Neurosci. 29, 14265–14270. doi: 10.1523/JNEUROSCI.2261-09.2009
Luders, E., Narr, K. L., Thompson, P. M., Rex, D. E., Woods, R. P., Deluca, H., et al.
(2006). Gender effects on cortical thickness and the influence of scaling. Hum.
Brain Mapp. 27, 314–324. doi: 10.1002/hbm.20187
Lüders, E., Steinmetz, H., and Jancke, L. (2002). Brain size and grey matter volume
in the healthy human brain. Neuroreport 13, 2371–2374. doi: 10.1097/00001756-
200212030-00040
Luders, E., Toga, A. W., and Thompson, P. M. (2014). Why size matters: differences
in brain volume account for apparent sex differences in callosal anatomy: the
sexual dimorphism of the corpus callosum. Neuroimage 84, 820–824. doi: 10.
1016/j.neuroimage.2013.09.040
Maccoby, E. E., and Jacklin, C. N. (1974). The Psychology of Sex Differences.
Stanford, CA: Stanford University Press.
Maguire, E. A., Gadian, D. G., Johnsrude, I. S., Good, C. D., Ashburner, J.,
Frackowiak, R. S. J., et al. (2000). Navigation-related structural change in the
hippocampi of taxi drivers. Proc. Natl. Acad. Sci. U S A 97, 4398–4403. doi: 10.
1073/pnas.070039597
Mahalik, J. R., Locke, B. D., Ludlow, L. H., Diemer, M. A., Scott, R. P. J., Gottfried,
M., et al. (2003). Development of the conformity to masculine norms inventory.
Psychol. Men Masc. 4, 3–25. doi: 10.1037/1524-9220.4.1.3
Mahalik, J., Morray, E., Coonerty-Femiano, A., Ludlow, L., Slattery, S., and Smiler,
A. (2005). Development of the conformity to feminine norms inventory. Sex
Roles 52, 417–435. doi: 10.1007/s11199-005-3709-7
Martin, C., and Parker, S. (1995). Folk theories about sex and race differences. Pers.
Soc. Psychol. Bull. 21, 45–57. doi: 10.1177/0146167295211006
Martin, C., and Ruble, D. (2004). Children’s search for gender cues: cognitive
perspectives on gender development. Curr. Dir. Psychol. Sci. 13, 67–70. doi: 10.
1111/j.0963-7214.2004.00276.x
May, A. (2011). Experience-dependent structural plasticity in the adult human
brain. Trends Cogn. Sci. 15, 475–482. doi: 10.1016/j.tics.2011.08.002
McCabe, D., and Castel, A. (2008). Seeing is believing: the effect of brain images
on judgments of scientific reasoning. Cognition 107, 343–352. doi: 10.1016/j.
cognition.2007.07.017
McCarthy, M., and Arnold, A. (2011). Reframing sexual differentiation of the brain.
Nat. Neurosci. 14, 677–683. doi: 10.1038/nn.2834
Michael, R., Newman, E., Vuorre, M., Cumming, G., and Garry, M. (2013). On the
(non)persuasive power of a brain image. Psychon. Bull. Rev. 20, 720–725. doi: 10.
3758/s13423-013-0391-6
Miller, D. I., and Halpern, D. F. (2013). The new science of cognitive sex differences.
Trends Cogn. Sci. 18, 37–45. doi: 10.1016/j.tics.2013.10.011
Moè, A. (2009). Are males always better than females in mental rotation? Exploring
a gender belief explanation. Learn. Individ. Differ. 19, 21–27. doi: 10.1016/j.
lindif.2008.02.002
Moradi, B., and Parent, M. C. (2013). “Assessment of gender-related traits, atti-
tudes, roles, norms, identity and experiences,” in APA Handbook of Testing and
Assessment in Psychology, Vol. 2: Testing and Assessment in Clinical and Counseling
Psychology. APA Handbooks in Psychology, eds T. Morton, S. Haslam and M.
Hornsey (Washington, DC: American Psychological Association), 467–488.
Morton, T., Haslam, S., and Hornsey, M. (2009). Theorizing gender in the face of
social change: is there anything essential about essentialism? J. Pers. Soc. Psychol.
96, 653–664. doi: 10.1037/a0012966
Morton, T., Haslam, S., Postmes, T., and Ryan, M. (2006). We value what values
us: the appeal of identity-affirming science. Polit. Psychol. 27, 823–838. doi: 10.
1111/j.1467-9221.2006.00539.x
Muller, M., Marlowe, F., Bugumba, R., and Ellison, P. (2009). Testosterone and
paternal care in East African foragers and pastoralists. Proc. Biol. Sci. 276, 347–
354. doi: 10.1098/rspb.2008.1028
Nguyen, H., and Ryan, A. (2008). Does stereotype threat affect test performance
of minorities and women? A meta-analysis of experimental evidence. J. Appl.
Psychol. 93, 1314–1334. doi: 10.1037/a0012702
Nieuwenhuis, S., Forstmann, B. U., and Wagenmakers, E.-J. (2011). Erroneous
analyses of interactions in neuroscience: a problem of significance. Nat. Neu-
rosci. 14, 1105–1107. doi: 10.1038/nn.2886
Noble, K. G., Houston, S. M., Kan, E., and Sowell, E. R. (2012). Neural correlates
of socioeconomic status in the developing human brain. Dev. Sci. 15, 516–527.
doi: 10.1111/j.1467-7687.2012.01147.x
Oliveira, R. F. (2009). Social behavior in context: hormonal modulation of behav-
ioral plasticity and social competence. Integr. Comp. Biol. 49, 423–440. doi: 10.
1093/icb/icp055
Phoenix, C. H., Goy, R. W., Gerall, A. A., and Young, W. C. (1959). Organizing
action of prenatally administered testosterone propionate on the tissues medi-
ating mating behavior in the female guinea pig. Endocrinology 65, 369–382.
doi: 10.1210/endo-65-3-369
Poldrack, R. (2006). Can cognitive processes be inferred from neuroimaging data?
Trends Cogn. Sci. 10, 59–63. doi: 10.1016/j.tics.2005.12.004
Poldrack, R. (2008). The role of fMRI in cognitive neuroscience: where do we stand?
Curr. Opin. Neurobiol. 18, 223–227. doi: 10.1016/j.conb.2008.07.006
Poldrack, R. A., Fletcher, P. C., Henson, R. N., Worsley, K. J., Brett, M., and Nichols,
T. E. (2008). Guidelines for reporting an fMRI study. Neuroimage 40, 409–414.
doi: 10.1016/j.neuroimage.2007.11.048
Poline, J.-B., and Brett, M. (2012). The general linear model and fMRI: does love
last forever? Neuroimage 62, 871–880. doi: 10.1016/j.neuroimage.2012.01.133
Prentice, D., and Miller, D. (2006). Essentializing differences between women and
men. Psychol. Sci. 17, 129–135. doi: 10.1111/j.1467-9280.2006.01675.x
Reis, H. T., and Carothers, B. J. (2014). Black and white or shades of gray: are gender
differences categorical or dimensional? Curr. Dir. Psychol. Sci. 23, 19–26. doi: 10.
1177/0963721413504105
Romans, S., Clarkson, R., Einstein, G., Petrovic, M., and Stewart, D. (2012). Mood
and the menstrual cycle: a review of prospective data studies. Gend. Med. 9, 361–
384. doi: 10.1016/j.genm.2012.07.003
Rothbart, M., and Taylor, M. (1992). “Category labels and social reality: do we view
social categories as natural kinds?,” in Language, Interaction and Social Cognition,
eds G. R. Semin and K. Fiedler (Thousand Oaks, CA: Sage Publications, Inc.),
11–36.
Frontiers in Human Neuroscience www.frontiersin.org August 2014 | Volume 8 | Article 650 |
153

Rippon et al. Issues in functional neuroimaging sex/gender research
Roy, D. (2012). Neuroethics, gender and the response to difference. Neuroethics 5,
217–230. doi: 10.1007/s12152-011-9130-8
Ruigrok, A. N. V., Salimi-Khorshidi, G., Lai, M.-C., Baron-Cohen, S., Lombardo,
M. V., Tait, R. J., et al. (2014). A meta-analysis of sex differences in human brain
structure. Neurosci. Biobehav. Rev. 39, 34–50. doi: 10.1016/j.neubiorev.2013.
12.004
Sacher, J., Neumann, J., Okon-Singer, H., Gotowiec, S., and Villringer, A. (2013).
Sexual dimorphism in the human brain: evidence from neuroimaging. Magn.
Reson. Imaging 31, 366–375. doi: 10.1016/j.mri.2012.06.007
Schmitz, S. (2002). “Hirnforschung und Geschlecht: eine kritische Analyse
imRahmen der Genderforschung in den Naturwissenschaften,” in Gender Stud-
ies: Denkachsen und Perspektiven der Geschlechterforschung, eds I. Bauer and J.
Neissl (Innsbruck-Wien-München: Studien_Verlag), 109–125.
Schmitz, S. (2012). The neurotechnological cerebral subject: persistence of implict
and explicit gender norms in a network of changes. Neuroethics 5, 261–274.
doi: 10.1007/s12152-011-9129-1
Schmitz, S., and Höppner, G. (2014). Neurofeminism and feminist neurosciences:
a critical review of contemporary brain research. Front. Hum. Neurosci. 8:546.
doi: 10.3389/fnhum.2014.00546
Schwartz, D., Romans, S., Meiyappan, S., De Souza, M., and Einstein, G. (2012).
The role of ovarian steriod hormones in mood. Horm. Behav. 62, 448–454.
doi: 10.1016/j.yhbeh.2012.08.001
Shaywitz, B., Shaywitz, S., Pugh, K., Constable, R., Skudlarski, P., Fulbright, R., et al.
(1995). Sex differences in the functional organization of the brain for language.
Nature 373, 607–609. doi: 10.1038/373607a0
Shields, S. A. (2008). Gender: an intersectionality perspective. Sex Roles 59, 301–
311. doi: 10.1007/s11199-008-9501-8
Simmons, J., Nelson, L., and Simonsohn, U. (2011). False-positive psychology:
undisclosed flexibility in data collection and analysis allows presenting any-
thing as significant. Psychol. Sci. 22, 1359–1366. doi: 10.1177/09567976114
17632
Smiler, A. P., and Epstein, M. (2010). “Measuring gender: options and issues,”
in Handbook of Gender Research in Psychology, eds J. C. Chrisler and D. R.
McCreary (New York, Dordrecht, Heidelberg, London: Springer), 133–157.
Sommer, I., Aleman, A., Bouma, A., and Kahn, R. (2004). Do women really have
more bilateral language representation than men? A meta-analysis of functional
imaging studies. Brain 127, 1845–1852. doi: 10.1093/brain/awh207
Sommer, I., Aleman, A., Somers, M., Boks, M. P., and Kahn, R. S. (2008). Sex
differences in handedness, asymmetry of the Planum Temporale and functional
language lateralization. Brain Res. 1206, 76–88. doi: 10.1016/j.brainres.2008.
01.003
Spence, J. T. (1993). Gender-related traits and gender ideology: evidence for a
multifactorial theory. J. Pers. Soc. Psychol. 64, 624–635. doi: 10.1037/0022-3514.
64.6.905
Spence, J. T., and Helmreich, R. L. (1978). Masculinity and Femininity: Their
Psychological Dimensions, Correlates and Antecedents. Austin: University of Texas
Press.
Springer, K., Stellman, J., and Jordan-Young, R. (2012). Beyond a catalogue of
differences: a theoretical frame and good practice guidelines for researching
sex/gender in human health. Soc. Sci. Med. 74, 1817–1824. doi: 10.1016/j.
socscimed.2011.05.033
Stein, M., Federspiel, A., Koenig, T., Wirth, M., Strik, W., Wiest, R., et al. (2012).
Structural plasticity in the language system related to increased second language
proficiency. Cortex 48, 458–465. doi: 10.1016/j.cortex.2010.10.007
Stewart-Williams, S., and Thomas, A. G. (2013). The Ape that thought it was
a peacock: does evolutionary psychology exaggerate human sex differences?
Psychol. Inq. 24, 137–168. doi: 10.1080/1047840x.2013.804899
Stoet, G., and Geary, D. C. (2012). Can stereotype threat explain the gender gap
in mathematics performance and achievement? Rev. Gen. Psychol. 16, 93–102.
doi: 10.1037/a0026617
Terman, L. M., and Miles, C. C. (1936). Sex and Personality. New Haven, CT: Yale
University Press.
Thoman, D., White, P., Yamawaki, N., and Koishi, H. (2008). Variations of gender-
math stereotype content affect women’s vulnerability to stereotype threat. Sex
Roles 58, 702–712. doi: 10.1007/s11199-008-9390-x
Tobin, D. D., Menon, M., Menon, M., Spatta, B. C., Hodges, E. V. E., and Perry,
D. G. (2010). The intrapsychics of gender: a model of self-socialization. Psychol.
Rev. 117, 601–622. doi: 10.1037/a0018936
Tomasi, D., and Volkow, N. D. (2012). Gender differences in brain functional
connectivity density. Hum. Brain Mapp. 33, 849–860. doi: 10.1002/hbm.21252
Twenge, J. (1997). Changes in masculine and feminine traits over time: a meta-
analysis. Sex Roles 36, 305–325. doi: 10.1007/bf02766650
Twenge, J. M. (2001). Changes in women’s assertiveness in response to status and
roles: a cross-temporal meta-analysis, 1931–1993. J. Pers. Soc. Psychol. 81, 133–
145. doi: 10.1037/0022-3514.81.1.133
van Anders, S. M. (2013). Beyond masculinity: testosterone, gender/sex and human
social behavior in a comparative context. Front. Neuroendocrinol. 34, 198–210.
doi: 10.1016/j.yfrne.2013.07.001
van Anders, S., and Watson, N. (2006). Social neuroendocrinology: effects of social
contexts and behaviors on sex steroids in humans. Hum. Nat. 17, 212–237.
doi: 10.1007/s12110-006-1018-7
Van de Bos, R., Homberg, J., and de Visser, L. (2013). A critical review of sex
differences in decision-making tasks: focus on the Iowa Gambling Task. Behav.
Brain Res. 238, 95–108. doi: 10.1016/j.bbr.2012.10.002
Wagenmakers, E. J., Wetzels, R., Borsboom, D., and van der Maas, H. L. (2011).
Why psychologists must change the way they analyze their data: the case of
psi: comment on Bem (2011). J. Pers. Soc. Psychol. 100, 426–432. doi: 10.
1037/a0022790
Walton, G., and Spencer, S. (2009). Latent ability: grades and test scores system-
atically underestimate the intellectual ability of negatively stereotyped students.
Psychol. Sci. 20, 1132–1139. doi: 10.1111/j.1467-9280.2009.02417.x
Weisberg, D., Keil, F., Goodstein, J., Rawson, E., and Gray, J. (2008). The seductive
allure of neuroscience explanations. J. Cogn. Neurosci. 20, 470–477. doi: 10.
1162/jocn.2008.20.3.470
Winkler, A., Ridgway, G. R., Webster, M., Smith, S., and Nichols, T. E. (2014).
Permutation inference for the general linear model. Neuroimage 92, 381–397.
doi: 10.1016/j.neuroimage.2014.01.060
Witelson, S. F. (1991). Neural sexual mosaicism: sexual differentiation of the human
temporo-parietal region for functional asymmetry. Psychoneuroendocrinology
16, 131–153. doi: 10.1016/0306-4530(91)90075-5
Wood, W., and Carden, L. (in press). Elusiveness of menstrual cycle effects on mate
preferences: comment on gildersleeve, haselton and fales (2014). Psychol. Bull.
Wood, W., and Eagly, A. (2013). Biosocial construction of sex differences and
similarities in behavior. Adv. Exp. Soc. Psychol. 46, 55–123. doi: 10.1016/B978-
0-12-394281-4.00002-7
Wood, W., Kressel, L., Joshi, P. D., and Louie, B. (2014). Meta-Analysis of menstrual
cycle effects on women’s mate preferences. Emot. Rev. 6, 229–249. doi: 10.1177/
1754073914523073
Wraga, M., Helt, M., Jacobs, E., and Sullivan, K. (2006). Neural basis of stereotype-
induced shifts in women’s mental rotation performance. Soc. Cogn. Affect.
Neurosci. 2, 12–19. doi: 10.1093/scan/nsl041
Yong, E. (2012). In the wake of high profile controversies, psychologists are facing
up to problems with replication. Nature 485, 298–300. doi: 10.1038/485298a
Conflict of Interest Statement: The authors declare that the research was conducted
in the absence of any commercial or financial relationships that could be construed
as a potential conflict of interest.
Received: 30 April 2014; accepted: 04 August 2014; published online: 28 August 2014.
Citation: Rippon G, Jordan-Young R, Kaiser A and Fine C (2014) Recommen-
dations for sex/gender neuroimaging research: key principles and implications
for research design, analysis, and interpretation. Front. Hum. Neurosci. 8:650.
doi: 10.3389/fnhum.2014.00650
This article was submitted to the journal Frontiers in Human Neuroscience.
Copyright © 2014 Rippon, Jordan-Young, Kaiser and Fine. This is an open-access
article distributed under the terms of the Creative Commons Attribution License (CC
BY). The use, distribution or reproduction in other forums is permitted, provided the
original author(s) or licensor are credited and that the original publication in this
journal is cited, in accordance with accepted academic practice. No use, distribution
or reproduction is permitted which does not comply with these terms.
Frontiers in Human Neuroscience www.frontiersin.org August 2014 | Volume 8 | Article 650 |
154

OPINION ARTICLE
published: 20 June 2014
doi: 10.3389/fnhum.2014.00452
Using evolutionary theory to enhance the brain imaging
paradigm
Gad Saad
*
and Gil Greengross
Marketing Department, John Molson School of Business, Concordia University, Montreal, QC, Canada
*Correspondence: gadsaad@jmsb.concordia.ca
Edited by:
Nick Lee, Loughborough University, UK
Reviewed by:
Carl Senior, Aston University, UK
Keywords: neuroimaging, evolutionary psychology, illusion of explanatory depth, scientific method, ecological validity, domain-specific modules,
proximate vs. ultimate
In recent years, there seems to be no
preference, choice, emotion, thought, or
behavior that has escaped the scrutiny
of a neuroimaging machine. Scanning
the brain allegedly reveals insights into
the foundations of morality (Greene
et al., 2001), altruism (Tankersley et al.,
2007), sense of humor (Bartolo et al.,
2006) and even religious beliefs and God
(Kapogiannis et al., 2009), to name just a
few of the disparate topics that have been
studied. As neuroimaging studies become
increasingly popular, a growing number
of researchers in the business disciplines
are applying such techniques within their
areas of interest. In such works, researchers
look at and map the parts of the brain that
are involved in processing decisions, pref-
erences, and choices. Studies range from
predicting future sales of popular songs
based on how cer tain areas in the brain
were activated on a sample of individuals
prior to a song’s release (Berns and Moore,
2012), how advertisements using v arious
forms of persuasion engage different parts
of the brain (Cook et al., 2011), and how
arbitrary prices of wine alter the reward
activities in an area of the brain associated
with pleasure (Plassmann et al., 2008).
The modus operandi of most imaging
procedures, such as fMRI, is to track blood
oxygenation in the brain with the under-
lying assumption that as blood flows to
a region, the more neurons are activated
in this area. The idea behind such stud-
ies is not only to locate the exact area in
the brain where information is processed,
butalsotohaveinsightsintopeople’strue
thoughts and preferences, since individu-
als cannot control their brain activity and
are not always consciously aware of their
thought processes. There is a prevailing
view that by looking at individuals’ brain
activation patterns, we could unveil their
latent desires. Ariely and Berns (2010) dis-
cuss this premise skeptically, specifically
in the marketing discipline, where there
is a nagging fear that by looking at peo-
ple’s brains, marketers would be able to
predict individuals’ penchants for certain
products, future acquisitions and needs,
and hence manipulate customers to take
advantage of those desires.
This fear is probably unwarranted and
stems from what Rozenblit and Keil (2002)
describe as “the illusion of explanatory
depth,” namely to exhibit overconfidence
in one’s ability to offer veridical expla-
nations about natural phenomena when
one’s true knowledge is tentative at best.
Neuroimaging scholars are especially sus-
ceptible to such biases. The striking
colorful brain photos and associated tech-
nical jargon have a persuasive effect on
researchers and lay person alike (McCabe
and Castel, 2008; Trout, 2008; Weisberg
et al., 2008), but this should not blind us to
some of the shortcomings of the paradigm
including the likelihood of reporting spu-
rious correlations (Vul et al., 2009)and
false positives such as the infamous case of
the neuronal activation patterns “found”
in a dead Atlantic salmon (Bennett et al.,
2010).Nextwedetailsomeoftheproblems
in neuroimaging research that need to be
taken into account, and offer a theoretical
framework that might be helpful in better
interpreting the reaped results.
There are several practical prob-
lems associated with the neuroimaging
paradigm. Imaging studies are typically
conducted in artificial settings where
subjects are physically constrained within
a narrow and claustrophobic device which
may lead to a selection bias. The contrived
laboratory environments lack ecological
validity and as such it is unclear whether
the neuronal activation patterns would
be the same were participants making
real and consequential choices. To make
an actual moral choice in real life dif-
fers from having to imagine making a
hypothetical one whilst lying down in a
machine. Brain scans are also quite costly
and thus sample sizes are typically quite
small, yielding low statistical power, a
possible overestimation of effects sizes,
or the failure to detect true effects when
they indeed exist (Button et al., 2013).
Underpowered studies are hard to replicate
and they often lead to selection biases in
published results. Such studies can either
report bogus results or can lead to the file
drawer effect (e.g., unpublished positive
resultsthatdidnotreachsignificantlevels
due to small samples). These problems
are relatively easy to fix with more rigor-
ous study designs that include adequate
sample sizes and transparency regarding
power calculations.
A more fundamental problem in neu-
roimaging studies is the inability to iden-
tify the exact area in the brain responsible
for a given cognitive process. The brain,
which consumes roughly 20% of all energy
in our body, is responsible for monitor-
ing and managing every human activity,
and is built in a complex network where
different modules work simultaneously for
almost any task (see Pinker, 1997). At
any moment, multiple areas are activated
concurrently, and it is not easy to pin-
point the one region that is responsible
Frontiers in Human Neuroscience www.frontiersin.org June 2014 | Volume 8 | Article 452
|
HUMAN NEUROSCIENCE
155

Saad and Greengross Brain imaging
for a certain thought or desire, if one such
place even exists. Neuroimaging studies
are adept at illuminating areas in the brain
that are associated with certain behaviors,
thoughts, or preferences, but interpreting
which functions these areas serve based on
the images is difficult and typically can-
not be derived directly from such images.
Moreover, highlighted areas in the brain
do not exclude the possibility that other
parts of it are also involved, as these parts
may already be activated but not show
additional activity with the new task (Lee
et al., 2012). That said, recent studies have
documented the ability to classify mental
states, namely to accurately map a men-
tal task with a particular activation pattern
(Poldrack et al., 2009).
Locating a neuronal activation pattern
in the brain tells us little about the under-
lying causes that led to the cortical activ-
ity in question. To better understand the
causal mechanisms that lead individuals
to act the way they do, we need a meta-
theory one that has the power to explain
the ultimate causes of behaviors and pref-
erences and not just help “locate” them in
the brain. Evolution is the only scientific
theory that could explain the underlying
ultimate causes of behaviors and prefer-
ences, and the forces that shaped them
via natural and sexual selection processes.
The ultimate goal of every organism is to
survive and reproduce and thus, inquiries
into the functionality of the human brain
require the evolutionary lens. That said,
the great majority of neuroimaging studies
fall within the proximate realm (address
how and what factors), and as such they
seldom seek to elucidate the Darwinian
genesis of neuronal processes (ultimate
causation). It is one thing to detail where
in the brain emotions such as fear, love,
or anger “reside,” but another epistemo-
logical lens is needed to understand why
humans possess the ability to fear or
to love, under what circumstances these
emotions are activated, and which evo-
lutionary purpose they serve in terms
of an individual’s survival and reproduc-
tion outlooks. It is crucial to differentiate
between how cognitive processes mani-
fest themselves in the br ain at the neural
level and the evolutionary pressures lead-
ing to the existence of such str uctures. The
identification of neural activities is impor-
tant and can shed some light on their
purpose, but without recognizing specific
evolutionary mechanisms such as natural,
sexual, and kin selection, we cannot fully
inferwhytheycametobeinthefirstplace
(see Senior et al., 2011).
A first step toward Darwinizing the
brain imaging paradigm would be to make
greater use of evolutionarily meaning-
ful stimuli and tasks (photos of a juicy
burger or a sexy prospective mate) instead
of largely relying on abstract domain-
general stimuli and tasks (playing chess or
choosing b etween probabilistic gambles).
Moreover, using an evolutionary frame-
work can help generate context-specific
stimuli that are differentially relevant to
various demographic groups. For exam-
ple, if we wish to examine how sexual
arousal is expressed in the brain, know-
ing the evolutionary roots of sexual fan-
tasies and how men and women differ
in their responses to visual stimuli (Ellis
and Symons, 1990) can help in devis-
ing experimental tasks that would pro-
duce sex-specific arousal (e.g., explicit
vs. non-explicit photos). More gener-
ally, evolutionary thinking can contribute
to neuroimaging research by invoking
domain-specific processes that map onto
key basal Darwinian modules including
survival, mating, kin selection, and reci-
procity (Platek et al., 2007; Saad, 2007,
2011).
The examination of the four Darwinian
modules has yielded new insights when
applied to neuroimaging research. In a
study pertaining to the survival mod-
ule, the mere exposure to pictures of
highly caloric food produced brain acti-
vation in areas associated with taste and
rewards, similar to ones that are trig-
gered in response to real food (Simmons
et al., 2005). Of relevance to the mat-
ing module, researchers found that when
faces of attractive women are presented
to men, these activate reward systems in
the brain that had previously been iden-
tified as responsible for other powerful
rewards such as drugs and money (Aharon
et al., 2001). Using kin selection principles,
Platek and Kemp (2009) showed how dif-
ferent parts of the medial substrates in the
brain are activated in response to faces of
kin, non-kin friends, and strangers. This
makes evolutionary sense since facial cat-
egorization and the ability to distinguish
between kin and non-kin have important
consequences for survival (differentiating
a friend from a foe) and reproduction
(avoiding incest with a family member).
More generally, the ability to recognize
human faces is itself adaptive. Using an
evolutionary perspective, researchers have
shown that the medial frontal cortex was
much more activated w hen making a deci-
sion about whether to trust another per-
son, but not when interacting with an
avatar (Riedl et al., 2014). Lastly, various
works have explored neural processes asso-
ciated with the reciprocity module includ-
ing identifying specific areas in the brain
that are activated during moral dilem-
mas that require cooperation (Singer et al.,
2004) and detecting cheaters (Stone et al.,
2002).
Ultimately, the exploration of evolved
domain-specific modules (rather than
domain-general cognitive processes) via
the use of ecologically relevant stimuli and
tasks will yield a consilient brain atlas.
Furthermore, it will likely reduce the “fish-
ing expedition for statistical significance”
feel of many neuroimaging studies, by
permitting for more ecologically relevant
study designs and by facilitating the posit-
ing of a priori hypotheses.
Given the apparent methodolog i-
cal sophistication of the brain imaging
paradigm, neuroscientists are particularly
prone to what the Darwinian philoso-
pher Daniel Dennett referred to as “greedy
reductionism” (Dennett, 1995). Endless
studies are conducted void of any organiz-
ing theory or guiding a priori hypotheses.
Rather, the sophisticated methodology
drives the epistemological engine. In a sur-
vey of 50 neuroimaging studies only 42%
(21 papers) included apriorihypothe-
ses (Garcia and Saad, 2008). Of these, 15
were evolutionary based and 6 were non-
evolutionary based. Most striking is the
fact that only 17 of the 50 papers took an
evolutionary approach in the first place,
meaning that 88.2% of the evolution-
ary papers posited apriorihy potheses,
where only 18.2% of the non-evolutionary
papers used such hypotheses. In other
words, an evolutionary framework is
much more likely to generate apri-
ori hypotheses that can be tested using
imaging devices, where non-evolutionary
approaches produce many more ad-hoc
and post-hoc explanations. Thus, a par-
simonious and integrative framework
Frontiers in Human Neuroscience www.frontiersin.org June 2014 | Volume 8 | Article 452
|
156

Saad and Greengross Brain imaging
such as evolutionary theory serves as a
safeguard of the scientific method.
Whilesomehavedescribedtheneu-
roimaging paradigm as the new phrenol-
ogy (Uttal, 2001), we do not share such a
pessimistic outlook. Neuroscience is still a
nascent and rapidly developing field, and
some of the criticism is overstated (Farah,
2014). Recently, the United States and the
European Union announced two ambi-
tious projects: the BRAIN Initiative and
the Human Brain Project. Key objectives
include mapping the brain as well as creat-
ing a full simulation of it, which could not
only help us in better understanding the
human mind but also could help in com-
batting various brain and mental illnesses.
Similar to previously innovative technolo-
gies such as the telescope and the micro-
scope, brain imaging machines are merely
tools that need to be used within a specific
meta-theory. The evolutionary framework
could provide a good starting point as
an overarching theory to better organize
and fully understand the ultimate mecha-
nisms that drive our behaviors, emotions,
and thoughts, as seen in such lively brain
images.
REFERENCES
Aharon,I.,Etcoff,N.,Ariely,D.,Chabris,C.F.,
O’Connor, E., and Breiter, H. C. (2001). Beautiful
faces have variable reward value: fMRI and
behavioral evidence. Neuron 32, 537–551. doi:
10.1016/S0896-6273(01)00491-3
Ariely, D., and Berns, G. S. (2010). Neuromarketing:
the hope and hype of neuroimaging in busi-
ness. Nat. Rev. Neurosci. 11, 284–292. doi:
10.1038/nrn2795
Bartolo, A., Benuzzi, F., Nocetti, L., Baraldi, P., and
Nichelli, P. (2006). Humor comprehension and
appreciation: an fMRI Study. J. Cogn. Neurosci. 18,
1789–1798. doi: 10.1162/jocn.2006.18.11.1789
Bennett,C.M.,Baird,A.A.,Miller,M.B.,and
Wolford, G. L. (2010). Neural correlates of inter-
species perspective taking in the post-mortem
Atlantic salmon: an argument for proper mul-
tiple comparisons correction. J. Serendipitous
Unexpect. Results 1, 1–5. doi: 10.1016/S1053-8119
(09)71202-9
Berns, G. S., and Moore, S. E. (2012). A neural predic-
tor of cultural popularity. J. Consum. Psychol. 22,
154–160. doi: 10.1016/j.jcps.2011.05.001
Button, K. S., Ioannidis, J. P. A., Mokrysz, C., Nosek,
B. A., Flint, J., Robinson, E. S. J., et al. (2013).
Power failure: why small sample size undermines
the reliability of neuroscience. Nat. Rev. Neurosci.
14, 365–376. doi: 10.1038/nrn3475
Cook,I.A.,Warren,C.,Pajot,S.K.,Schairer,D.,and
Leuchter, A. F. (2011). Regional brain activation
with advertising images. J. Neurosci. Psychol. Econ.
4, 147–160. doi: 10.1037/a0024809
Dennett, D. C. (1995). Darwin’s Dangerous Idea:
Evolution and the Meanings of Life.NewYork,NY:
Simon and Schuster.
Ellis, B. J., and Symons, D. (1990). Sex differ-
ences in sexual fantasy: an evolutionary psycho-
logical approach. J. Sex Res. 27, 527–555. doi:
10.1080/00224499009551579
Farah, M. J. (2014). Brain images, babies, and bathwa-
ter: critiquing critiques of functional neuroimag-
ing. Hastings Cent. Rep. 44, S19–S30. doi: 10.1002/
hast.295
Garcia, J. R., and Saad, G. (2008). Evolutionary
neuromarketing: darwinizing the neuroimaging
paradigm for consumer behavior. J. Consum.
Behav. 7, 397–414. doi: 10.1002/cb.259
Greene, J. D., Sommerville, R. B., Nystrom, L. E.,
Darley, J. M., and Cohen, J. D. (2001). An
fMRI investigation of emotional engagement in
moral judgment. Scie nce 293, 2105–2108. doi:
10.1126/science.1062872
Kapogiannis, D., Barbey, A. K., Su, M., Zamboni,
G., Krueger, F., and Grafman, J. (2009). Cognitive
and neural foundations of religious belief. Proc.
Natl. Acad Sci. U.S.A. 106, 4876–4881. doi:
10.1073/pnas.0811717106
Lee, N., Senior, C., and Butler, M. J. R. (2012). The
domain of organizational cognitive neuroscience:
theoretical and empirical challenges. J. Manage. 38,
921–931. doi: 10.1177/0149206312439471
McCabe, D. P., and Castel, A. D. (2008). Seeing is
believing: the effect of brain images on judgments
of scientific reasoning. Cognition 107, 343–352.
doi: 10.1016/j.cognition.2007.07.017
Pinker, S. (1997). How the Mind Works.NewYork,NY:
W. W. Norton and Company, Inc.
Plassmann, H., O’Doherty, J., Shiv, B., and Rangel,
A. (2008). Marketing actions can modulate neu-
ral representations of experienced pleasantness.
Proc. Natl. Acad. Sci. U.S.A. 105, 1050–1054. doi:
10.1073/pnas.0706929105
Platek, S. M., Keenan, J. P., and Shackelford, T. K.
(eds.). (2007). Evolutionary Cognitive Neuroscience.
Cambridge, MA: MIT Press.
Platek, S. M., and Kemp, S. M. (2009). Is family
special to the brain? An event-related fMRI
study of familiar, familial, and self-face recog-
nition. Neuropsychologia 47, 849–858. doi:
10.1016/j.neuropsychologia.2008.12.027
Poldrack, R. A., Halchenko, Y. O., and Hanson,
S. J. (2009). Decoding the large-scale structure
of brain function by classifying mental states
across individuals. Psychol. Sci. 20, 1364–1372. doi:
10.1111/j.1467-9280.2009.02460.x
Riedl, R., Mohr, P. N. C., Kenning, P. H., Davis, F.
D., and Heekeren, H. R. (2014). Trusting humans
and avatars: a brain imaging study based on evo-
lution theory. J. Manage. Inf. Syst. 30, 83–114. doi:
10.2753/MIS0742-1222300404
Rozenblit, L., and Keil, F. (2002). The misun-
derstood limits of folk science: an illusion of
explanatory depth. Cogn. Sci. 26, 521–562. doi:
10.1207/s15516709cog2605_1
Saad, G. (2007). The Evolutionary Bases of
Consumption. Mahwah, NJ: Lawrence Erlbaum.
Saad, G. (2011). The Consuming Instinct: What
Juicy Burgers, Ferraris, Pornography, and Gift
Giving Reveal About Human Nature.Amherst,NY:
Prometheus Books.
Senior, C., Lee, N., and Butler, M. (2011).
PERSPECTIVE—organizational cognitive neu-
roscience. Organ. Sci. 22, 804–815. doi: 10.1287/
orsc.1100.0532
Simmons, W. K., Martin, A., and Barsalou, L.
W. (2005). Pictures of appetizing foods acti-
vate gustatory cortices for taste and reward.
Cereb. Cortex 15, 1602–1608. doi: 10.1093/cercor/
bhi038
Singer, T., Kiebel, S. J., Winston, J. S., Dolan, R. J., and
Frith, C. D. (2004). Brain responses to the acquired
moralstatusoffaces.Neuron 41, 653–662. doi:
10.1016/S0896-6273(04)00014-5
Stone, V. E., Cosmides, L., Tooby, J., Kroll, N.,
and Knight, R. T. (2002). Selective impair-
ment of reasoning about social exchange in a
patient with bilateral limbic system damage. Proc.
Natl. Acad. Sci. U.S.A. 99, 11531–11536. doi:
10.1073/pnas.122352699
Tankersley, D., Stowe, C. J., and Huettel, S. A. (2007).
Altruism is associated with an increased neural
response to agency. Nat. Neurosci. 10, 50–51. doi:
10.1038/nn1833
Trout, J. D. (2008). Seduction without cause: uncover-
ing explanatory neurophilia. Trends Cogn. Sci. 12,
281–282. doi: 10.1016/j.tics.2008.05.004
Uttal, W. R. (2001). The New Phrenology: The Limits
of Localizing Cognit ive Processes in the Brain.
Cambridge: MA: The MIT Press.
Vul, E., Harris, C., Winkielman, P., and Pashler,
H. (2009). Puzzlingly high correlations in fMRI
studies of emotion, personality, and social cog-
nition. Perspect. Psychol. Sci. 4, 274–290. doi:
10.1111/j.1745-6924.2009.01125.x
Weisberg, D. S., Keil, F. C., Goodstein, J., Rawson,
E., and Gray, J. R. (2008). The seductive
allure of neuroscience explanations. J. Cogn.
Neurosci. 20, 470–477. doi: 10.1162/jocn.2008.
20040
Conflict of Interest Statement: The authors declare
that the research was conducted in the absence of any
commercial or financial relationships that could be
construed as a potential conflict of interest.
Received: 30 April 2014; accepted: 03 June 2014;
published online: 20 June 2014.
Citation: Saad G and Greengross G (2014) Using evolu-
tionary theory to enhance the brain imaging paradigm.
Front. Hum. Neurosci. 8:452. doi: 10.3389/fnhum.
2014.00452
This article was submitted to the journal Frontiers in
Human Neuroscience.
Copyright © 2014 Saad and Greengross. This is an
open-access article distributed under the terms of the
Creative Commons Attribution License (CC BY). The
use, distribution or reproduction in other forums is per-
mitted, provided the original author(s) or licensor are
credited and that the original publication in this journal
is cited, in accordance with accepted academic practice.
No use, distribution or reproduction is permitted which
does not comply with these terms.
Frontiers in Human Neuroscience www.frontiersin.org June 2014 | Volume 8 | Article 452
|
157

REVIEW ARTICLE
published: 25 February 2014
doi: 10.3389/fnhum.2014.00084
A sociogenomic perspective on neuroscience in
organizational behavior
Seth M. Spain
1
*
andP.D.Harms
2
1
School of Management, State University of New York at Binghamton, Binghamton, NY, USA
2
Department of Management, University of Nebraska - Lincoln, Lincoln, NE, USA
Edited by:
Carl Senior, Aston University, UK
Reviewed by:
Gene Robinson, University of
Illinois, USA
Michael E. Price, Brunel University,
UK
*Correspondence:
Seth M. Spain, School of
Management, State University of
New York at Binghamton, 312
Academic A, 4400 Vestal Parkway
East, PO Box 6000, Binghamton, NY
13902-6000, USA
e-mail: sspain@binghamton.edu
We critically examine the current biological models of individual organizational behavior,
with particular emphasis on the roles of genetics and the brain. We demonstrate how
approaches to biology in the organizational sciences assume that biological systems
are simultaneously causal and essentially static; that genotypes exert constant effects.
In contrast, we present a sociogenomic approach to organizational research, which
could provide a meta-theoretical framework for understanding organizational behavior.
Sociogenomics is an interactionist approach that derives power from its ability to explain
how genes and environment operate. The key insight is that both genes and the
environment operate by modifying gene expression. This leads to a conception of genetic
and environmental effects that is fundamentally dynamic, rather than the st atic view
of classical biometric approaches. We review biometric research within organizational
behavior, and contrast these interpretations with a sociogenomic view. We provide a
review of gene expression mechanisms that help explain the dynamism observed in
individual organizational behavior, particularly factors associated with gene expression
in the brain. Finally, we discuss the ethics of genomic and neuroscientific findings for
practicing managers and discuss whether it is possible to practically apply these findings
in management.
Keywords: behavioral genetics, epigenetics, leadership, personality, adult development, evolutionary psychology,
organizational behavior
It seems that we have a fascination with the brain. In The
psychopath inside, neuroscientist James Fallon describes his dis-
cover y that scans of his own brain showed patterns of activa-
tion indicating potential psychopathy (Fallon, 2013), e vocatively
described as similar to scans of convicted killers. Fallon describes
the neuroanatomical features associated with the constellation
of behavioral tendencies that make up psychopathy, includ-
ing impulsivity and lowered empathy, as well as their genetic
and epigenetic correlates. This description almost immediately
gives rise to questions of how determined a complex behavioral
phenomenon, such as psychopathy, is by its biological foun-
dations (see Stromberg, 2013, for a discussion of the book).
Psychopathy—the tendency to be impulsive, manipulative, anti-
social, and to lack fear and empathy (e.g., Hare, 1985, 1999)—is of
increasing interest in the organizational sciences (e.g., Spain et al.,
2014), because it can help explain phenomena such as supervisors
who behave in an abusive manner toward their subordinates (cf.,
Krasikova et al., 2013), managerial derailment, the phenomenon
of seemingly promising managers who become decidedly ineffec-
tive, usually due to interpersonal problems (Leslie and Van Velsor,
1996;cf.,Harms et al., 2011), and counterproductive work behav-
iors, or those times when employees engage in activities such as
stealing from the company, sabotage, or interpersonal aggression
at work (O’Boyle et al., 2011). If organizational scientists could
reliably identify psychopaths from objective indicators, such as
functional magnetic resonance imaging scans of their brains or
genetic tests, they may be able to design interventions that could
help remediate a great deal of suffering in work organizations.
It is, however, unlikely that we can make such identifications
reliably. The question posed above, how determined are com-
plex social behaviors by their biological foundations, remains. For
instance, consider the case of James Fallon above. He describes
himself as a “prosocial psychopath,” and attributes his relatively
benign, if competitive, behavior to growing up in a loving family
(Stromberg, 2013): he has psychopathy “in his genes,” but it is not
so clearly expressed in his behavior.
Additionally, there are many reasons why, even if we could
make such identifications, we would not want to use this in
the day-to-day practice of management. For instance, genetic
screening or br ain imaging could be expected to lead to a
form of “genetic discrimination.” Such discrimination may be
problematic for ethical reasons, and practically, as long as the
biological indicators measured are weakly predictive of behav-
ior. For instance, in the United States, the Genetic Information
Nondiscrimination Act of 2008 (GINA) Title II prevents employ-
ers (and some other non-employment agencies) from requiring
or requesting genetic information as a condition of employment
(www.genome.gov/10002077). In spite of such legislative barri-
ers to direct use of biological research in employment settings,
interest among organizational researchers remains high, as evi-
dencedbytheforthcomingbookeditedbyCollarelliandArvey,
The biological foundations of organizational B ehavior.
Frontiers in Human Neuroscience www.frontiersin.org February 2014 | Volume 8 | Article 84
|
HUMAN NEUROSCIENCE
158

Spain and Harms Sociogenomics in organizations
Arvey and colleagues (Arvey et al. (2014), Arvey and
Bouchard, 1994; Ilies et al., 2006) provide detailed summaries of
the research on behavioral genetics in organizational behavior.
Theearliestinvestigationsinbehavioralgeneticsinorganiza-
tional settings found that heritable, genetic factors accounted
for variation in behavioral characteristics related to leadership
(e.g., Johnson et al., 1998). More recent studies aim to exam-
ine mediators of the genetic effects, or environmental moderators
of these effects to examine how inherited factors play a role in
becoming a successful leader. We note that much of the organi-
zational research using behavioral genetics has been directed at
the question, “are leaders born or made,” that is, whether leader-
ship is substantially heritable or not. Therefore, our review will
be focused on leadership phenomena, but not exclusively about
them.
The “are leaders born or made” question is an example of
a very common question about genetics in the social sciences,
which is: what wins, nature or nurture? Unfortunately, this ques-
tion is effectively a straw man, b ecause human action is the result
of both nature and nurture (Ridley, 2003; Rutter, 2006)—one may
as well ask which contributes more to the area of a rectangle,
its length or its width (an analogy attributed to Donald Hebb in
many sources, including Meaney, 2004, p. 2). That is, variation in
almost every individual difference studied in psychology is par-
tially due to both genetic and environmental effects. This concept
has been codified in Turkheimer’s three laws of behavior genetics
(Turkheimer, 2000, p. 160):
1. All human behavior traits are heritable (genetic effect),
2. The effect of being raised in the same family (shared environ-
ment) is smaller than the effect of genes, and
3. A large percentage of the variation in human behavioral traits
is not accounted for by either genes or by shared environment
(unique environment),
which together show that genes and experience, especially an
individual’s unique experience, both play important roles in the
development of complex behavioral characteristics. By this logic,
leaders are both born and made. An additional important point is
that it is meaningless to take the slightly more nuanced position
of “if both are important, which is more important?” In the cur-
rent essay, we review the etiology of leadership through the lens of
sociogenomics. For these purposes, we consider leadership largely
at the level of the individual leader—the individual characteristics
and behaviors that allow that individual to emerge, b e accepted,
and be effective as a leader. However, each stage of this process
involves social interactions with other people. We therefore do
consider the influence that individuals have on one another. So,
while our perspective speaks most directly to behavioral and trait-
based approaches to leadership, the overarching perspective has
some bearing on interpersonal and dyadic perspectives, as well.
The sociogenomic framework articulates the mechanisms
through which genes and environments interact to help
shape observed behavioral characteristics. The promise of
sociogenomics lays in using the genome–the entirety of an organ-
isms’ hereditary characteristics–as the basis for understanding
behavior (Robinson, 2004; Robinson et al., 2005; Roberts and
Jackson, 2008), including leadership behavior. This paper argues
that such an approach has a great deal to offer to the study of lead-
ership, even for researchers that do not aspire to collect biological
data, because the theory has broad impact on basic research ques-
tions in leadership. We believe that a sociogenomic perspective
can serve as a meta-theoretical backdrop for leadership scholars
that could help to integrate many disparate finding s.
We contrast the sociogenomic view with three contemporary
perspectives on the biological substrate of leadership: 1. The exis-
tence of genetic effects indicates that leaders are “born,” not
made (e.g., Ilies et al., 2006; De Neve et al., 2012), 2. the pro-
portionally low variance in phenotypes (about 30%) accounted
for by genetic factors indicates that leaders are “made,” not born
(Avolio, 2005; Avolio et al., 2009),and3.aninteractionistper-
spective that acknowledges the mutual influence of genetic and
environmental factors (e.g., Arvey et al., 2007; Zhang et al.,
2009b). Researchers tend to focus on questions driven by the first
two positions. For instance, a researcher may be interested in
establishing how much of the observed variance in a leadership
characteristic—most of this research has focused on attaining
a leadership role—is attributable to genetic factors by estimat-
ing the heritability coefficient, h
2
(described below). Another
researcher may be concerned with showing that some early life
experience influences these same leadership characteristics. In
contrast, the sociogenomic approach embraces both of these
explanations simultaneously.
We also see something like sociogenomics as an effectively nec-
essary component of doing any biological research into human
social behavior in the post-genomic world (Charney, 2012). That
is, many of the assumptions that earlier work in behavioral genet-
ics has rested on have been called into question as a result of
findings since the mapping of the human genome in the early
part of this century. Most importantly, DNA is a dynamic entity
whose structure and function is altered throughout the life-course
by other entities such as retrotransposons (mobile DNA ele-
ments that “copy-and-paste” themselves into other sections of a
person’s DNA sequence; Charney, 2012) and copy number vari-
ations (deletion, insertion, and duplication mutations). Further,
DNA may not be the only heritable biological element—epigenetic
information (loosely speaking, information about how the cellu-
lar environment regulates the expression of DNA; we will describe
epigenetics in more detail below) may also be transgenerationally
heritable (Zhang and Meaney, 2010; Charney, 2012). Each of
these elements seems to be environmentally responsive, which
goes some way to explaining how the environment interacts with
thegenometoproducebehavior.
It is important to clarify from the outset how sociogenomics
differs from more traditional interactionist viewpoints; in fact, it
is not the case that sociogenomics is an interactionist approach.
It is, rather, a framework for understanding how gene ×
environment interactions operate; for explaining genetic and
environmental effects within a common language. That is,
sociogenomics subsumes interactionist approaches. We believe
that the sociogenomic perspective provides a broader view than
the basic interactionist perspective allows. Furthermore, the
sociogenomic model predicts that both factors, genes and envi-
ronmental experiences, work in the same way: by influencing
Frontiers in Human Neuroscience www.frontiersin.org February 2014 | Volume 8 | Article 84
|
159

Spain and Harms Sociogenomics in organizations
which genes code for proteins at a given moment in time.
That is, the sociogenomic approach adds value by explaining
that both genes and environments operate on the genome; they
both work by affecting gene expression ( Robinson, 2004). In the
example above, what distinguishes a sociogenomic explanation
from other interactionist perspectives is the understanding that
both the genetic factors and the early life experiences operate
on the genome; they modulate the expression of certain genes.
Sociogenomic explanations focus on how gene by environment
interactions work.
A sociogenomic model of leadership provides an integrative
framework for explaining the roles that genetics and environ-
mental factors play in leader behavior. We next provide a brief
overview of the methods used in behavioral genetics studies,
called biometric models. Then we review the behavioral genetics
literature on leadership, and interpret these findings in a standard
behavioral genetics way. We then explain how the sociogenomic
approach differs from a behavioral genetic approach. Finally, we
outline a series of proposals for innovative research in leader-
ship that are suggested by the sociogenomic model. We conclude
by examining ethical considerations for practicing managers. We
begin by discussing the roles of psychological and biological
explanation in the study of leadership and other organizational
behavior.
WEAK vs. STRONG BIOLOGISM
Materialism is a basic tenet in much of modern philosophy, and
certainly in the sciences (Dennett, 1991). That is, it should be
uncontroversial to describe any human behavioral phenomenon
as “biological” in the sense that our psychological selves are sit-
uated in our bodies, and therefore must run, like software does
on a particular piece of hardware, on our brains—our minds live
in our br ains. This is the position that Turkheimer (1998) called
weak biologism, and considered it essentially tautological, that this
position is a necessary consequence of the materialist point of
view. That is, since our behaviors occur through the workings of
all of our bodies’ biological (e.g., musculoskeletal, neurological)
systems, that there is some psychobiological association is unsur-
prising. Where there is interest is in the position Turkheimer
(1998) called strong biologism, that there is a strong association
between well-defined biological structures or processes and well-
defined human behaviors. That is, strong biologism provides the
necessary mechanisms to identify the etiology of a behavioral
syndrome.
The conflation of weak and strong biologism has led to much
of the confusion, difficulty, and acrimony in the nature-nurture
debate (Turkheimer, 1998). We believe that this is also the case in
discussions of biological underpinnings in organizational behav-
ior and leadership. For instance, in asking the question, “are
leaders born or are they made?” we are implicitly asking a strong
biological question—at least when the question is considered in a
genetic vs. environmental causation way. That is to say, this ques-
tion assumes that there is a specific biological etiology for the
behavioral syndromes of leadership, a reasonably simple mech-
anism or set of mechanisms or processes that is localized in the
brain, or there simply is not (the former position embodies the
conception of leaders being born, the latter, made).
In other words, if this proposition were true, it would be possi-
ble to s tudy leadership at the biological level of analysis, and such
study would scale directly to the behavioral level. With a phe-
nomenon as complex as leadership, this is unlikely to be the case.
Such questions are not answered by examining whether a phe-
notypic trait is heritable (Kempthorne, 1978; Turkheimer, 1998).
Estimated heritability is, however, the mainstay of our knowledge
of the biological foundations of complex behavioral phenom-
ena, including leadership and other characteristics of interest
in organizational behavior. We next review the basic models of
such biometric research, with the intent to make these models
completely accessible to non-specialists.
BIOMETRIC MODELING
In order to understand the literature that genetic research in lead-
ership is built on, it is necessary to understand biometr ic,or
behavioral genetic, models. T he standard model in behavioral
genetics is defined by the equation (e.g., Plomin et al., 2001):
P = A + C + E(1)
with the components of the equation estimated using a s am-
pleofidentical(monozygotic) and fraternal (dizygotic)twins.In
the equation, P is the phen otypic trait. Phenotype means that
the trait is observed or measured. Examples of phenotypic traits
are height, eye color, measured intelligence, or the occupation
of a leadership role. The A-term refers to the additive genetic
component. The C-term refers to common environment, factors
that are not genetics that make tw ins more alike. Typically, these
factors are considered related to family upbringing and com-
mon schooling or early life experiences shared between twins.
The E-term represents unique environment (confounded with
error), or the percentage of variance attributable to experiences
that are wholly unique to each individual, and other purely
idiosyncratic variance. This model is typically estimated using
samples of identical and fraternal twins, though adoption stud-
ies are sometimes used. Identical twins share roughly 100% of
their genetic material—copy number variations can differ across
identical twins, and random mutations can occur during devel-
opment, but for practical purposes, identical twins share 100%
of their genetic material, while fraternal twins are no more sim-
ilar genetically than any other siblings—sharing on average 50%
of their genetic material. Therefore identical twins have perfect
genetic correlations, whereas fraternal twins have genetic corre-
lations half as strong. Both types of twins have equally strong
common environmental effects, and the unique environmental
effect is specific to each individual. This model allows behav-
ioral genetics researchers to estimate the heritability coefficient,
h
2
, which is the population-level variance in the phenotypic
trait, P, that is associated with the variance in genetic mate-
rial (i.e., Kempthorne, 1978, p. 11): h
2
= Var(A)/Var(P). It is
extremely important to note that the h
2
coefficient is a popu-
lation statistic—it does not apply at the individual level, so it
should never be interpreted that an h
2
of 0.50 means that half
of an individual’s trait level is genetic. The statistic only indexes
the population’s proportion of phenotypic variance attributable
to genotypic variance.
Frontiers in Human Neuroscience www.frontiersin.org February 2014 | Volume 8 | Article 84
|
160

Spain and Harms Sociogenomics in organizations
BEHAVIORAL GENETICS IN ORGANIZATIONAL BEHAVIOR
AND LEADERSHIP
Several studies have investigated the her itability of leadership
styles and occupancy of leadership roles (such as supervisor
or manager). For instance, Johnson et al. (1998) examined
the heritability of self-reported scores on the Multidimensional
Leadership Questionnaire (MLQ; Bass and Avolio, 1991). They
found a heritability coefficient of 49% for transactional leadership
style, and a heritability coefficient of 59% for transformational
style. Again, these findings do not mean that half of any one
person’s score on tr ansformational or transactional leadership
is attributable to their specific genetic makeup. These findings
also do not imply heritability such that leadership is, “like father,
like son,” as heritability estimates do not ensure large correla-
tions across generations (Jackson et al., 2011). More importantly,
these findings absolutely do not suggest that leadership cannot
be taught, as heritability does not imply immutability. Instead,
these findings only imply that identical twins are more similar
on the transformational and transactional leadership scales than
fraternal twins due to inherited genetic factors.
Extending these findings within the same sample of twins,
Johnson et al. (2001) examined the genetic correlations between
transformational and transactional leadership styles, again mea-
sured with the MLQ, and the five factor model of personality
(Goldberg, 1993). Such a design allows the researcher to deter-
mine how much of the correlation between two measured vari-
ables is determined by shared genetic causes. For example, we
might estimate how much of the obser ved relationship between
the personality trait extraversion and transformational leader-
ship is a result of these two characteristics sharing common
genetic causes. These researchers found substantial genetic corre-
lations between transactional leadership and Conscientiousness,
Extraversion, and Agreeableness (−0.49, −0.46, and −0.23).
Similarly, transformational leadership was strongly genetically
correlated with Conscientiousness, Extraversion, and Openness
to Experience (0.58, 0.23, and 0.56). The pattern, but not the
strength, of relationships was the same for both phenotypic and
genotypic correlations.
Again, these correlations are at the genetic level, so it is
likely that transactional leadership shares some of its under-
lying genetic substrate with Conscientiousness, Extraversion,
and Agreeableness, while transformational leadership shares
genetic substrates with Conscientiousness, Extraversion, and
Openness. Specifically, based on this study, transformational
leadership appears to have genetic causes in common with
Conscientiousness, Extr aversion, and Openness. One possible
avenue for future research that these findings suggest is that any
physiological system that is implicated in one of these personal-
ity traits may be a candidate for study with leadership style. For
instance, the serotonin system has been implicated in self-control
or impulsivity (Carver et al., 2008), so it appears relevant to con-
scientiousness. Therefore, it is a reasonable neurological system
to study in relation to rated transformational and transactional
leadership.
In a study of leadership emergence, as defined by the attain-
ment of leadership roles such as supervisor or manager, Ilies et al.
(2004) meta-analytically estimated the percentage of variance in
leader emergence attributable to genetic factors, as mediated by
personality traits. The results of this meta-analysis provided 17%
as a lower-bound estimate of the heritability of leader emergence.
This meta-analysis also provided evidence that personality traits
mediate the influence of genes on leader emergence, such that
genes → personality → leader emergence, as causal structure
consistent with the “leaders are born” thesis (see Figure 2 and
related discussion below).
In a twin study, Arvey et al. (2006) found that 30% of the
variance in leadership role occupancy was explained by genetic
factors, with the rest explained by non-shared environmental
factors. Additionally, genetic factors accounted for substantial
amounts of v ariance in personality traits, though there was no
evidence that these personality traits mediated the genetic influ-
ence on leader role occupancy. In other words, both personality
traits and leader role occupancy had heritable components, but
there was no evidence in this study that the genetic effect on
leadership was mediated by personality.
Additional evidence was provided by Arvey et al. (2007),who
found that 32% of the variance in leader role occupancy was
attributable to genetic factors. This study also tested whether
developmental factors, specifically formal work experience and
family experience, accounted for variance in leader role occu-
pancy. These experiential variables both had significant zero-
order correlations with leader role occupancy, but when the
genetic factors were controlled for, only the work experiences
factor remained associated with leader role occupancy. In other
words, family experiences no longer count when genetics are con-
trolled for, but on-the-job work experiences still independently
contribute to leader role attainment.
None of these studies found that leadership, however defined,
is entirely explained by genetic factors, leaving a lot of room for
environmental factors as explanations. Still, leadership, however
defined, has been found to have substantial genetic component
with around 30–60% of the variance explained by genetic factors.
The fact that a sizable amount of variance is explained by genetic
factors is consistent with a “Leaders are born” approach. On the
other hand, around 40–60% of the variance in self-reported lead-
ership style and 70% of the variance in leader role occupancy was
not explained by genetic factors, consistent with a “leaders are
made” explanation. That work experiences contributed, indepen-
dently of genetic factors, to attaining a leadership role (explaining
17% of the variance in leader role occupancy; Arvey et al., 2007),
offers support for the “made” interpretation.
Additionally, Avolio et al. (2009) reported findings that after
controlling for genetic effects, there were still significant effects
on leader role occupancy for authoritative parenting and rule-
breaking behaviors in childhood. Further, Ilies et al. (2006)
reported the results of an unpublished study by Arvey et al. (2004)
that found experiencing leadership roles in high school moder-
ated the genetic effect on work leadership. These findings raise
the possibility that the heritability of work leadership may be
affected by environmental variables, in this particular case, ear-
lier investment in leadership roles (Avolio, 1994). In addition,
Zhang et al. (2009b) found in a sample of male twins that growi ng
up in an enriched environment (as indicated by family socioeco-
nomic status, perceived parental support, and reported conflict
Frontiers in Human Neuroscience www.frontiersin.org February 2014 | Volume 8 | Article 84
|
161

Spain and Harms Sociogenomics in organizations
with parents) significantly moderated the heritability of leader
role occupancy. Specifically, higher levels of enrichment were
associated with lower heritability estimates.
The previous finding is very similar to the evidence that the
heritability of cognitive ability is moderated by socioeconomic
status (Turkheimer et al., 2003). Specifically, at low levels of SES,
60% of the variance in measured cognitive ability is attributable
to shared environment, with almost no genetic component. At
high levels of SES, the results are almost exactly the reverse,
with the genetic component taking over. Taking these finding s
together appears to show that the enrichment of the environ-
ment that a person grows up in is an important moderator of
genetic effects on a wide range of variables, including leadership
style.
This latter set of findings demonstrates that, while there is a
genetic component to leadership, the environment clearly has a
role to play. So, the simple question of whether leaders are born
or made has a very simple answer: Yes, leaders are both born
and made. The question now shifts; was Avolio (2005) correct
in emphasizing made over born in leadership development? We
address this more nuanced question by examining traditional
biological models of traits with a sociogenomic approach, and
considering the implications of each viewpoint on the evidence
thus far.
A SOCIOGENOMIC PERSPECTIVE
Recent advances in biology show that the “born, not made” view-
point cannot be entirely correct (e.g., Robinson, 2004; Robinson
et al., 2005; Roberts and Jackson, 2008), for any behavioral
domain.Thatis,“Whenitcomestobehavior,wehavemoved
beyond genetic determinism. Our genes do not lock us into cer-
tain ways of acting; rather, genetic influences complicated and
mutable and are only one of many factors affecting behavior,”
(Jasny et al., 2008). The perspective we call sociogenomic rests
on two main findings and one fundamental assumption. The
assumption is taken from a sociobiological perspective of evo-
lution (e.g., Wilson, 1975), that genes and evolutionary forces
influence behavior. This is necessarily true for any heritable
behavior with implications for survival or reproductive success,
even a given effect is small (Penke et al., 2007). This applies to
animals that live in social groups with cooperation and com-
petition as necessary ingredients for survival and success, such
as human beings. Leadership, in particular, may be an impor-
tant evolutionary context (Van Vugt, 2006; Van Vugt et al.,
2008).
For instance, consider leadership as an example of social rank.
Rank in social hierarchies is very important to social function-
ing in several primate species. For instance, young adult male
chimpanzees spend tremendous amounts of time and effort in
attempts to ascend the social ladder to attain alpha male sta-
tus (Wrangham and Peterson, 1998) and low rank in the social
hierarchy has severe negative implications for stress and health
in savannah baboons (Sapolsky, 2001, 2005). Such studies pro-
vide a useful context for considering leadership behavior. Our
distant primate cousins may shed light on aspects of social behav-
ior, stripped of human cultural context, that are shrouded in
complexity for humans. Such comparative approaches may aid
us in understanding the origins and functions of leadership in
our evolutionary past. Similar, though non-identical, evolution-
arypressuresarelikelytohaveshapedsuchbehaviorsinthe
great apes.
Such observations about social rank in primate species become
important when we consider the first finding of importance to
the sociogenomic approach—that the genome is highly con-
served across species. Because of this, we can learn a great deal
about human behavior from animal models, a point we return
to shortly. There has already been some effort along these lines
in personality psychology (e.g., Gosling, 2001, 2008; King et al.,
2005; Mehta and Gosling, 2006 ). We believe that a great deal can
be learned regarding human leadership and influence processes
by examining these processes in other species, and some com-
pelling work has already been done (e.g., de Waal, 2000; Arvey
et al., 2014). Furthermore, animal models can provide extraordi-
nary isolation of variables. By studying leadership in chimpanzees
we can see the political process st ripped of the artifacts of human
cultures and language.
Sociogenomics provides a deep reason for examining behavior
comparatively: due to the conservation of the genome, behav-
ior syndromes in multiple species probably share genetic deter-
minants and molecular pathways (e.g., Donaldson and Young,
2008). Work that might not be possible with human subjects may
be possible using animal models. That is, using current technol-
ogy, barring post-mortem autopsies, it is not possible to examine
gene expression levels in the human brain, but the relevant molec-
ular pathways may be examined in surrogate animals, such as r ats
and mice.
The second finding is even more relevant in comparison to
other contemporary models of the genetic determinants of behav-
ior. The effects of genes are dynamic in their transactions w ith
the environment: genes in themselves do not determine behaviors,
thoughts, or feelings. Genes code for proteins, period. They do
not directly encode behavior; rather, genes are expressed via the
proteins for which they code. The general process is as follows:
genes are transcribed into RNA sequences that are then translated
into polypeptides, and these finally form proteins. The amount,
location, and timing of the production of proteins are contingent
on the cellular environment. The cellular environment is influ-
enced by the external environment at every step of the above
process. The processes of gene expression link the influence of
DNA with the environment (Robinson, 2004). This is in con-
trast to the “genes as distal causes” approach outlined in Figure 1.
Unlike Nicholson’s (1998) admonishments that leader charac-
teristics are fundamentally innate, but can be moderated by the
situation, a sociogenomicist realizes that genes may also moder-
ate responses to the environment. That is to say, the environment
may have a direct effect on behavior, and genes may modulate
that environmental effect. Genes can be both causal drivers that
the environment constrains, but it is also possible for the envi-
ronment to be the causal driver that genes serve to constr ain (cf.,
Robinson et al., 2008).
GENE EXPRESSION
We first note that gene expression is a complex phenomenon:
we will often discuss “which genes are expressed,” but this is
Frontiers in Human Neuroscience www.frontiersin.org February 2014 | Volume 8 | Article 84
|
162
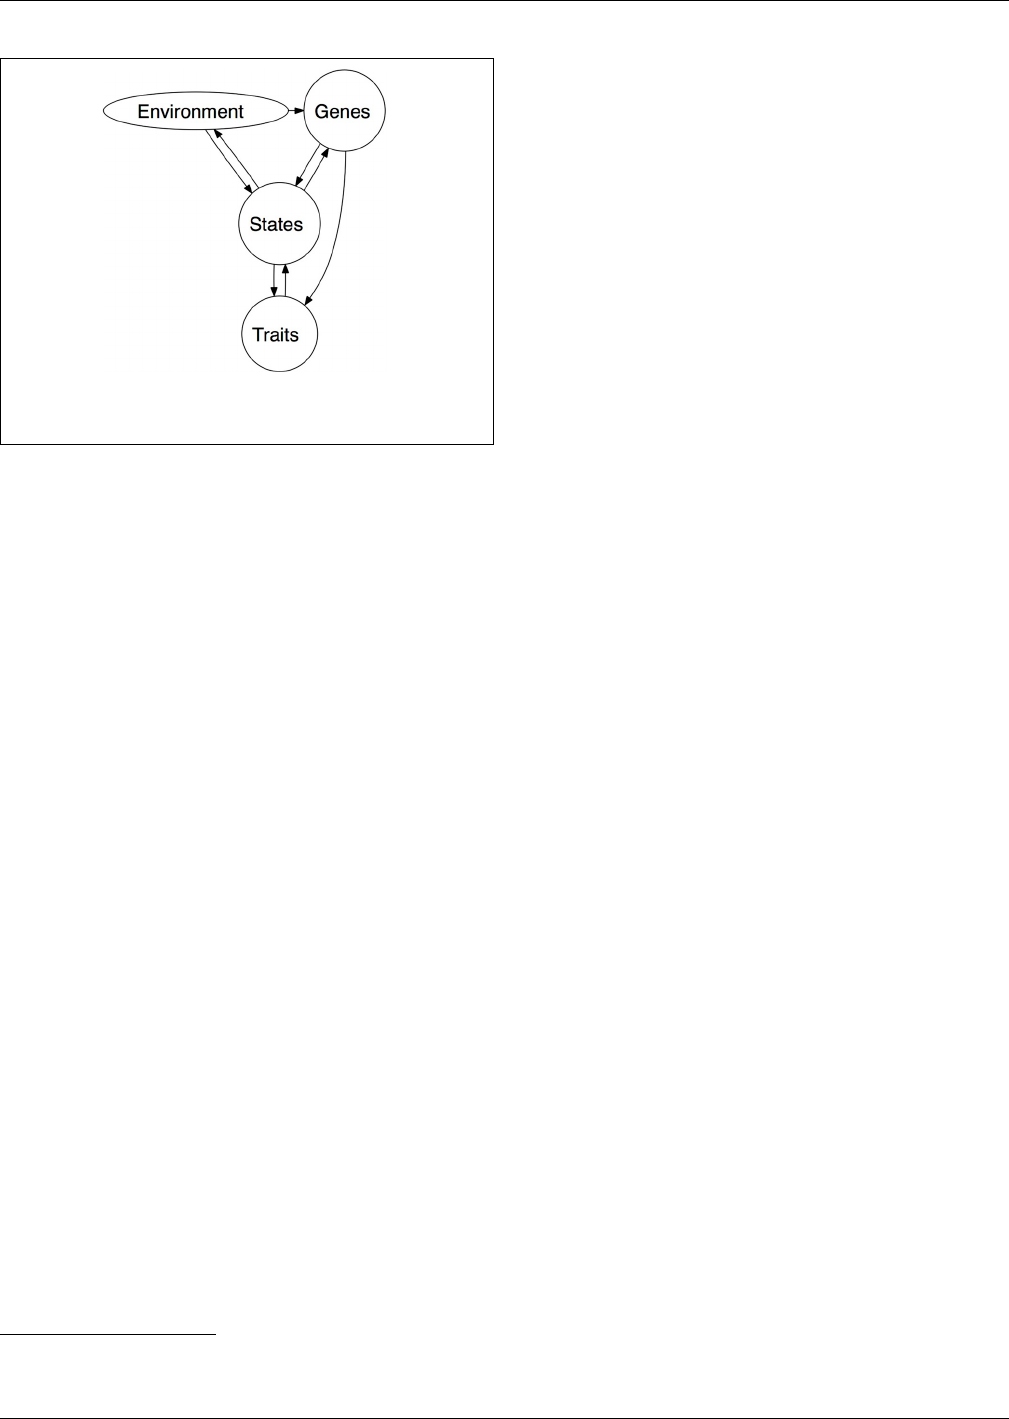
Spain and Harms Sociogenomics in organizations
FIGURE 1 | Sociogenomic model of traits (adapted from Roberts and
Jackson, 2008).
short hand for the degree to which genes are expressed. When
it comes to behaviors such as leadership or job performance,
the differences we discuss are more typically quantitative rather
than qualitative. The location (in the brain) of the gene being
expressed or the degree of expression are the key features
1
.There
are two major mechanisms that account for differences in gene
expression. The first mechanism is differences in genetics between
people, which are consistent with the “Leaders are born” (nature)
position. The second mechanism is that gene expression can be
influenced by variations in environmental conditions, consistent
with the position that “Leaders are made” (nurture). Both of these
mechanisms may result in different levels of gene expression,
meaning that both affect which proteins are being synthesized
in the person at any given time, and most importantly meaning
that both can affect the neurobiology associated with leadership
behaviors and traits.
These two mechanisms are so tightly intertwined that it is
absolutely untenable to frame the question whether leaders are
born vs. made, or even to simply assert that they are born and
made. A dichotomous viewpoint is demonstrably false. Both the
genetic mechanism and the environmental mechanism operate
on the same substrate: the genome itself. We cannot emphasize
this point strongly enough. Environments wield their influence by
affecting the production of proteins—gene expression. Both are
capable of influencing gene expression and both can affect brain
functioning similarly. We believe that nature and nurture should
be viewed not as two distinct processes but merely two sides of a
coin (Robinson, 2004; Balaban, 2006; Roberts and Jackson, 2008).
For instance, consider the study of genetics and social environ-
ment by Zhang et al. (2009b). The genetic influence on leader role
occupancy is strongest in low socioeconomic strata and weakest
for those brought up in highly enriched environments. Genetic
differences may predispose someone to be a good leader but
a certain environment may squash this or a person born with
unfavorable genetic polymorphisms may live in an enriched envi-
ronment and become successful. The key issue in sociogenomics
1
We thank an anonymous reviewer for clarifying t his point to us.
is how genes and environmental experiences combine together in
their effects.
Think of social status as an environmental variable. Social
status can have profound physiological effects. As an example,
consider the orangutan. D ominant males have pronounced sec-
ondary sexual characteristics, but subordinate adult males have
their development arrested in a “subadult” state (Maggioncalda
et al., 2002). This is not just a chronological phase in their devel-
opment;shouldthedominantmaleberemovedfrompower,the
subordinate males will develop secondary sexual characteristics.
Note that the subordinate males are not truly juvenile; they are
fertile and can reproduce, generally by forcing intercourse with
females when the dominant male is absent (Sapolsky, 2005). In
this case, an environmental variable, social status, greatly affects a
physiological mechanism—physical maturity.
In a similar vein, Roberts and Jackson (2008) describe a par-
ticularly dramatic example of the impact of the environment
on gene expression: the life course of the blue-headed wrasse, a
tropical reef fish (e.g., Stearns, 1992). The males are large and
bright blue, while the females are small and dull brown. Males
tend to collect a harem of females whom they protect and mate
with. When a predator eats the male, the females do not search
out a new male. One of them instead transforms into a male
overnight. This effect is genetically mediated, but it is accurate
to say that an environmental condition, loss of the harem’s male,
causes the sex of the fish to change. That is, an environmental
event induces a change in gene expression, which then results in
profound physical and behavioral changes.
Further examples of genetic and environmental forces work-
ing together can be drawn from the lives of honeybees. Worker
bees begin life as caretakers of the hive but eventually become
food gatherers (Robinson, 2004). This change is associated with
changes in the expression of more than 2000 genes (Whitfield
et al., 2003). Changes in the for gene are associated with shifts
in the environment. For instance, when there is a shortage of
food gatherers, the for gene becomes expressed and a cascade
of changes occur that transition the worker into a food gatherer
(Ben-Sharar et al., 2002). The gene is similar across all bees, but
the influence of the gene for a particular bee is contingent on the
state of the particular bee’s environment—the conditions of its
hive.
Such changes in gene expression that are not dependent on
the DNA sequence itself are called epigenetic effects (Zhang and
Meaney, 2010). Such effects occur as a result of various mech-
anisms, but the most well understood is DNA methylation.
Methylation stops the transcription of a gene, halting production
of the protein that gene codes for. Strands of DNA can continue to
be methylated across time, demonstrating how an environmental
effect continues to effect expression even after the environment is
removed.
Such epigenetic effects can manifest in very subtle ways. For
instance, rat pups that have been licked more by their moth-
ershandlestressbetterthanpupsthathavenotbeenlicked,but
that licking behavior is itself heritable. So, it is unclear whether
the response to stress in rat pups is directly heritable or if it is
environmentally mediated by this licking behavior (Weaver et al .,
2004)—the genetic and environmental effects are observationally
Frontiers in Human Neuroscience www.frontiersin.org February 2014 | Volume 8 | Article 84
|
163

Spain and Harms Sociogenomics in organizations
confounded. Examining the mechanisms of gene expression clar-
ifies this problem, however: maternal licking behavior affects
methylation that in turn affects expression of the glucocorticoid
receptor gene. Rats with greater activity in the glucocorticoid
receptors are better able to tolerate stress. This means that the
observed individual differences in rat stress response were not
directly attributable to genetics, but via the epigenetic modi-
fication of gene expression due to methylation (Weaver e t a l. ,
2004). The effect of the gene is contingent on environmental
factors.
There is some early evidence for such epigenetic effects in
humans. For instance, methylation patterns between identical
twins are highly, but not perfectly correlated (Mill et al., 2005).
Identical twins share 100% of their genes, but this finding indi-
cates that some life event(s) altered gene expression in the
twins studied. This finding has been replicated, and it has been
shown that the degree of epigenetic dissimilarity was correlated
with the age of the twi ns and the amount of time the twins
had spent together (Fraga et al., 2005). Older twins and twins
who spent more time apart had greater differences in methy-
lation patterns. Even for identical twins, who share exactly the
same genetic material, external events are capable of chang-
ing the way these genes are expressed. DNA is not the only
causal driver of gene expression; the environment can play an
important role.
A sociogenomic leadership theory that embraces gene-
environment interplay points to new avenues of research. For
instance, consider the Avolio et al. (2009) study of the effects
of authoritative parenting and rule-breaking behavior on leader
role occupancy. A sociogenomic leadership researcher would be
interested in the mechanisms by which authoritative parent-
ing operates on rule-breaking behavior and leader emergence.
Like the rat pups above, are certain gene sequences silenced
by authoritative parenting? What mechanisms might drive these
findings? Parenting sty le may set limits on the environments
that a child is able to enter. This would be a case of the effect
being entirely environmentally mediated, whereas the example
of the rat pups is genetically mediated, but either mechanism is
possible.
While it is not yet possible to study gene expression directly
in living humans, studies of gene-environment interactions sug-
gest that these contingencies may exist. Most behavioral genetic
studies in psychology find that somewhere around half of the
variance in phenotypes is genetic and the other half is mostly
attributable to unique environmental effects (there is often some
small amount of variance attributable to common environment
found, but see Turkheimer’s second law above). Such findings are
often built around an improperly specified model: one that does
not explicitly account for the environment (e.g., Brofenbrenner
and Ceci, 1994). When the environment is explicitly taken in
to account, the findings can be markedly different. The heri-
tability estimates are moderated by the environmental effects,
such that heritability can be higher or lower as a function of
some environmental variable, such as the effects of socioeco-
nomic status on the heritability of intelligence discussed above
(Turkheimer et al., 2003). For instance, the heritability of nega-
tive emotionality decreases and the effect of shared environment
increases at higher levels of parental conflict (Krueger et al.,
2008).
Such findings from the personality psychology literature may
help to put results such as Zhang et al. (2009a,b) into con-
text. Recall that the genetic effect on leadership role occupancy
was moderated by level of social enrichment. The sociogenomic
approach leads to questions about how these effects occur. What
mechanisms get under the skin, transmitting environmental
effects to the genome? Roberts and Jackson (2008) presented
a schematic model for a sociogenomic personality psychology.
Figure 1 presents a modified version of this model. We consider
all major facets of the model to b e latent variables; we assume
that even biological substrates will be measured with some error.
What is important to note in this model is the direction of the
arrows. The environment may act directly upon the biological
substrates, through epigenetic mechanisms and gross insults (tox-
ins, brain parasites, iron damping rods through the face), but the
biological substrates act on the environment indirectly by way
of traits and, most proximally, states. Environments may also act
indirectly on the biological substrates via experienced psycholog-
ical states. For example, the structure of the brain is reconfigured
under long-term stress; the medial prefrontal cortex and hip-
pocampus atrophy and the orbitofrontal cortex and basolateral
amygdala expand (McEwen et al., 2006).
We argue that leadership style is essentially a trait, a pattern
of behaviors that is relatively stable across time and situations.
Individual leadership behavioral episodes, such as influencing a
particular follower are states (cf., Fleeson, 2001; Beal et al., 2005;
Fleeson and Leicht, 2006). Traits and the environment both affect
states, and states act on the physiological substrates, which in
turn influence trait levels. For example, individuals told to pose
in powerful ways have been shown to experience ele vated lev-
els of testosterone and decreases in cortisol levels which, in turn,
impacts their decision-making and risk-tolerance (Carney et al.,
2010).
The key behavioral component of this model is the state:
individual behavioral episodes. The individual engages in behav-
iors that set goals, build relationships, express trust in subordi-
nates, initiate structure, and so on. These behavioral episodes are
determined by environmental constraints (e.g., department pol-
icy, requests from senior management, compensation structure)
and by traits (e.g., need for power, need for affiliation, domi-
nance, sociability, attachment style, propensity to trust). From
the standpoint of developing leaders, these episodes are key. Like
stress remodeling the brain as described above, how can leader
development interventions be constructed to redesign the neural
architecture of the leader? We see the point of leader develop-
ment interventions as using the environment to induce states that
ultimately alter t rait levels.
We believe that the key difference between the current
models of biology employed by leadership researchers and
the sociogenomic perspective is one of generativit y. The
sociogenomic perspective, as outlined above and summarized
in Figure 1 provides direction to research investigating the
genetic and environmental effects i n leadership. We outline a
few key areas for emergent scholarship below. Work under
current models is effectively descriptive, documenting genetic
Frontiers in Human Neuroscience www.frontiersin.org February 2014 | Volume 8 | Article 84
|
164
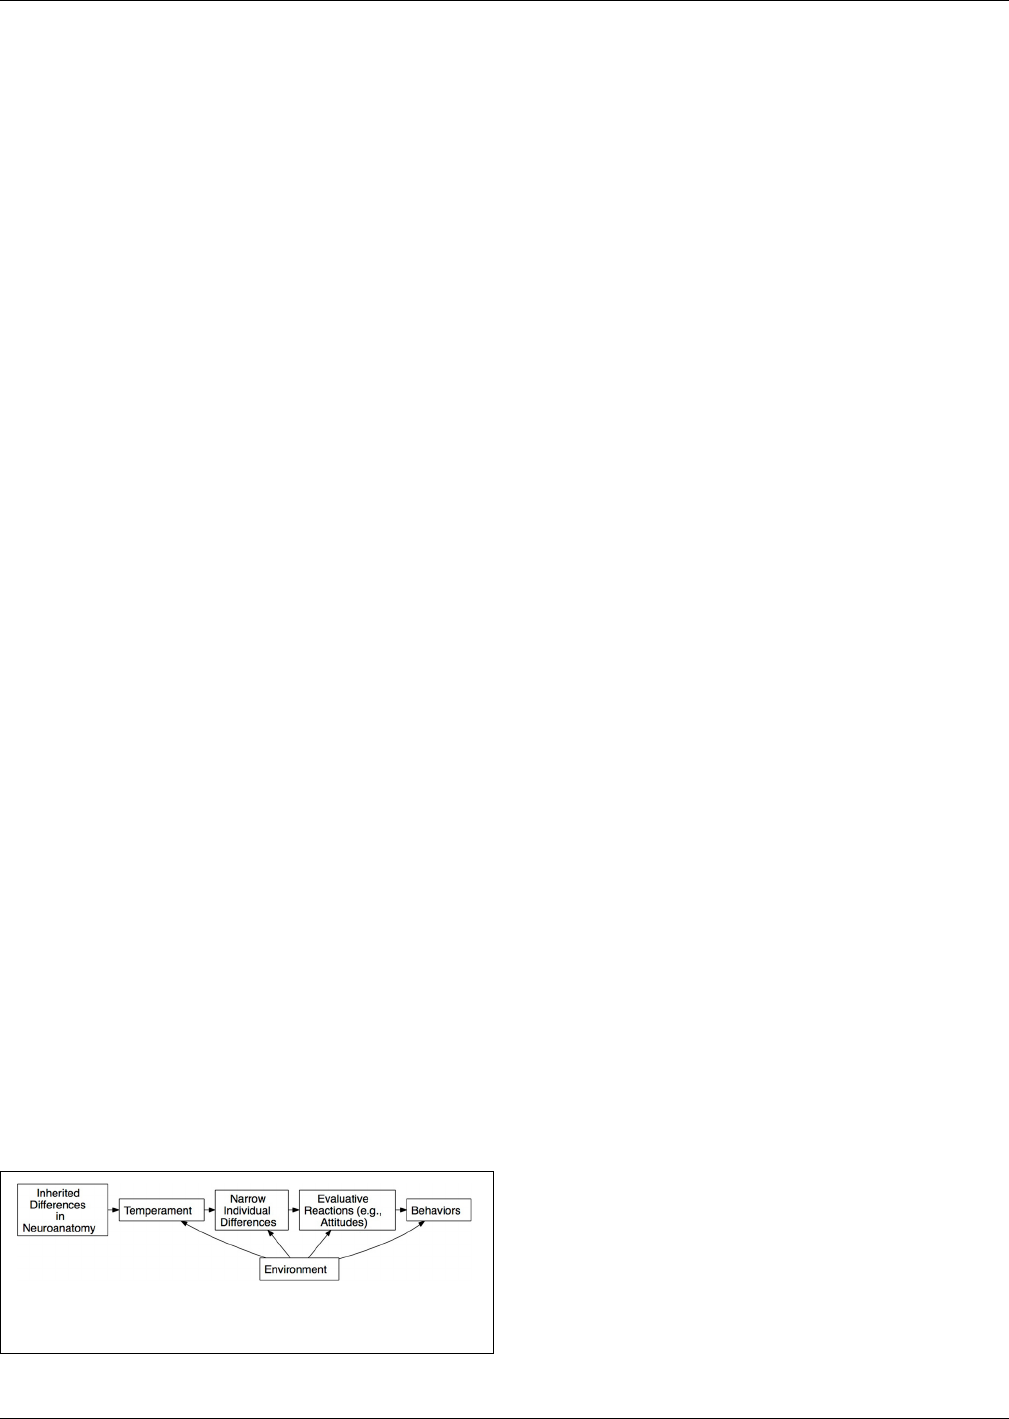
Spain and Harms Sociogenomics in organizations
and environmental effects. The unifying functional framework
provided by sociogenomics presents many opportunities for
exploration.
RECONSIDERING THE RECTANGLE: BORN AND MADE
The current approaches to the biology underlying psychologi-
cal characteristics seem to view genetics as an unchanging causal
force on behavior. In such conceptualizations, consequential
social phenomena, such as leader effectiveness, lie at the end of a
causal chain begun with the biological substrates underlying per-
sonality traits (e.g., McCrae and Costa, 1996;cf.McCrae, 2010).
While other stages in the causal chain are seen as subject to envi-
ronmental pressures, these biological substrates are not. DNA is
the core of these str uctures, and is seen as an immutable influence
on phenotypic traits throughout the lifespan. The assumption
is that, as genetic polymorphisms do not change, the effects of
DNA on behavior should be constant, therefore any changes in
phenotype are caused by genes (McCrae, 2010).
Ilies et al. (2006) employed similar reasoning in their argument
that causality flows from genetic factors through large, hetero-
geneous traits to narrower traits to behavior. Figure 2 presents a
“born not made” model of leadership, adapted from Roberts and
Jackson (2008). This model remains current in biological think-
ing throughout the social and organizational sciences. The origins
of this perspective lie in Eysenck’s (1967) views on personality and
intelligence, which have been very influential on biological think-
ing in psychology. The details of specific biological models vary,
but the take-home point regarding models of this form is this:
causal flow is always from the biological subst rate to the behav-
ioral or social outcomes (e.g., McCrae and Costa, 1995, 1996;
DeYoung, 2010). This point of view seems well represented in
organizational research, w ith a model like this implicit in Ilies
et al.’s (2006) review, and the explicit argument in Antonakis et al.
(2010) that personality traits can be used as instrumental vari-
ables in many settings in organizational research, because their
levels are set exogenously by genes. According to this theoreti-
cal point-of-view, the environment is generally viewed as capable
of modulating anything causally downstream from the functional
neuroanatomy, but does not generally impact genetic or physio-
logical systems, barring gross injury (such as the well-known fable
of Phineas Gage).
Nicholson (1998) provides a fairly clear summary of this
viewpoint. He describes three hypothetical children from a hypo-
thetical family, each with a radically different temperament: the
first is introverted and grows up to be a research scientist, the
second is talkative and grows up to be a salesperson, the last is
even-tempered and grows up to be a schoolteacher. Nicholson
FIGURE 2 | Traditional biological model as discussed in Ilies et al.
(2006).
states, “Evolutionary psychology tells us that each one of these
individuals was living out his biogenetic destiny.” Personality dis-
positions are descr ibed as hardwired. Leadership skills can be
taught, but the “passion to lead” is an innate difference (cf. Doh,
2003). Nicholson points out that possessing this genetic endow-
ment may not always lead to successful leadership, though, as
situational characteristics may necessitate some other set of traits.
From this perspective, the biological component of behavior—the
disposition—simply is, and is effectively immutable; situational
characteristics merely determine whether expressing that disposi-
tion is effective vs. ineffective. That is, genes are the causal drivers
and the environment acts only in modifying the effectiveness of
genetically caused preferences.
How should the behavioral genetic evidence discussed above
be interpreted under this perspective? The key to understand-
ing this perspective is that physiological systems are given causal
primacy over psychological mechanisms. This is the approach
adopted in some quarters of personality psychology, with the
implication that genetic polymorphisms manifest themselves in
specific neuroanatomical structures which in tur n give rise to
largely static psychological characteristics (McCrae and Costa,
1995, 1996; DeYoung, 2010). Advocates of this viewpoint usu-
ally argue that since the genetic polymorphisms are invariant
and, barring gross injury, so are the neuroanatomical structures
and their concomitant temperaments/traits. The environment is
essentially restricted to affecting what McCrae and Costa refer to
as characteristic adaptations, the learned habits that individuals
develop to express their native traits in acceptable or functional
ways within their environment.
The “Leaders are BORN” view tends to force such dichoto-
mous thinking, however (and so does the “Leaders are MADE”
perspective). If the genetic polymorphisms one is born with are
invariant over the life course and they guide the development of
the neural architecture we think with, how can it be otherwise?
Researchers operating within this framework have a tendency to
demonstrate that a genetic component exists for leadership (e.g.,
Johnson et al., 1998) or to statistically control for genetics in order
to more purely estimate the environmental effects of interest
(Avolio et al., 2009). The next section argues that this point avoids
addressing the true complexity of the relationship between genet-
ics and experiences as causal agents. Studies such Avolio et al.
(2009) demonstrate a conceptual weakness in other interaction-
ist perspectives, relative to the sociogenomic outlook. Statistically
controlling for a genetic effect while estimating the environ-
mental effect separates two inseparable things—remember both
genes and environment operate through mechanisms of gene
expression—and assumes that the genetic effect is invariant over
time. These traditional interactionist studies ask the aforemen-
tioned question, “which contributes more to the area of a rectan-
gle, its length or its width?” Like Nicholson (2005), we believe that
a truly interactionist perspective is needed, but we believe that a
sociogenomic approach—where both genes and environment are
truly causal mechanisms—provides that perspective. Specifically,
recent evidence indicates the epigenetic mechanisms are active
throughout the life-course (Zhang and Meaney, 2010; Charney,
2012). It is possible that these mechanisms are responsible for
various aspects of development and behavioral plasticity.
Frontiers in Human Neuroscience www.frontiersin.org February 2014 | Volume 8 | Article 84
|
165

Spain and Harms Sociogenomics in organizations
WHAT CAN ORGANIZATION STUDIES SCHOLARS LEARN
FROM THE SOCIOGENOMIC PERSPECTIVE?
The major take home messages from the sociogenomic perspec-
tive are quite broad. Sociogenomics provides a meta-theoretical
framework that can assist leadership scholars in framing and
interpreting new and existing research. This framing is achieved
by recognizing the deep interdependence of genes and the envi-
ronment in facilitating behavior. To explore this interdepen-
dence, we propose three platforms of research informed by the
sociogenomic perspective.
PROPOSAL 1: CONDUCT CROSS-SPECIES STUDIES OF SOCIAL
INFLUENCE PROCESSES
Recall that one of the foundational points of the sociogenomic
perspective is the conservation of the genome. One main point
is that the behavioral syndrome we call leadership has direct
analogs in other species, and that the chemical pathways that
lead to the syndrome are likely to the same, whether the subjects
of study are people, primates, or stickleback fish. Additionally,
even simple species, such as nematodes, fruit flies, and h oney-
bees, display interesting social behavior that have human analogs
(Sokolowski, 2010). Roberts and Jackson (2008) pointed out
that a sociogenomic personality psychology would be a com-
parative psychology from the start. This point is also true of a
sociogenomic leadership theory. This can be a challenge because
of the definition of leadership in many areas of biology—for
instance, in behavioral ecology, leadership is often being the indi-
vidual who selects which direction the group will move in most
frequently (cf., Van Vugt, 2006), though this may provide some
insight into humanity’s evolutionary past.
To use this proposition, organizational researchers who
embrace the sociogenomic model would first investigate how the
behavioral syndromes associated with leadership roles are man-
ifested in other species. For instance, the political rivalries and
power plays within a colony of chimpanzees may inform research
on power and status motives in human leaders or the process of
coalition building in human work teams (de Waal, 2000). With
this suggestion, we do not just mean to address neurobiologi-
cal systems. Animal models may allow us to formulate tighter
hypotheses about important experiences and environments. By
examining the more visible social and power relations in animal
models, we may have a better idea of whether important experi-
ences or developmental environments occur early or later in life,
whether those experiences involve peers, and the degree to which
a for mative experience can shape an individual. Social experi-
ments that may be difficult or unethical with human participants
might be possible. For instance, what happens both socially and
neurobiologically when an individual at the top of a hierarchy in
a particular context is moved into a new context? Are they still “a
leader”; how is their neurobiology affected?
Such a lack of normal social context for leadership using ani-
mal models may disconcert many organizational scientists. We
do not suggest that normative findings will be discovered from
cross-species research; to expect so would mean we have com-
mitted the naturalistic fallacy—“that which is, must be good.”
We suggest, instead, that such research can open up a very
clear view of the neurochemical mechanisms that drive certain
aspects of leadership-relevant behavioral syndromes. This, in
turn, may provide deeper insights into the psychological mecha-
nisms that constitute leadership. Additionally, the insights gained
from understanding animal nature may have direct practical
implications, for the opposite reason of the naturalistic fallacy.
These insights may help us to understand how humans want to
behave, contrary to organizational and societal expectations (e.g.,
de Waal, 2000; Van Vugt and Ahuja, 2011).
PROPOSAL 2: INCREASE PRECISION AND SPECIFICITY IN MEASURING
ORGANIZATIONAL BEHAVIOR CONSTRUCTS
Part of the problem in asking strong biologistic questions about
leadership is that leadership, as a set of phenomena, is likely too
complex to submit to localization in specific neural structures or
processes. A sociogenomic approach to leadership would thrive
on detailed, specific measurements of its constructs and the dif-
ferences between them. There are two major reasons for this.
The first is that it is necessary to clearly understand the pheno-
type in order to progress in understanding the genotype—and
its transactions with the environment. Measurement is, unfortu-
nately, not a particular strength of current leadership research,
and is weak in much of organizational behavior. The prolifera-
tion of constructs in leadership theory, with little clear evidence
for their distinctiveness makes this point problematic: what are
the important, distinct behavioral syndromes that sociogenomic
researchers should be investigating? For instance, it has been
shown that satisfaction with one’s job has a heritable compo-
nent (Arvey et al., 1989). That such attitudes are heritable has
sometimes been explained by the heritability of more general per-
sonality traits (e.g., Olson et al., 2001), but is that argument fully
consistent with a sociogenomic analysis (cf., Roberts and Jackson,
2008)?
In leadership research, specifically, another rationale for
improved psychometrics in organizational behavior is that pre-
cise measurement would allow the community of leadership
researchers to build up a well-specified nomological network
to enable understanding of how, why, and when good lead-
ers emerge and how they behave while holding their leadership
roles. That is to say, what are the biological and psycholog ical
factors that predict “leadership”—before the putative leader is
even thrust into any leadership role? Measurement in the field
of leadership must be put on firmer psychometric grounding.
Leadership scholars may need to invite assistance from psy-
chometricians to achieve this goal. Even with such assistance,
confronting biological systems may require further refinement of
measures.
For example, serotonin functioning is implicated in domi-
nance behavior in chimpanzees, and treatments with the sero-
tonin precursor tryptophan increase dominance in everyday
social interactions in humans (Moskowitz et al., 2001). In par-
ticular, to understand the role played by serotonin, one needs to
differentiate between two modes of self-regulation. In the first
mode, individuals engage in quick, affect-laden responses built
upon approach and avoidance emotions (e.g., joy vs. fear). The
second mode is an effortful control system that can serve to guide
voluntary behavior or to inhibit inappropriate responses. The sec-
ond mode is capable of overriding the first mode. Essentially, at
Frontiers in Human Neuroscience www.frontiersin.org February 2014 | Volume 8 | Article 84
|
166

Spain and Harms Sociogenomics in organizations
any given time, any given human is working in one of two ways:
a highly emotional, reactive mode or a deliberative, thought-
ful mode. Carver et al. (2008) argued that the serotonin system
facilitates greater effortful control.
Using such a highly specific, detailed formulation of the con-
structs allows considerable insight into the serotonergic system
and its associated behavior syndromes. Depression reflects the
combination of low activation in both the approach system
and the effortful control system. Similarly, the construct impul-
sivity confounds high activation in the approach system with
low effortful control. Since serotonin facilitates effortful con-
trol, it therefore affects a wide range of seemingly unrelated
psychological domains, such as depression, angry hostility, and
impulsivity.
Current assessment of leadership is frankly weak from a bio-
logically informed perspective. Behavioral syndromes such as
transformational, transactional, or authentic leadership are prob-
ably too coarse (see Avolio and Gardner, 2005) to be diagnostic
of the physiological systems at play. We do not mean to sin-
gle out these constructs as being the only ones in the leadership
literature that are too broad to aid in building biological theo-
ries of leadership. It is unlikely many of the leadership measures
in current widespread use would be sufficiently precise for such
purposes.
To reiterate, there are multiple ways to think about leadership.
In this essay, we have approached leadership in a behavioral or
trait-like manner. That is, that a leadership style is a pattern of
behaviors exhibited by an individual in a formal or informal lead-
ership role that is fairly stable (in contrast to, say, emotions) across
time and situations
2
. We wish to be clear that we are not indicating
that leadership per se is a trait, but that a variety of leadership con-
structs, such as leadership style, can be approached in the same
manner as other individual differences.
Beyond the previous considerations, the individual’s physiol-
ogy has implications for any conceptualization of leadership, and
the measurement systems used should incorporate those consid-
erations. As an example, consider the serotonergic system. It is
implicated in dominance, and dominance appears important to
attain and maintain status. Now, we are left with a host of research
questions regarding the role the serotonin system plays in domi-
nance and status attainment. For example, how does variability in
serotonergic functioning affect leader emergence? Does attaining
leadership status, in turn, affect the serotonergic system (a corre-
sponsive effect; Roberts and Caspi, 2003)? Different social settings
are likely to allow only some dominance displays—what role does
serotonin play in navigating this social milieu?
Aconnectedpointthatisimportanthereisthatmultiple
methods should be used to investigate the biological under-
pinnings of leadership behavior. Hormonal assays can be used
2
Alternative views of leadership may conceive of leadership as a social process
centered around influence or as a relationship. However, we believe that the
most popular operationalizations of leadership (i.e., self- and other-reports
of typical behaviors) are consistent with a trait-like perspective of leadership,
where traits are considered as typical levels of behavior that persist over time
and situations, but are flexible and develop over time, rather than being static
(Roberts, 2006).
to study the roles that stress and sex hormones play in vari-
ous leadership-relevant interpersonal interactions. For instance,
recent work shows that w hile member testosterone, as measured
with saliva swabs, does not predict member status within the
group, mismatches between testosterone levels and member sta-
tus in group settings negatively impact the group’s collective
efficacy (Zyphur et al., 2009). There are also indirect measures
of testosterone level that can predict leadership-relevant quali-
ties. Facial masculinity, a signal of testosterone, is associated with
rank both at US Military Academy at West Point and late-career
rank (Mueller and Mazur, 1996). Depth of voice, another indi-
cator of testosterone, is a robust signal of dominance (Wol ff a nd
Puts, 2010).
We also think that brain-imaging work can be helpful in clari-
fying the meaning of leadership constructs. Use of brain imaging
methods is tightly tied to our concerns regarding the specificity
of measurement systems employed in leadership research. For
instance, is it meaningful to ask, what are the neural correlates of
transformational leadership? As an example, it has been suggested
that neuronal coherence (an index of communication between
areas in the brain) in the right frontal cortex may be associated
with visionary communication (Waldman et al., 2011). Perhaps
more meaningful is to narrow this question down to deal with the
construct of “charisma” (Gardner and Avolio, 1998). The point
remains that constructs must be sufficiently well defined so as to
permit investigation of their neural substrates. Additionally, we
can ask this question in two ways. First, on the leader side, which
neural mechanisms are involved in the kinds of idealized influ-
ence tactics that constitute charismatic leadership? Secondly, on
the follower side, which mechanisms do those influence tactics
engage?
Finally, finer measurement of leadership constructs would
increase the utility of molecular genetic studies. For instance,
consider the measurement of power motivation, which has been
argued is extremely important to the acquisition of leader sta-
tus (Nicholson, 1998; Pfeffer, 2010). Power motivation can be
measured using an approach motivation framework, desire for
power, or using an avoidance motivation framing, fear of power
(Harms and Roberts, 2006; Harms et al., 2007). Using these
approaches may help to clarify the role of the neurophysiolog-
ical systems in understanding leadership phenomena, and help
to direct attention to candidate genes (such as dopamine recep-
tor and serotonin transporter genes). The molecular genetic
approach is open to criticism, in that the results are notoriously
difficult to replicate—but the original research should be done so
that issues of replication can even be addressed.
PROPOSAL 3: IDENTIFY KEY CONTEXTS AND TIMING FOR ADULT
DEVELOPMENT AT WORK
The key insights from a cross-species, sociogenomic view of
leadership demonstrate how critical particular environmental
experiences can be for profound behavioral—and sometimes
physical—change. Avolio (2005) discussed the tension between
the “born” and “made” perspectives in the development of lead-
ers. The premise is that the genetic endowment an individual has
is a starting point. The stream of events and situations a per-
son experiences is what develops the individual as a leader. The
Frontiers in Human Neuroscience www.frontiersin.org February 2014 | Volume 8 | Article 84
|
167

Spain and Harms Sociogenomics in organizations
key insight from sociogenomics is that, even for highly heritable
traits, those traits are still open to environmental influence. Again,
heritability does not reflect the degree to which an attr ibute is
“set in stone” and does not necessarily act as a constraint on
the amount of influence that environment can have on shap-
ing leadership. That is, no matter how high the heritability there
is still a possibility for environmental interventions. Thus the
question becomes, what are the situations (occurrences, times
of life, and so on) that will allow a person to develop into
a leader and are there interventions that can lead to better
leadership?
A sociogenomic leadership approach would help to develop a
science of leader development in two key ways: to help understand
what contexts are developmentally important and when they can
be expected to occur (cf., Day et al., 2009). For instance, it is
appropriate to question what the evolutionarily appropriate con-
texts for leader development are. Hogan (2007) has argued that
in the work context, individuals must b alance two fundamental
motives: getting ahead and getting along. Hogan argues that these
motives are products of our evolutionary history as social ani-
mals. Entry into the organization can be viewed as entry into a
social hierarchy, and many of the situations that follow can be
viewed through the lens of attempts to attain and maintain status
within the hierarchy. Again, comparative study of other primates
or traditional social groups (e.g., hunter-gatherers) could help us
understand these contexts.
What if it is possible to design interventions that counteract or
decrease the phenotypic variance attributable to genes (similar to
the Turkheimer SES and IQ studies mentioned above)? For exam-
ple, consider the US Military Academy at West Point. West Point
has a strict organizational hierarchy, with cadets attaining various
ranks that mirror the active duty Army. Additionally, West Point
has the explicit goal of developing cadets into military leaders,
and uses a variety of formal and informal developmental inter-
ventions to do so, including 360 feedback mechanisms. There
are individual differences in the developmental trajectories for
cadets for scores on those 360 instruments (Harms et al., 2011),
indicating that some cadets are more successful at navigating
this formal hierarchy. A sociogenomic approach to such a study
would attempt to capture the psychological, physical, and politi-
cal tools that cadets use to navigate the organizational hierarchy,
and how those tools relate to leader competencies across time. For
instance, do leadership skills enable assent in the organization,
or does role attainment facilitate skill development? Another key
question is how do experiences in the organization get translated
into t rait-like leadership competencies; what behavioral episodes
are key?
As a further example, can traumatic experiences catalyze
the development of leadership within a person, such that a
person experiencing traumatic events becomes more resilient
and more capable of exerting leadership (e.g., Avolio, 2005)? A
sociogenomic researcher might ask which genes are expressed (or
suppressed) when trauma occurs? What is the biochemical path-
way such trauma induces—does the expression of these genes
trigger a cascade of expressions in other genes that influence
activity in multiple areas of the brain? For instance, trauma is
implicated in a number of negative b ehavioral syndromes, such as
antisocial personality disorder and depression (Caspi et al., 2002,
2003). What are the physiological differences that allow some
individuals to use tr aumatic events to catalyze their leader devel-
opment, as opposed to sinking into violence or despair? What
interventions can alter the individual’s reaction to the traumatic
event? Can we identify the molecular pathways such an inter-
vention would engage? How does the whole process play out?
Understanding the biological mechanisms that mediate the effects
of trauma and recovery will help design more effective interven-
tions. Based on the model in Figure 1, it is clear that because
psychological states mediate the influence of the environment
on both the biological substr ate and leadership-relevant traits,
it is likely that effective leadership interventions should be sus-
tained over longer periods of time. For instance, the West Point
study by Harms et al. (2011) found development on leadership
competencies persisted over a p eriod of 2 years.
Furthermore, the existing evidence from behavioral genetic
studies shows that a considerable amount of variance in lead-
ership outcomes is unexplained. Unique environmental factors
explain most of the variance in leader role occupancy, but only
a fraction of this variance has been explained by measured life
experiences (Arvey et al., 2007). How might experiences with
authority, early leadership roles, responsibility in fraternal, social,
or civic organizations, and other life experiences shape the states
that individuals experience? How do those states affect gene
expression and neural architecture? Is it possible to use animal
or ethological models to identify important roles and timing for
leader development experiences? We focus above on leader devel-
opment, but it seems clear that the roles, demands, and general
characteristics of an individual’s job impacts his or her personality
development (e.g., Roberts, 2006). If personality is important to a
wide variety of on-the-job behaviors, then this development will
have important consequences of our understanding of the rela-
tionship between genetic, neurological, and behavioral variables
in organizational settings.
PROPOSAL 4: CLOSER INTEGRATION WITH EVOLUTIONARY
PSYCHOLOGY
Up until this point, we have largely ignored the other main
biological research tradition in behavioral science: evolutionary
psychology. One reason is that, until relatively recently evolu-
tionary psychology has focused on species-general adaptations
(i.e., mechanisms or structures that do not v ary over individu-
als in a population; e.g ., Tooby and Cosmides, 1990;cf.,Penke,
2010), and such universal features are less generally relevant in
organizational contexts: understanding them could help design
very general aspects of the work environment (e.g., safety, com-
pensation systems), but are less helpful in selecting, training,
motivating, or leading individuals at work. More recently, though,
researchers have begun to integrate evolutionary psychology with
research on individual differences (e.g., Penke, 2010; Buss and
Penke, 2014). Such efforts revolve around understanding individ-
ual genetic variation and its impacts on behavioral characteristics.
We have argued throughout this essay that sociogenomics is an
effective meta-theoretical framework for studying psychologi-
cal, behavioral, and neuroscientific phenomena in organizations;
evolution (and, by extension, evolutionary psychology) is the
Frontiers in Human Neuroscience www.frontiersin.org February 2014 | Volume 8 | Article 84
|
168

Spain and Harms Sociogenomics in organizations
meta-theory that the sociogenomic framework plugs into (cf.,
Buss, 1995).
Evolutionary theory also provides a variety of conceptual tools
that can aid researchers in analyzing problems and behaviors,
such as life history theory and costly-signaling theory, to name
just two (Buss and Penke, 2014). Consider life history theory, as
an example. Individuals have limited time and energy to devote
to their various pursuits, and so face trade-offs when investing
these resources in any particular activity. Life history theory pro-
vides a broad framework for analyzing these choices (Kaplan and
Gangestad, 2005). For example, an individual male may invest
efforts into securing a leadership position at work to increase
his status and compensation, in order to secure a desirable mate
and provide resources for future offspring, helping to solve the
two major problems of reproduction and parenting (cf., Buss and
Penke, 2014). Thinking about the action acquiring a leadership
position in this way could help to better understand the moti-
vations and cognitive processes the individual has, opening this
action up to greater theoretical elaboration.
Further, evolutionary theory can help to provide implementa-
tion guidelines for our previous proposals. Specifically, consider
our discussion of identifying key contexts and timing for leader
development above. Such contexts are situations, in the classical
person-situation debate sense (cf., Mischel, 1968). Important sit-
uations are defined by the adaptive problems that obtain within
their boundaries (Buss and Penke, 2014). A relevant context for
leadership development may be a child’s first day of school, for
instance: his or her first exposure to a prominent status hierar-
chy with authority figures (i.e., teachers, administr ators) who are
not the child’s parents. While we focus here on the first day of
school, it is the experience of the status hierarchy that defines the
evolutionarily important context.
ETHICAL CONSIDERATIONS
In some ways, genetic or other physiological screening in orga-
nizations is similar to the psychological and physical testing
already used for selection among applicants (cf., Guion, 1998).
The measures used in those settings, such as cognitive ability tests,
personality assessments, and tests of physical strength, dexterity
or endurance are imperfect indicators of the underlying psycho-
logical or physical entity (cf., Lord and Novick, 1968). They are
also imperfect predictors of future behavior at work. Often, how-
ever, the results of these measures are imbued with a certain
physical, biological interpretation: that is, a person’s levels of some
personality trait, like conscientiousness—the tendency to be neat,
orderly, punctual, achievement-oriented (cf., Barrick and Mount,
1991)—is set by the person’s genes (e.g., Antonakis et al., 2010). If
that viewpoint held, then direct assessments of the genes or neu-
roanatomical structure that serve as the biological foundation of
conscientiousness would be just as appropriate.
Oneofthemajorpurposesofthisreviewhasbeentodemon-
strate why that view has flaws. Possessing a particular genetic
polymorphism seems unlikely to be enoug h to determine an indi-
vidual’s standing on a trait as complex as conscientiousness (or
any other complex behavior). The genes a person possesses may
express themselves differently (or not at all) conditional on the
environment. Further, environmental changes may impact the
individual’s psychological states, which could then affect gene
expression and remodel the person’s neuroanatomy (cf., Roberts,
2006; Roberts and Jackson, 2008). When these possibilities are
taken into account, it seems unwise to simply examine an indi-
vidual’s current biology and make strong behavioral predictions
basedonit.
Let us return to the example from the beginning, of the “psy-
chopath” neuroscientist, James Fallon. If we lived in a world with
rigid genetic or neuropsychological screening, he would perhaps
neverhavebeenadmittedtograduateschooltoearnaPh.D.We
would then not have his example to illuminate the possibility that
our genes are not our destiny, that an individual whose genes
appear to code for psychopathy, and whose neurological func-
tioning bears this out, can be a successful scientist with a close
family. Under the sociogenomic framework, there is a complex
path from the particular variant of a gene that an individual pos-
sesses and the behaviors they are likely to exhibit; as a result, it
seems to us that organizational interventions based on genetic or
neurological information are a long way from being tools in the
practicing manager’s kit.
CONCLUSION
This paper is meant to incorporate theoretical insights from
molecular biology within leadership research, using a framework
that has been profitable to understand social behavior across
species, time and outcomes (Robinson, 2004; Robinson et al.,
2008; Bell and Robinson, 2011). Certainly, we do not cover every
aspect of this theory, nor can this be considered the final word
on the topic. We mean to contrast static thinking regarding the
influence of both traits and genetics with the highly transac-
tional view of the gene-environment interplay provided by the
sociogenomic perspective. That is, to say that a characteristic
is genetic is not to say that it is unchanging; there is a funda-
mental interplay between genes and the environment throughout
the life course. Our genetic material does not make our des-
tiny; it does not have a simple direct influence on phenotypic
behavior. Sociogenomics encourages leadership researchers to
focus on functional questions: what mechanisms facilitate leader
emergence? What psychological adaptations facilitate effective
leadership? What are the physiological substrates of leadership
constructs?
Further, sociogenomics urges leadership researchers to attend
to the evolutionary context in which leadership emerged: this
may provide key insights into how these functional mechanisms
operate within modern organizational contexts. For instance,
how is social status attained within an organization, and which
mechanisms facilitate its attainment? A sociogenomic leadership
theory would provide a modern biological framework for inter-
preting genetic research in leadership by encouraging detailed
research questions regarding the mechanisms underlying genetic
and environmental effects found in contemporary behavioral
genetic studies.
Recent interest in and efforts to incorporate biological reason-
ing into management and leadership seem to point to a bright
future. To this end, we have borrowed and elaborated on a the-
oretical model from biology. This is a model that has some
traction in disciplines that have close ties to leadership theory,
Frontiers in Human Neuroscience www.frontiersin.org February 2014 | Volume 8 | Article 84
|
169

Spain and Harms Sociogenomics in organizations
most notably personality psychology. We advocate a move to a
sociogenomic leadership theor y. The perspective offered by this
model shows us that DNA is not always the causal driver of behav-
ior. Environmental conditions interact with genes to build the
biological architecture upon which behavior plays itself out.
REFERENCES
Antonakis, J., Bendahan, S., Jacquart, P., and Lalive, R. (2010). On making causal
claims: a review and recommendations. Leadersh. Q. 21, 1086–1120. doi:
10.1016/j.leaqua.2010.10.010
Arvey, R. D., and Bouchard, T. J. Jr. (1994). Genetics, twins, and organizational
behavior. Res. Organ. Behav. 16, 47–82.
Arvey, R. D., Bouchard, T. J. Jr., Segal, N. L., and Abraham, L. M. (1989). Job satis-
faction: environmental and genetic components. J. Appl. Psychol. 74, 187—192.
doi: 10.1037/0021-9010.74.2.187
Arvey, R. D., Rotundo, M., Johnson, W., Zhang, Z., and McGue, M. (2006). The
determinants of leadership role occupancy: genetic and personality factors.
Leadersh. Q. 17, 1–20. doi: 10.1016/j.leaqua.2005.10.009
Arvey, R. D., Wang, N., Song, Z., and Li, W. (2014). “The biology of leadership,” in
Oxford Handbook of Leadership and Organizations,edD.V.Day(NewYork,NY:
Oxford University Press). (in press).
Arvey, R. D., Zhang, Z., Avolio, B. J., and Krueger, R. F. (2007). Developmental
and genetic determinants of leadership role occupancy among women. J. Appl.
Psychol. 92, 693–706. doi: 10.1037/0021-9010.92.3.693
Arvey, R. D., Zhang, Z., Rotundo, M., and McGue, M. (2004). Leadership in High
School and Employment Settings: A Twin Study of Their Common Determinants
and Interactions. University of Minnesota. (Unpublished manuscript).
Avolio, B. J. (1994). The “natural”: some antecedents to transformational
leadership. Int. J. Public Adm. 17, 1559–1581. doi: 10.1080/019006994085
24956
Avolio, B. J. (2005). Leadership Development in Balance: MADE/born. Mahwah, NJ:
Lawrence Erlbaum Associates.
Avolio, B. J. and Gardner, W. (2005). Authentic leadership development: getting
to the root of positive forms of leadership. Leadersh. Q. 16, 315–338. doi:
10.1016/j.leaqua.2005.03.001
Avolio, B. J., Rotundo, M., and Walumbwa, F. O. (2009). Early life expe-
riences as determinants of leadership role occupancy: the importance of
parental influence and rule-breaking behavior. Leadersh. Q. 20, 329–342. doi:
10.1016/j.leaqua.2009.03.015
Balaban, E. (2006). Cognitive developmental biology: history, process, and for-
tune’s wheel. Cognition 101, 298–332. doi: 10.1016/j.cognition.2006.04.006
Barrick, M. and Mount, M. (1991). The Big Five personality dimensions and
job performance: a meta-analysis. Pers. Psychol. 44, 1–26. doi: 10.1111/j.1744-
6570.1991.tb00688.x
Bass, B. M., and Avolio, B. J. (1991). Multifactor Leadership Questionnaire (Form
5X–Self). Palo Alto, CA: Consulting Psychologists Press.
Beal, D. J., Weiss, H. M., Barros, E., and MacDermid, S. M. (2005). An episodic
process model of affective influences on performance. J. Appl. Psychol. 90,
1054–1068. doi: 10.1037/0021-9010.90.6.1054
Bell, A. M., and Robinson, G. E. (2011). Behavior and the dynamic genome. Science
332, 1161–1162. doi: 10.1126/science.1203295
Ben-Sharar, Y., Robichon, A., Skolowiski, M. B., and Robinson, G. E. (2002).
Influence of gene action across different time scales on behavior. Science 296,
741. doi: 10.1126/science.1069911
Brofenbrenner, U., and Ceci, S. J. (1994). Nature-nurture reconceptualized in devel-
opmental perspective: a bioecological model. Psychol. Rev. 101, 568–586. doi:
10.1037/0033-295X.101.4.568
Buss, D. M. (1995). Evolutionary psychology: a new paradigm for psychological
science. Psychol. Inq. 6, 1–30. doi: 10.1207/s15327965pli0601_1
Buss, D. M., and Penke, L. (2014). “Evolutionary personality psychology,” in
Handbook of Personality Processes and Individual Differences, eds L. Cooper and
R. Larsen (Washington, DC: American Psychological Association). (in press).
Carney, D., Cuddy, A., and Yap, A. (2010). Power posing: brief nonverbal displays
affect neuroendocrine levels and risk tolerance. Psychol. Sci. 21, 1363–1368. doi:
10.1177/0956797610383437
Carver, C. S, Johnson, S. L., and Joorman, J. (2008). Serotonergic functioning,
two-mode models of self-regulation, and vulnerability to depression: what
depression has in common with impulsive aggression. Psychol. Bull. 134,
912–943. doi: 10.1037/a0013740
Caspi, A., McClay, J., Moffitt, T. E., Mill, J., Martin, J., Craig, I. W., et al. (2002).
Role of genotype in the cycle of violence in maltreated children. Sc ience 297,
851–854. doi: 10.1126/science.1072290
Caspi, A., Sugden, K., Moffitt, T. E., Taylor, A., Craig, I. W., Harrington, H., et al.
(2003). Influence of life stress on depression: moderation by a polymorphism in
the 5-HTT gene. Science 301, 386–389. doi: 10.1126/science.1083968
Charney, E. (2012). Behavior genetics and post-genomics (with commentary).
Behav. Brain Sci. 35, 331–410. doi: 10.1017/S0140525X11002226
Day, D. V., Harrison, M. M., and Halpin, S. (2009). An Integrative Approach to
Leader Development: Connecting Adult Development, Identity, and Expertise.
New York, NY: Routledge.
DeNeve,J.-E.,Mikhaylov,S.,Dawes,C.T.,Christakis,N.A.,andFowler,J.H.
(2012). Born to lead? A twin design and genetic association study of leadership.
doi: 10.2139/ssrn.1915939
Dennett, D. C. (1991). Consciousness Explained. New York, NY: Little, Brown and
Company .
de Waal, F. (2000). Chimpanzee Politics. Baltimore, MD: The John Hopkins
University Press.
DeYoung, C. G. (2010). Toward a theory of the Big Five. Psychol. Inq. 21, 26–33.
doi: 10.1080/10478401003648674
Doh, J. P. (2003). Can leadership be taught? Perspectives from management educa-
tors. Acad. Manage. Learn. Educ. 2, 54–67. doi: 10.5465/AMLE.2003.9324025
Donaldson, Z. R., and Young, L. J. (2008). Oxytocin, vaasopressin, and the
neurogenetics of sociality. Science 322, 900–904. doi: 10.1126/science.1158668
Eysenck, H. K. (1967). The Biological Basis of Personality. Springfield, IL: Thomas.
Fallon, J. (2013). The Psychopath Inside: A Neuroscientist’s Personal Journey into the
Dark Side of the Brain. New York, NY: Penguin Books.
Fleeson, W. (2001). Toward a structure- and process-integrated view of personality:
traits as a density distribution of states. J.Pers.Soc.Psychol.80, 1011–1027. doi:
10.1037/0022-3514.80.6.1011
Fleeson, W., and Leicht, C. (2006). On delineating and integrating the study of
variability and stability in personality psychology: interpersonal trust as an
illustration. J. Res. Pers. 40, 5–20. doi: 10.1016/j.jrp.2005.08.004
Fraga, M. F., Ballestar, E., Paz, M. F., Ropero, S., Setien, F., Ballestar, M. L.,
et al. (2005). Epigenetic differences arise during the lifetime of monozy-
gotic twins. Proc. Natl. Acad. Sci. U.S.A. 102, 10604–10609. doi: 10.1073/pnas.
0500398102
Gardner, W. L., and Avolio, B. J. (1998). The charismatic relationship: a dramatur-
gical perspective. Acad. Manage. Rev. 23, 32–58. doi: 10.2307/259098
Goldberg, L. (1993). The structure of phenotypic personality traits. Am. Psychol.
48, 26–34. doi: 10.1037/0003-066X.48.1.26
Gosling, S. D. (2001). From mice to men: what can we learn about personality from
animal research? Psychol. Bull. 127, 45–86. doi: 10.1037//0033-2909.127.1.45
Gosling, S. D. (2008). Personality in non-human animals. Soc. Personal. Psychol.
Compass 2, 985–1001. doi: 10.1111/j.1751-9004.2008.00087.x
Guion, R. (1998). Assessment, Measurement and Prediction for Personnel Decisions.
Mahwah, NJ: Lawrence Erlbaum Associates.
Hare, R. D. (1985). Comparison of procedures for the assessment of psychopathy.
J. Consult. Clin. Psychol. 53, 7–16. doi: 10.1037/0022-006X.53.1.7
Hare, R. D. (1999). Without Conscience: The Disturbing World of Psychopaths among
us.NewYork,NY:GuilfordPress.
Harms, P. D., and Roberts, B. W. (2006). On the Nature of Power Motivation.
University of Nebraska, Lincoln. (Unpublished manuscript).
Harms, P. D., Roberts, B. W., and Wood, D. (2007). Who shall lead? An inte-
grative personality approach to the study of antecedents of status attainment
in informal social organizations. J. Res. Pers. 41, 689–699. doi: 10.1016/j.jrp.
2006.08.001
Harms, P. D., Spain, S. M., and Hannah, S. T. (2011). Leader develop-
ment and the dark side of personality. Leadersh. Q. 22, 495–509. doi:
10.1016/j.leaqua.2011.04.007
Hogan, R. (2007). Personality and The Fate of Organizations. Mahwah, NJ: Lawrence
Erlbaum Assoc.
Ilies, R., Arvey, R. D., and Bouchard, T. J. (2006). Darwinism, behavioral genetics,
and organizational behavior: a review and agenda for future research. J. Organ.
Behav. 27, 121–141. doi: 10.1002/job.351
Ilies, R., Gerhardt, M. W., and Le, H. (2004). Individual differences in lead-
ership emergence: integrating meta-analytic findings and behavioral genetics
Frontiers in Human Neuroscience www.frontiersin.org February 2014 | Volume 8 | Article 84
|
170

Spain and Harms Sociogenomics in organizations
estimates. Int. J. Select. Assess. 12, 207–219. doi: 10.1111/j.0965-075X.2004.
00275.x
Jackson, J. J., Hill, P. L., and Roberts, B. W. (2011). Sociogenomic theory
as an answer to the heritability problem. Eur. J. Pers. 25, 274–276. doi:
10.1002/per.834
Jasny, B. R., Kelner, K. L., and Pennisi, E. (2008). From genes to social behavior.
Science 322, 891. doi: 10.1126/science.322.5903.891
Johnson, A. M., Vernon, P. A., Harris, J. A., and Jang, K. L. (2001). A behavior
genetic investigation of the relationship between leadership and personality.
Twin Res. 7, 27–32. doi: 10.1375/13690520460741417
Johnson, A. M., Vernon, P. A., McCarthy, J. M., Molson, M., Harris, J. A., and Jang,
K. L. (1998). Nature vs. nurture: are leaders born or made? A behavior genetic
investigation of leadership style. Twin Res. 1, 216–233. doi: 10.1375/twin.1.4.216
Kaplan, H. S., and Gangestad, S. W. (2005). “Life history theory and evolutionary
psychology,” in Handbook of Evolutionary Psychology,edD.M.Buss(NewYork,
NY: Wiley), 68–95.
Kempthorne, O. (1978). A Biometrics invited paper: logical, epistemological, and
statistical aspects of nature-nurture data interpretation. Biome trics 34, 1–23.
King, J. E., Weiss, A., and Farmer, K. H. (2005). A chimpanzee (Pan troglodytes)
analogue of cross-national generalization of personality structure: zoological
parks and an African sanctuary. J. Pers. 73, 389–410. doi: 10.1111/j.1467-
6494.2005.00313.x
Krasikova, D., Green, S. G., and LeBreton, J. L. (2013). Destructive leadership: a
theoretical review, integration, and future research agenda. J. Manage. 39, 1308–
1338. doi: 10.1177/0149206312471388
Krueger, R. F., South, S., Johnson, W., and Iacono, W. (2008). The heritability of
personality is not always 50%: gene-environment interactions and correlations
between personality and parenting. J. Pers. 76, 1485–1522. doi: 10.1111/j.1467-
6494.2008.00529.x
Leslie, J. B., and Van Velsor, E. (1996). A Look at Derailment Today: North Amer ica
and Europe. Greensboro, NC: Center for Creative Leadership.
Lord, F., and Novick, M. R. (1968). Statistical Theor y of Mental Test Scores. Reading,
MA: Addison-Welsley.
Maggioncalda, A. N., Czekala, N. M., and Sapolsky, R. M. (2002). Male orangutan
subadulthood: a new twist on the relationship between chronic stress and devel-
opmental arrest. Am.J.Phys.Anthropol.118, 25–32. doi: 10.1002/ajpa.10074
McCrae, R. (2010). The physics and chemistry of personality. Theory Psychol. 19,
670–687. doi: 10.1177/0959354309341928
McCrae, R., and Costa, P. T. (1995). Trait explanation in personalit y psychology.
Eur. J. Pers. Psychol. 9, 231–252. doi: 10.1002/per.2410090402
McCrae, R., and Costa, P. T., Jr. (1996). “Toward a new generation of personal-
ity theories: theoretical contexts for the Five-Factor Model,” in The Five-Factor
Model of Personality: Theoretical Perspectives,edJ.S.Wiggins(NewYork,NY:
Guilford Press), 51–87.
McEwen, B. S., Liston, C., and Morrison, J. H. (2006). Stress-induced
structural plasticity in prefrontal cortex, amygdala and hippocampus.
Neuropsychopharmacology 31:S13.
Meaney, M. J. (2004). “The nature of nurture: maternal effects and chromatin
remodeling,” in Essays in Social Neuroscience,edsJ.T.CacioppoandG.G.
Berntson (Cambridge, MA: The MIT Press), 1–14.
Mehta, P. H., and Gosling, S. D. (2006). “How can animal studies contribute to
research on the biological bases of personality?” in Biology of Personality and
Individual Differences, ed T. Canli (New York, NY: Guilford), 427–448.
Mill, J., Dempster, E., Caspi, A., Williams, B., Moffitt, T., and Craig, I. (2005).
Evidence for monozygotic twin (MZ) discordance in methylation level at
two CpG sites in the promoter region of the catechol-O-methyltr ansferase
(COMT) gene. Am.J.Med.Genet.BNeuropsychiatr.Genet.141, 421–425. doi:
10.1002/ajmg.b.30316
Mischel, W. (1968). Personality and Assessment. Mahwah, NJ: Lawrence Erlbaum &
Associates.
Moskowitz, D. S., Pinard, G., Zuroff, D. C., Annabelle, L., and Young, S. N. (2001).
Theeffectoftryptophanonsocialinteractionineverydaylife:aplacebo-
controlled study. Neuropsychopharmacology 25, 277–289. doi: 10.1016/S0893-
133X(01)00219-6
Mueller, U., and Mazur, A. (1996). Facial dominance of West Point cadets as a
predictor of later military rank. Soc. Forces 74, 823–850. doi: 10.2307/2580383
Nicholson, N. (1998). How hardwired is human behavior? Harv. Bus. Rev . 76,
134–147.
Nicholson, N. (2005). Objections to evolutionary psychology: reflections,
implications, and the leadership exemplar. Hum. Relat. 58, 393–409. doi:
10.1177/0018726705053428
O’Boyle, E. H., Forsyth, D. R., Banks, G. C., and McDaniel, M. A. (2011). A meta-
analysis of the dark triad and work behavior: a social exchange perspective. J.
Appl. Psychol. 97, 557–579. doi: 10.1037/a0025679
Olson, J. M., Vernon, P. A., Harris, J. A., and Jang, K. L. (2001). The heritability of
attitudes: a study of twins. J.Pers.Soc.Psychol.80, 845–860. doi: 10.1037/0022-
3514.80.6.845
Penke, L. (2010). “Bridging the gap between modern evolutionary psychology
and the study of individual differences,” in The Evolution of Personality and
Individual Differences, eds D. M. Buss and P. H. Hawley (New York, NY: Oxford
University Press), 243–279.
Penke, L., Denissen, J. J. A., and Miller, G. F. (2007). The evolutionary genetics of
personality. Eur. J. Pers. 21, 549–587. doi: 10.1002/per.629
Pfeffer, J. (2010). Power: Why Some People Have it and Others Don’t.NewYork,NY:
Harper Business.
Plomin, R., DeFries, J., McClearn, G., and McGuffin, P. (2001). Behavioral Genetics,
4th Edn. NewYork,NY:Freeman.
Ridley, M. (2003). Nature via Nurture: Genes, Experience, and What Makes Us
Human. London: Fourth Estate.
Roberts, B. W. (2006). Personality development and organizational behavior. Res.
Organ. B e hav. 27, 1–40. doi: 10.1016/S0191-3085(06)27001-1
Roberts, B. W., and Caspi, A. (2003). “The cumulative continuity model
of personality development: strinking a balance between continuity and
change in personality traits across the life course,” in Understanding
Human De velopment: Dialogues with Lifespan Psychology, eds U. M
Staudinger and U. Lindenberger (Dordrecht: Kluwer Academic Publishers),
183–214.
Roberts, B. W., and Jackson, J. J. (2008). Sociogenomic personality psychology.
J. Pers. 76, 1523–1544. doi: 10.1111/j.1467-6494.2008.00530.x
Robinson, G. E. (2004). Beyond nature and nurture. Science 304, 397–399. doi:
10.1126/science.1095766
Robinson, G. E., Fernald, R. D., and Clayton, D. F. (2008). Genes and social
behavior. Sc ience 322, 896–900. doi: 10.1126/science.1159277
Robinson, G. E., Grozinger, C. M., and Whitfield, C. W. (2005). Sociogenomics:
a social life in molecular terms. Nat. Rev. Genet. 6, 257–271. doi: 10.1038/
nrg1575
Rutter, M. (2006). Genes and Behavior: Nature–Nurture Interplay Explained.
Mahwah, NJ: Wiley-Blackwell.
Sapolsky, R. M. (2001). A Primate’s Memoirs: A Neuroscientist’s Unconventional Life
Among the Baboons. New York, NY: Touchstone.
Sapolsky, R. M. (2005). The influence of social hierarchy on primate health. Science
308, 648–652. doi: 10.1126/science.1106477
Sokolowski, M. B. (2010). Social interaction in “simple” model systems. Neuron 65,
780–794. doi: 10.1016/j.neuron.2010.03.007
Spain, S. M., Harms, P. D., and LeBreton, J. M. (2014). The dark side of personality
at work. J. Organ. Behav. 35, S41–S60. doi: 10.1002/job.1894
Stearns, S. C. (1992). The Evolution of Life Histories. New York, NY: Oxford.
Stromberg, J. (2013). The Neuroscient ist Who Discovered He was a Psychopath.
Available online at: http://www.smithsonianmag.com/science-nature/the-
neuroscientist-who-discovered-he-was-a-psychopath-180947814/ (Accessed
February 14, 2014).
Tooby, J. and Cosmides, I. (1990). On the universality of human nature and the
uniqueness of the individual: the role of genetics and adaptation. J. Pers. 58,
17–67. doi: 10.1111/j.1467-6494.1990.tb00907.x
Turkheimer, E. (1998). Heritability and biological explanation. Psychol. Rev. 105,
782–791. doi: 10.1037/0033-295X.105.4.782-791
Turkheimer, E. (2000). Three laws of behavioral genetics and what they mean. Curr.
Dir. Psychol. Sci. 9, 160–164. doi: 10.1111/1467-8721.00084
Turkheimer, E., Haley, A., Waldron, M., D’Onofrio, B., and Gottesman,
I. I. (2003). Socioeconomic status modifies the heritability of IQ in
young children. Psychol. Sci. 14, 623–628. doi: 10.1046/j.0956-7976.2003.
psci_1475.x
Van Vugt, M. (2006). Evolutionary origins of leadership and followership. Pers. Soc.
Psychol. Rev. 10, 354–371. doi: 10.1207/s15327957pspr1004_5
Van Vugt, M., and Ahuja, A. (2011). Naturally Selected: The Evolutionary Science of
Leadership. New York, NY: HarperCollins.
Frontiers in Human Neuroscience www.frontiersin.org February 2014 | Volume 8 | Article 84
|
171

Spain and Harms Sociogenomics in organizations
Van Vugt, M., Hogan, R., and Kaiser, R. (2008). Leadership, followership, and evo-
lution: some lessons from the past. Am. Psychol. 63, 182–196. doi: 10.1037/0003-
066X.63.3.182
Waldman, D. A., Balthazard, P. A., and Peterson, S. J. (2011). Leadership
and neuroscience: can we revolutionize the way that inspirational lead-
ers are identified and developed? Acad. Manage. Perspect. 25, 60–74. doi:
10.5465/AMP.2011.59198450
Weaver, I. C., Cervoni, N., Champagne, F. A., D’Alessio, A. C., Charma, S., and
Seckl, J. (2004). Epigenetic programming by maternal behavior. Nat. Neurosci.
7, 847–854. doi: 10.1038/nn1276
Whitfield, C. W., Cziko, A. M., and Robinson, G. E. (2003). Gene expression profiles
in the brain predict behavior in individual honey bees. Sc ience 302, 296–299.
doi: 10.1126/science.1086807
Wilson, E. O. (1975). Sociobiology: The New Synthesis.Cambridge,MA:Harvard
University Press.
Wolff, S. E., and Puts, D. A. (2010). Vocal masculinity as a robust dominance signal
in men. Behav. Ecol. Sociobiol. 64, 1673–1683. doi: 10.1007/s00265-010-0981-5
Wrangham, R. W., and Peterson, D. (1998). De monic Males: Apes and The Origin of
Human Violence. Boston, MA: Houghton-Mifflin.
Zhang, H.-T., Wang, N., Chen, M. Z. Q., Zhou, T., and Zhou, C. (2009a). Effective
leadership in competition. Phys. Soc. ArXiv:0907.1317v1.
Zhang, Z., Ilies, R., and Arvey, R. D. (2009b). Beyond genetic explanations for
leadership: the moderating role of the social environment. Organ. B ehav. Hum.
Decis. Process. 110, 118–128. doi: 10.1016/j.obhdp.2009.06.004
Zhang, T.-Y., and Meaney, M. J. (2010). Epigenetics and environmental regula-
tion of the genome and its function. Annu. Rev . Psychol. 61, 439–466. doi:
10.1146/annurev.psych.60.110707.163625
Zyphur, M. J., Narayana, J., Koh, G., and Koh, D. (2009). Testosterone-status mis-
match predicts collective efficacy in groups: evidence from a slope-as-predictor
multilevel structural equation model. Organ. Behav. Hum. Decis. Process. 110,
70–79. doi: 10.1016/j.obhdp.2009.05.004
Conflict of Interest Statement: The authors declare that the research was con-
ducted in the absence of any commercial or financial relationships that could be
construed as a potential conflict of interest.
Received: 30 November 2013; accepted: 03 February 2014; published online: 25
February 2014.
Citation: Spain SM and Harms PD (2014) A sociogenomic perspective on neuro-
science in organizational behavior. Front. Hum. Neurosci. 8:84. doi: 10.3389/fnhum.
2014.00084
This ar ticle was submitted to the journal Frontiers in Human Neuroscience.
Copyright © 2014 Spain and Harms. This is an open-access article distributed under
the terms of the Creative Commons Attribution License (CC BY). The use, distribu-
tion or reproduction in other forums is permitted, provided the original author(s)
or licensor are credited and that the or iginal publication in this journal is cited, in
accordance with accepted academic practice. No use, distribution or reproduction is
permitted which does not comply with these terms.
Frontiers in Human Neuroscience www.frontiersin.org February 2014 | Volume 8 | Article 84
|
172

ORIGINAL RESEARCH ARTICLE
published: 05 November 2014
doi: 10.3389/fnhum.2014.00792
A face for all seasons: searching for context-specific
leadership traits and discovering a general preference for
perceived health
Brian R. Spisak
1
*
, Nancy M. Blaker
2
, Carmen E. Lefevre
3
, Fhionna R. Moore
4
and Kleis F. B. Krebbers
1
1
Department of Management and Organization, VU University Amsterdam, Amsterdam, Netherlands
2
Department of Social and Organizational Psychology, VU University Amsterdam, Amsterdam, Netherlands
3
Centre for Decision Research, Leeds University Business School, University of Leeds, Leeds, UK
4
School of Psychology, University of Dundee, Dundee, UK
Edited by:
Carl Senior, Aston University, UK
Reviewed by:
David Perrett, University of
St. Andrews, UK
Nicholas O. Rule, University of
Toronto, Canada
*Correspondence:
Brian R. Spisak, Department of
Management and Organization,
VU University Amsterdam,
De Boelelaan 1105, 1081 HV
Amsterdam, Netherlands
e-mail: b.r.spisak@vu.nl
Previous research indicates that followers tend to contingently match particular
leader qualities to evolutionarily consistent situations requiring collective action (i.e.,
context-specific cognitive leadership prototypes) and information processing undergoes
categorization which ranks certain qualities as first-order context-general and others
as second-order context-specific. To further investigate this contingent categorization
phenomenon we examined the “attractiveness halo”—a first-order facial cue which
significantly biases leadership preferences. While controlling for facial attractiveness,
we independently manipulated the underlying facial cues of health and intelligence and
then primed participants with four distinct organizational dynamics requiring leadership
(i.e., competition vs. cooperation between groups and exploratory change vs. stable
exploitation). It was expected that the differing requirements of the four dynamics
would contingently select for relatively healthier- or intelligent-looking leaders. We found
perceived facial intelligence to be a second-order context-specific trait—for instance,
in times requiring a leader to address between-group cooperation—whereas perceived
health is significantly preferred across all contexts (i.e., a first-order trait). The results also
indicate that facial health positively affects perceived masculinity while facial intelligence
negatively affects perceived masculinity, which may partially explain leader choice in some
of the environmental contexts. The limitations and a number of implications regarding
leadership biases are discussed.
Keywords: leadership, prototypes, contingency, categorization, face perception, attractiveness, health, intelligence
INTRODUCTION
Investigating evolved cognitive mechanisms mediating the con-
nection between environmental triggers and leadership emer -
gence is a burgeoning field that works to add a biologically
inspired expansion to tr aditional models of contingent and
implicit leadership (e.g., Fiedler, 1964; Lord et al., 1982; Spisak
et al., 2012). Such research helps to clar ify leadership biases and
their potential impact on everything from voting behavior and
CEO succession outcomes to informal leadership emergence in
local networks. The underlying psychological mechanisms facil-
itating this emergence have been referred to as context-specific
cognitive leadership prototypes (Spisak et al., 2011).
Such psychological adaptations are arguably part of the human
evolutionary trajectory toward increasingly complex social group
strategies as a means to maintain and increase fitness in com-
petitive environments (e.g., Couzin et al., 2005). As groups grow
in size and complexity, costly risks arise in the form of reoccur-
ring coordination problems which select for adaptive solutions—
including leadership (Van Vugt et al., 2008). Indeed, leadership
has been observed across cultures (Brown, 1991) and emerges
with minimal conscious effort (De Cremer and Van Vugt, 2002).
Collective action challenges benefiting from such a social adap-
tation includes the successful management of competition and
cooperation between groups. Poor coordination during compe-
tition can lead to failure in the presence of a raiding out-group
whereas the ability to effectively cooperate between groups can,
in trading situations, reduce the costs of conflict and increase suc-
cess. Further, research on modern organizational behavior has
demonstrated that management efforts to correctly orient a team
either toward competition or cooperation depending on the task
can have a significant impact on performance (Beersma et al.,
2003). Thus, these “raiding vs. trading” dynamics were (and are)
powerful forces in the adaptive landscape of group behavior (e.g.,
Wrangham and Peterson, 1996; Bowles, 2009; Van Vugt, 2009).
There is also the need to effectively divide the investment of
time and energy between finding new resources vs. extracting
rewards from existing resources—known as the “Exploration-
Exploitation Dilemma” in the organizational science literature
(March, 1991) and related to ecological theories such as “Optimal
Foraging Theory” (MacArthur and Pianka, 1966). A balance
Frontiers in Human Neuroscience www.frontiersin.org November 2014 | Volume 8 | Article 792
|
HUMAN NEUROSCIENCE
173

Spisak et al. A face for all seasons
needs to be made where a group must not over-exploit for fear
of becoming obsolete relative to more exploratory groups. On
the other hand, a group must work to competitively capitalize
on an established resource before shifting to more exploratory
alternatives. Effectively managing the exploration-exploitation
dilemma subsequently increases (or decreases) group success—
be it migratory decisions about food or executive strategies in free
markets. As with raiding vs. trading, the pressures of exploration
vs. exploitation appear to have also had an impact on human
evolution. Specific neural mechanisms, occupying distinct sub-
strates, exist for processing information regarding this dilemma
(e.g., Daw et al., 2006 ). Cohen et al. (2007), for instance, report
that this neuromodularity reacts to estimates of uncertainty and
expected utility (i.e., fundamental aspects of the exploration-
exploitation dilemma). Relatedly, McDermott et al. (2008) con-
nects this underlying evolved logic of optimal foraging to the
well-established decision-making assumptions of prospect theory
(Kahneman and Tversky, 1979). Such evidence points to cognitive
systems which have been selected for to solve reoccurring prob-
lems associated with exploring new alternatives vs. exploiting an
established option.
It is argued that (1) leadership (i.e., the ability to influ-
ence others and act as a focal point of coordinated behavior
to achieve group objectives; e.g., Yukl, 2006) is an adaptation
to manage challenges associated with exploration vs. exploita-
tion and competition vs. cooperation and that (2) dealing w ith
these distinct “fitness-relevant” coordination problems over time
has selected for contingent leadership prototypes to aid in the
swift endorsement of appropriate context-specific leaders (see
Spisak et al., 2011). Leadership increases the efficiency and effec-
tiveness of collective action and taking too long to coordinate
or following the wrong leader can severely hinder the fitness-
enhancing value of a social group strategy (Van Vugt et al.,
2008). The skills required to dominate competitors, for exam-
ple, can be a hindrance when attempting to create and maintain
cooperation between groups. In a contemporary context, this
inability to correctly assign leadership may be one of the rea-
sons why researchers find that approximately half of all mergers
and acquisitions fail (Cartwright and Schoenberg, 2006). Some
organizations may simply take a “one size fits all” approach
to leadership and dominant agents m aintain their hierarchical
authority when more prosocial leadership should be allowed to
emerge.
Research on shared leadership, where distributing leadership
across a number of individuals can significantly enhance group
performance (e.g., Carson et al., 2007), provides a clear con-
nection between repetitive organizational challenges and evolved
leader prototypes. Here we aim to understand how evolution
may have shaped our implicit preferences for shared leadership.
Specifically, we are investigating cognitive associations between
the evolutionarily consistent coordination pressures mentioned
above and contingent leader qualities which may have been
selected for as par t of human followership psychology. Such
efforts advance our understanding of contingent decision-making
which consequently helps to maximize the benefits of shared lead-
ership (i.e., selecting the right leader for the situation as opposed
to one size fits all).
To understand this cognitive process one must first consider
how such contingencies are executed to produce leadership emer-
gence. A prominent cue for this purpose is the human face, which
provides a wealth of information about an individual, includ-
ing information about character traits and genetic fitness (Bruce
and Young, 2012). We more specifically know that individuals can
assess leadership success of political candidates better than chance
by mere exposure to their photograph (Todorov et al., 2005),
and children as young as 5 years old can replicate this outcome
(Antonakis and Dalgas, 2009). The latter sample of children (who
are void of political experience) suggests that such judgments have
less to do w ith social stereotypes of politicians and more to do
with a deeper cognitive bias triggered by information embedded
in the face.
The face stores a significant amount of useable data for
context-specific leadership decision-making. Qualities such as
facial femininity or perceived age can have a significant impact on
who followers endorse as a leader in different situations because
these visual signals can serve as a proxy for latent behavioral
potential (e.g., Little et al., 2007). Estrogen levels, for example,
are positively associated with both perceived facial femininity
(Smith et al., 2006) as well as nurturing and affiliative behav-
iors (i.e., tending and befriending; Taylor et al., 2000) suggesting
that the human face can serve as a reliable cue when select-
ing context-specific leaders (e.g., feminine face = tending and
befriending = peace leader). Followers also seem to use a cate-
gorization approach with multiple levels of discrimination (see
Spisak et al., 2012). Followers decide whether in the first-order
a person looks like a leader in general and in the second-order
relies on context-specific cues for decision-making (e.g., feminine
face = peace leader).
A first-order facial cue that appears to generally (and pos-
itively) influence the perception of others is attractiveness—
known as the “attractiveness halo” (see Moore et al., 2011).
Included in this positive halo is leadership endorsement (Verhulst
et al., 2010) and it is therefore important to accurately assess
how this biasing process favoring attra ctive leaders operates.
Employing a contingent categorization approach provides a use-
ful framework for further clarification. The reason being is that
attractiveness is associated with perceived facial health and per-
ceived facial intelligence (see Zebrowitz and Rhodes, 2004)both
of which have been argued to be important traits for leadership
(e.g., Antonakis et al., 2009; Björklund et al., 2013). Thus, we
can split apart the first-order attractiveness halo and search for
context-specific second-order effects of health and intelligence,
thereby expanding the boundary of understanding for both lead-
ership categorization and context-specific cognitive prototyping .
This approach generates a number of relevant questions
regarding implicit leadership processes. For instance, based on
an implicit match between contextual requirements and distinct
qualities associated with cues of intelligence and health, will
leaders who look relatively more intelligent b e favored in situa-
tions where experience or knowledge is more important and will
group members be more likely to follow healthier-looking lead-
ers in physically demanding circumstances? In addition, given
that these cognitive contingencies would have developed over
the course of human evolution, will they still hold in modern
Frontiers in Human Neuroscience www.frontiersin.org November 2014 | Volume 8 | Article 792
|
174

Spisak et al. A face for all seasons
organizational settings? Signals of health are per haps exception-
ally important in dynamics which traditionally required a leader
to exert an increased amount of physical energy such as during
intergroup conflict. However, modern competition does not nec-
essarily require physical action. That said, it appears that despite
such discrepancies competitive environments in business still
tend to select for individuals high in risk-taking and testosterone
(Sapienza et al., 2008) indicating that the underlying contingency
logic and associated leadership prototypes of these coordination
challenges remain intact.
In the current paper we work to further our understand-
ing of leadership by activating contemporary versions of the
coordination problems described above (i.e., competition vs.
cooperation and exploration vs. exploitation) and pairing these
group challenges with faces of potential leaders where first-
order attractiveness is controlled for and the subcomponents
of health and intelligence are independently manipulated. It
is clear that over the course of human evolution, the aggres-
sive nature of competition had a significant physical component
(e.g., Keeley, 1996) and we therefore expect followers to con-
tingently prefer healthier-looking leaders over intelligent-looking
leaders. Conversely, maintaining prosocial cooperation between
groups through tending and befriending strategies such as trust
building and empathy is mentally taxing—demanding both cog-
nitive and emotional processing (Penner et al., 2005). Thus, in
cooperative between-group situations, it is expected that fol-
lowers will contingently prefer intelligent-looking leaders over
healthier-looking leaders. As for exploration vs. exploitation, it
is first important to note that the cognitive adaptations driv-
ing our exploratory vs. exploitative decision-making are relatively
understudied (Cohen et al., 2007) and it is therefore important
to approach cautiously. In groups, ex ploration of new resource
opportunities traditionally required relatively increased physical
output (MacArthur and Pianka, 1966) and as a result we predict
that healthier-looking leaders will be preferred. However, ensur-
ing a group stabilizes and maintains consistent exploitation of an
established resource requires the utilization of existing knowledge
and past experience (e.g., crystalized intelligence; Cattell, 1987)
relative to physical ability and we expect intelligent-looking lead-
ers to contingently match this situation. Finally, followers likely
prefer leaders to be both healthy and intelligent, but by sepa-
rating these subcomponents one can better understand what is
driving the attractiveness halo in leadership decisions and more
accurately model its impact on leadership emergence in diverse
situations.
MATERIALS AND METHODS
PARTICIPANTS
One hundred and 48 participants (79 males, 69 females, M
age
=
33.1, SD = 11.8) completed an online experiment for financial
compensation. The experiment was made using Qualtrics and
distributed to Mturk users w ith Crowdflower. The original dataset
consisted of 191 participants. We deleted participants who did not
complete the experiment, participants who failed a simple reading
test (“This question tests whether you are reading the questions
and answers. Please answer 3”), and participants wh o failed more
than 1 out of 4 manipulation checks (manipulation checks tested
whether participants could identify which scenario they had just
answered questions on).
PROCEDURE
The procedure for the experiment consisted of three separate
tasks. First, the facial stimuli used for testing were created. Second,
business scenarios based on the coordination problems men-
tioned above were developed. These materials were then com-
bined to run the experiment. Finally, the created faces were rated
by two samples on perceived health, intelligence, masculinity, and
attractiveness.
Health and intelligence face morph materials
Stimuli were created using Psychomorph (Tiddeman et al., 2001),
custom built software for the graphical manipulation of facial
photographs. First, we created four base identities, each by com-
bining three individual faces of undergraduate white men who
were all clean shaven and had no glasses or visible jewelry. We
combined faces such that both perceived intelligence and attrac-
tiveness were matched, based on previous ratings of the individual
faces (N = 14 raters). This procedure ensured that differences
between stimuli in perceived health and intelligence were driven
exclusively by our transforms and not by idiosyncratic differences
between stimuli.
Next, each identity was transformed in apparent intelligence.
To this end, high and low apparent intelligence prototypes were
created as described in Moore et al. (2011).Briefly,theseproto-
types were created by regressing ratings of attractiveness, mas-
culinity, health, and perceived age against ratings of perceived
intelligence. The faces with the largest positive and negative resid-
uals (i.e., those who were rated as looking much more or less
intelligent than predicted by their age, attractiveness, masculin-
ity, and health) were “averaged” using Psychomorph software
to create composite high and low perceived intelligence faces.
Subsequently, each base identity was transformed in face shape
by ±50% of the linear shape difference between the high intelli-
gence and low intelligence prototype, yielding 2 versions of each
identity: one high intelligence version and one low intelligence
version. Moderate manipulations of the two versions (i.e., high
and low intelligence) were also created by reducing the transform
to ±25%.
Third, we next transformed b oth the high and low intelli-
gence versions of each identity to be high or low on apparent
health. To this end, we manipulated the skin areas of each face to
appear lower or higher in carotenoid-associated skin coloration,
observed following increased fruit and vegetable consumption
(see Whitehead et al., 2012) and reliably perceived as healthy look-
ing (e.g., Stephen et al., 2009). To simulate an increase in health
appearance we added 4.35 units of yellowness (b
∗
in the CIELab
color space, see Stephen et al., 2009 for details), subtracted 1.1
units of lightness (L
∗
) and added 1.4 units of redness (a
∗
)toall
faces. To simulate a decrease in healthy appearance, the reverse
manipulation was performed. The levels of positive transform
were derived from a previous study, which indicated that on aver-
age, this amount of color change was applied to Caucasian faces
to make them appear most healthy (see Lefevre et al., 2013). In
addition, we created a moderate health transform version, so as
Frontiers in Human Neuroscience www.frontiersin.org November 2014 | Volume 8 | Article 792
|
175
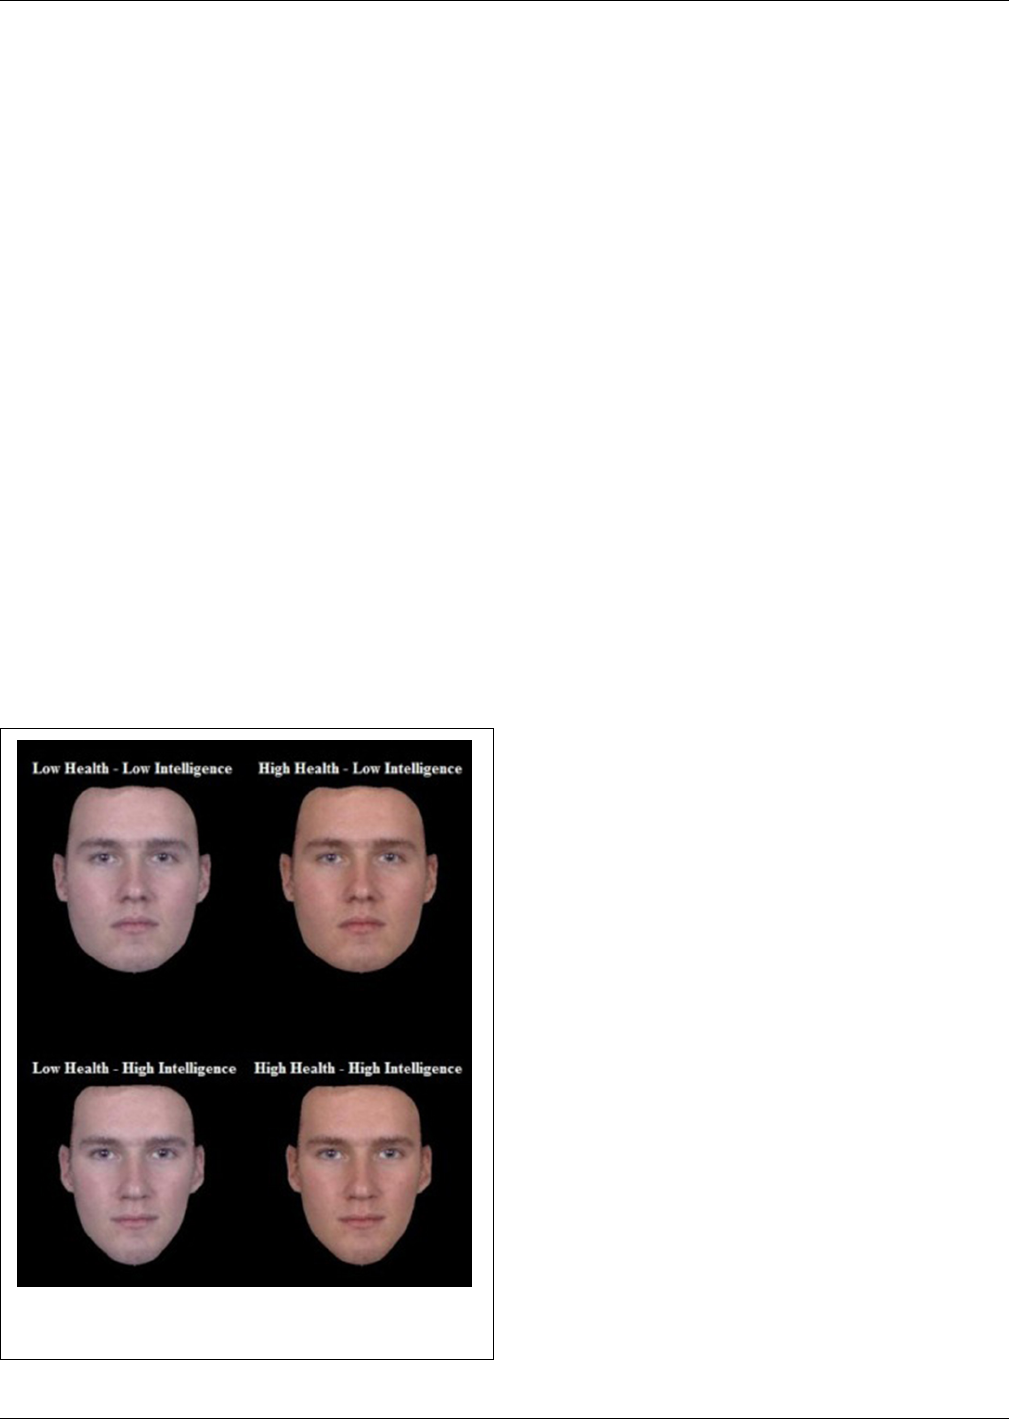
Spisak et al. A face for all seasons
to ensure that the tr ansform would be more closely aligned in
magnitude with the two levels of the intelligence transform. To
this end, we halved the amount of color added and subtracted, in
other words, we added 2.18 units of b
∗
, subtracted 0.55 units of
L
∗
and added 0.7 units of a
∗
to each face to create the medium
level healthy face. The medium level unhealthy face was created
by reversing this manipulation.
To sum up the procedure, facial shape was first adjusted to alter
perceptions of intelligence, creating hig h intelligence (Hi) and low
intelligence (Li) versions of the base faces. Next, the coloration of
Hi and Li facial images where manipulated to create high health
(Hh) and low health (Lh) version. This process yielded four face
types (i.e., HiHh, LiLh, HiLh, and LiHh; Figure 1). To exam-
ine possible thresholds for perceiving difference between health
and intelligence we also created medium and strong versions
of the four face types by adjusting the transform percentages.
Images were then cropped to the outer boundaries of the face.
The transforms thus created a total of 32 faces. Four different male
composite base faces, of which each had four health/intelligence
versions (HiHh, LiLh, HiLh, and LiHh), all of which had a 25%
and a 50% transform version (4 ∗ 4 ∗ 2 = 32).
Experimental procedure
The next step was to pair the face types with business scenar-
ios based on the four coordination dynamics identified in the
introduction (i.e., competition, cooperation, exploration, and
exploitation; see Supplemental Materials for the scenarios). The
objective was to investigate which subcomponent of attractiveness
FIGURE 1 | Example of the four face types created by independently
manipulated high and low signals of health and intelligence.
(i.e., health or intelligence) would be preferred in each coordina-
tion dynamic. To a ccomplish this, each scenario was presented
one at a time with one male base face in all possible paired com-
binations of the four face types presented below, six combinations
in total (e.g., HiHh vs. LiLh, HiLh vs. LiHh). We counterbal-
anced which male base face was paired with which scenario, and
also counterbalanced the order in which the different scenarios
and different male base faces were presented. Per scenario, par-
ticipants thus chose their preferred leader out of two faces (both
coming from the same base face but transformed differently) six
times. Each participants made 24 (6 combinations
∗
4 scenarios)
leadership decisions, either with a transform level of 25%, or a
transform level of 50% (transform level varied between subjects).
The scenario appeared at the top of the screen and the partic-
ipant was presented with the first pair of faces and asked to vote
for the face they would prefer as a leader for the depicted scenario
(i.e., forced-choice pairing). Once a decision was made, the next
face pair would appear below the scenario and the participant
would make another leader choice. This procedure continued
until all six paired face combinations had been displayed with
the scenario. Then the scenario would switch and the procedure
would repeat until a decision for all face combinations were made
for all four scenarios. Scenarios, face pairings, and side of the
monitor where the face appeared were randomized to control
for order effects. Scenario and assigned faces were randomized to
control for idiosyncratic effects of any one particular face paired
with any one scenario. Following the leadership selection task,
participants explicitly rated the faces on perceived health, intel-
ligence, attractiveness, and masculinit y (e.g., “This person looks
attractive,” 1 = strongly disagree,10= strongly agree). The exper-
imental design was approved by the ethics committee at the VU
University Amsterdam. Before the experiment informed consent
was obtained and following the tasks participants were thanked
and debriefed.
RESULTS
RATINGS OF HEALTH, INTELLIGENCE, AND ATTRACTIVENESS
In order to get some insight into how the faces were perceived,
we had all faces rated on health, intelligence, masculinity, and
attractiveness, by two samples. All ratings were performed on
a scale ranging from 1 (strongly disagree)to10(strongly agree).
Thefirstsample(N = 105, 69 female/36 male, M
age
= 36.46,
SD
age
= 12.69) collected via MTurk performed the face ratings
separately before we conducted the actual main study, and thus
did not complete any other parts of the experiment (i.e., they did
not choose leaders for different scenarios). This first sample orig-
inally consisted of 118 participants—those who failed a reading
test or a manipulation check (“What gender were faces in this
experiment?”) were deleted from the dataset. The second sample
consisted of the 148 participants of the actual experiment (who
performed the ratings after they had completed the leadership
selection task in all four scenarios).
Tabl es 1, 2 summarize the mean ratings of health, intelligence,
attractiveness, and masculinity per manipulation. The r atings in
the high health columns of Tab les 1, 2 are the average ratings
of perceived health of the two face types with high health trans-
forms (i.e., HiHh and LiHh), while the ratings in the low health
Frontiers in Human Neuroscience www.frontiersin.org November 2014 | Volume 8 | Article 792
|
176

Spisak et al. A face for all seasons
Table 1 | Sample 1 (N = 105) Ratings of high health vs. low health
faces, and ratings of high intelligence vs. low intelligence
faces—Means, SDs, t-tests, and Cohen’s Ds.
High Health Low Health Difference
Health 6.56 (1.77) 6.28 (1.81) t = 3.81, p < 0.001*,
d = 0.37
Intelligence 6.09 (1.57) 5.88 (1.61) t = 4.08, p < 0.001
*,
d = 0.40
Attractiveness 5.34 (1.84) 5.10 (1.91) t = 3.53, p = 0.001
*,
d = 0.34
Masculinity 6.60 (1.98) 6.41 (2.13) t = 2.91, p = 0.004
*,
d = 0.28
High Low Difference
Intelligence Intelligence
Health 6.54 (1.72) 6.30 (1.88) t = 2.89, p = 0.005*,
d = 0.45
Intelligence 6.17 (1.57) 5.80 (1.66) t = 4.62, p < 0.001
*,
d = 0.28
Attractiveness 5.36 (1.86) 5.07 (1.92) t = 3.51, p = 0.001
*,
d = 0.34
Masculinity 6.41 (2.06) 6.60 (2.07) t =−2.35, p = 0.020,
d =−0.23
*
p remains <0.05 after adjusting for multiple comparisons (Bonferroni
correction).
columns are the average ratings of perceived health of the two
face types with low health transforms (i.e., LiLh and HiLh). The
same goes for the high and low intelligence columns—under high
intelligence are the average ratings from the two transforms of
the high intelligence faces (i.e., HiHh and HiLh), and under low
intelligence are the average ratings from the two transforms of
the low intelligent faces (i.e., LiLh and LiHi). These scores are
the average of the 25% and 50% transforms—if the main anal-
ysis shows that transform strength affects how our manipulations
influence leader selection, we planned to revisit the ratings sep-
arately for the 25% and the 50% transforms. The ratings show
that the high health faces are indeed perceived healthier than the
low health faces, and that the high intelligence faces are seen
as higher in intelligence than the low intelligence faces, as the
manipulations intended. However, other cues are also affected
by the health and intelligence manipulations. For instance, par-
ticipants rate the high health and high intelligence faces higher
on attr activeness than the low health and low intelligence faces.
Additionally, the high health faces are perceived as more mas-
culine than the low health faces, whereas intelligence has the
opposite effect—the low intelligent faces are seen as more mas-
culine than the high intelligent faces. Most effects of the health
and intelligence manipulations on ratings are of small to medium
size (as denoted by Cohen’s D), with a notable exception of a
larger effect of the health manipulation on perceived health in
the second sample. A preference for a high health face over a low
health face, and a preference for a high intelligence face over a
low intelligence face, may thus be explained by a combination
of subjective perceptions of health, intelligence, masculinity, and
attractiveness.
Table2|Sample2(N = 148) Ratings of high health vs. low health
faces, and ratings of high intelligence vs. low intelligence
faces—Means, SDs, t-tests, and Cohen’s Ds.
High Health Low Health Difference
Health 7.37 (1.59) 6.49 (2.01) t = 8.17, p < 0.001*,
d = 0.67
Intelligence 7.00 (1.65) 6.81 (1.77) t = 2.47, p = 0.015,
d = 0.20
Attractiveness 6.14 (2.01) 5.63 (2.15) t = 5.95, p < 0.001
*,
d = 0.30
Masculinity 7.34 (1.76) 7.03 (1.95) t = 3.84, p < 0.001
*,
d = 0.32
High Low Difference
Intelligence Intelligence
Health 7.15 (1.75) 6.70 (1.99) t = 3.34, p = 0.001*,
d = 0.27
Intelligence 7.09 (1.80) 6.71 (1.79) t = 3.13, p = 0.002
*,
d = 0.26
Attractiveness 6.15 (2.18) 5.63 (2.20) t = 3.69, p < 0.001
*,
d = 0.30
Masculinity 6.98 (1.97) 7.39 (1.96) t =−3.11, p = 0.002
*,
d =−0.26
*
p remains <0.05 after adjusting for multiple comparisons (Bonferroni
correction).
It is also interesting to consider the different perceptions of the
two opposed-combination faces, i.e., the low intelligence but high
health face (LiHh), and the high intelligence but low health face
(HiLh). First, the high health but low intelligence face is perceived
as more masculine in both samples [sample 1 − t
(104)
= 3.60, p <
0.001, d = 0.35, sample 2 − t
(147)
= 4.91, p < 0.001, d = 0.40].
Second, while the low health but high intelligence face is rated
more intelligent than the low intelligence but high health face in
both samples [sample 1 − t
(104)
=−2.03, p = 0.045, d =−0.20,
sample 2 − t
(147)
=−1.22, p = 0.225, d =−0.10], the difference
is only significant in the first sample. Third, the high health but
low intelligence face is rated more healthy in the second sample,
but there is no difference in ratings between the two face types
concerning health ratings in the first sample [sample 1 − t
(104)
=
0.35, p = 0.730, d = 0.03, sample 2 − t
(146)
= 2.42, p = 0.017,
d = 0.20]. Finally, there is no difference in perceived attractive-
ness between the high health but low intelligence face, and the
low health but high intelligence face (sample 1 and 2-t < 1, p =
ns). A preference for one of these opposed-combination face types
over the other will thus not be driven by a difference in attractive-
ness, but may be guided by perceptions of health, intelligence, and
masculinity.
PREDICTING LEADER SELECTION BY HEALTH AND I NTELLIGENCE
To analyze the data we utilized a version of the Bradley-Terry
Model which uses a log-linear approach to account for the depen-
dence between multiple paired comparisons from a given set of
objects (Dittrich et al., 2002). This statistical technique allowed
us to analyze voting preferences for each face-type separately (i.e.,
Frontiers in Human Neuroscience www.frontiersin.org November 2014 | Volume 8 | Article 792
|
177

Spisak et al. A face for all seasons
HiHh, LiLh, HiLh, and LiHh) while accounting for the inter-
dependency of multiple paired comparisons within participants.
Subsequently, we were able generate a 2 × 2 design to investigate
main effects of intelligence (high vs. low) and health (hig h vs.
low). We combined the 25% and 50% transforms for the anal-
yses, with the plan to revisit the two transform levels separately
should the analysis show that transform level affects results.
On average (taken across all 4 scenarios), health had a sig-
nificant positive effect on leader selection [Wald χ
2
(df = 1)
=
136.30, p < 0.001], as did intelligence [Wald χ
2
(df = 1)
= 26.51,
p < 0.001]. There were no significant main effects of partici-
pant gender [Wald χ
2
(df = 1)
= 2.587, p = 0.108], scenario [Wald
χ
2
(df = 1)
= 0.005, p > 0.999], or manipulation strength [Wald
χ
2
(df = 1)
= 0.015, p = 0.901] on leader selection.
Health was a significant predictor of leadership ratings in
all four scenarios; in cooperation [Wald χ
2
(df = 1)
= 22.01, p <
0.001], competition [Wald χ
2
(df = 1)
= 38.00, p < 0.001], explo-
ration [Wald χ
2
(df = 1)
= 32.42, p < 0.001], and exploitation
[Wald χ
2
(df = 1)
= 36.10, p < 0.001). On the other hand, intelli-
gence led to an increase in leader selection in the exploration con-
dition [Wald χ
2
(df = 1)
= 24.06, p < 0.001), along with an increase
in the cooperation condition [Wald χ
2
(df = 1)
= 19.24, p < 0.001),
but had no positive effect on leader selection in the competi-
tion [Wald χ
2
(df = 1)
= 0.18, p = 0.674] or exploitation conditions
[Wald χ
2
(df = 1)
= 0.73, p = 0.434]. Overall, health thus had a
positive effect on leader selection in all four scenarios, while intel-
ligence only showed this effect in the exploration and cooperation
conditions.
Because we summed across the medium and strong manip-
ulation in the above analyses, we wanted to make sure that there
were no interactions of manipulation strength w ith intelligence or
health on leader selection; a significant interaction would imply
we need to look at the medium and strong manipulation con-
ditions separately. We performed another analysis across all 4
scenarios together, adding the interaction terms (manipulation
strength
∗
intelligence, and manipulation strength
∗
health) to
the model. There was no significant interaction between health
and manipulation strength on leader selection [Wald χ
2
(df = 1)
=
0.019, p = 0.890], and no interaction between intelligence and
manipulation strength on leader selection [Wald χ
2
(df = 1)
=
1.089, p = 0.297].
Health vs. intelligence
We then wanted to see whether one cue had a stronger effect
on decision making than the other. Health was the stronger pre-
dictor for the exploration scenario [t
(148)
= 2.241, p = 0.013],
the exploitation scenario [t
(148)
= 4.336, p < 0.001), and the
competitive scenario [t
(148)
= 5.099, p < 0.001]. There was no
significant difference in predictor strength between health and
intelligence in the cooperation scenario. [t
(148)
= 1.306, p =
0.192). Finally, health had an overall stronger effect on leadership
ratings than intelligence [t
(148)
= 7.027, p < 0.001].
Comparing predictors across scenarios
We next tested whether health and intelligence had a stronger
effect in one scenario relative to another. We were interested
in two particular comparisons: the effects of health and intel-
ligence in the competitive vs. the cooperative scenario—tested
by combining the data of these two scenarios and testing the
interaction between health/intelligence and scenario on leader
selection—and the effects of health and intelligence in the explo-
ration vs. exploitation scenario—again, tested by combining the
data of these two other scenarios and testing the interaction
between health/intelligence and scenario on leader selection. As
expected, intelligence was a stronger predictor in the coopera-
tion scenario than in the competition scenario [Wald χ
2
(df = 1)
=
18.796, p < 0.001). However, contrary to expectations, intelli-
gence was a stronger predictor in the exploration scenario than
in the exploitation scenario [Wald χ
2
(df = 1)
= 12.154, p < 0.001].
Results also showed that health was an equally strong predictor
in the cooperation vs. the competition scenario [Wald χ
2
(df = 1)
=
1.213, p = 0.271], and also did not differ in strength in the
exploration vs. the exploitation scenario [Wald χ
2
(df = 1)
= 0.382,
p = 0.537].
Tabl e 3 givesanoverviewofhowoftenparticipantschosea
high health face over a low health face, and how often partic-
ipants chose a high intelligent face over a low intelligent face,
across all trials. In line with the main results, these percentages
show that while there are some scenarios where high intelligence
faces are only favored slightly above chance (i.e., competition and
exploitation), the high health faces are always preferred well above
chance.
DISCUSSION
To summarize, health and intelligence both influenced leader
selection, but the health cue (facial color) was clearly more influ-
ential than the intelligence cue (facial structure) in our scenarios.
Health was an influential cue across all scenarios, while intel-
ligence only had an effect in half of the presented scenarios.
Overall, health was a significantly stronger predictor of leader
selection than intelligence, except for in the cooperation context,
where intelligence and health were predictors of similar strength.
Our results indicate a stronger general preference for health vs.
intelligence when selecting leaders across context.
As for our hypotheses, we found mixed support. In leader
selection, cues of intelligence, as expected, were preferred more
often in cooperation vs. competition whereas perceived health
Table 3 | Percentages of choices for high health faces over low health faces and choices for high intelligence faces over low intelligence faces.
Overall (%) Competition (%) Cooperation (%) Exploration (%) Exploitation (%)
High Health wins from Low Health 69.4 68.7 67.3 71.9 69.8
High Intelligence wins from Low Intelligence 63.8 53.7 70.1 73.1 58.0
Frontiers in Human Neuroscience www.frontiersin.org November 2014 | Volume 8 | Article 792
|
178

Spisak et al. A face for all seasons
was significantly favored across all four coordination problems.
As for exploration vs. exploitation, to date, it has had limited
research attention in the behavioral and brain sciences (Cohen
et al., 2007) and future research may provide insights into whether
our initial predictions regarding prototypical contingencies are
accurate. Overall, our findings suggest that although intelligence
may be important for leadership in certain circumstances, health
(represented by facial coloration based on increased carotenoid
pigmentation) appears to dominate decision making in all con-
texts of leadership. In terms of categorization, this means that
leaders relatively high in perceived intelligence have a second-
order, contextually-bound advantage—such as in times requiring
between-group cooperation—whereas healthier-looking leaders
perhaps have a context-gener al, first-order advantage across a
diverse landscape of leadership situations. This aligns with recent
work suggesting that the activation of “disease concerns” in the
environment exacerbates the voting tendency to prefer attractive
political candidates. Attractiveness is in part driven by cues to
health and healthy leaders are likely to be exceptionally important
when disease threatens the viability of the group (White et al.,
2013). Adding to this, our data indicates that with or without
specific pathogen threats health is generally an important factor
when selecting leaders.
While the facial health and intelligence manipulations pre-
dictably affected participants’ ratings of perceived health and
intelligence, it is important to note that the manipulations also
affected perceptions on other dimensions, such as attractive-
ness and masculinity. It is apparent from our results that our
transforms did change perceptions of attractiveness. However,
this was the objective of our research (i.e., to assess which spe-
cific dimensions of attractiveness affect leadership perception).
We also note in our results that perceptions of attractiveness
did not significantly differ between high intelligence but low
health and low intelligence but high health faces (i.e., HiLh vs.
LiHh). Further more, while our transforms did also affect per-
ceived masculinity this effect likely does not entirely explain our
main effects of health and intelligence on leadership choice for
the following reason: Increased health and increased intelligence
positively affected leadership perceptions; however, masculinity
ratings increased in the high health transform but decreased in
the high intelligence transform. Also, while we can conclude from
our data that increased facial carotenoid pigmentation—a mar ker
for physical health—increases whether someone is preferred as
aleader,wehavetobemorecarefulwithdrawingstrongcon-
clusions about how facial intelligence affects leader preference.
Whereas facial coloration is an objective cue for health, our intelli-
gence manipulation is based on subjective p erceptions of low and
high intelligence. This subjective intelligence transform may actu-
ally be a reflection of other objective cues which were more salient
to the participants such as, in this case, facial masculinity (i.e., our
low intelligence faces may actually have more masculine features
than the high intelligence faces). Thus a better understanding of
the relationship between facial masculinity and perceived intelli-
gence is an important next step for drawing a sound conclusion
about facial intelligence and leadership preferences.
The ratings of faces high in one positive cue but low in another
positive cue—i.e., HiLh vs. LiHh—have additional implications.
The ratings from two separate samples suggest that picking up on
a high health cue (facial coloration) seems more difficult when
the facial structure is characteristic of low intelligence, and vice
versa, picking up on cues for high intelligence seems more diffi-
cult when there is a clear competing cue for low health. However,
when a face has low intelligence combined with high health facial
coloration, perceptions of masculinity are particularly enhanced.
These results demonstrate how a facial cue can have different
effects when combined with other cues, and that novel per-
ceptions may arise from a specific combination of cues—an
interesting avenue for future research.
Like much previous research, our results demonstrate that
morphological cues can guide decision making when it comes
to leadership. From an organizational science perspective, this
means that, for instance, leadership succession planning, exter-
nal hiring of managers and executives, and general willingness
to follow a leader are likely biased by a variety of such cues. We
must then account for these biases and work with or around such
cognitive shortcuts. As an example, a relatively healthy-looking
leader may have a better chance of gaining sufficient levels of
followership investment to initiate change. On the other hand,
a potential leader who looks relatively less healthy may be over-
looked even if they are better suited for the job—the difference
between emergence and effectiveness.
There are also a number of limitations to the current study
that deserves mentioning. First, leadership selection for the
exploration-exploitation dilemma needs further development.
Continued effort is necessary to identify and match the con-
tingent leadership traits associated with both exploration and
exploitation. Second, intelligence is a somewhat broad concept.
The difference between fluid and crystallized intelligence (i.e., the
ability to develop novel solutions to novel problems vs. the abil-
ity to use acquired knowledge, skills, and experience; e.g., Cattell,
1987) are perhaps best suited for exploration vs. exploitation,
respectively. Future work should investigate perceptual differ-
ences between these types of intelligence. Existing research on
the developmental differences between fluid vs. crystallized intel-
ligence (e.g., Horn and Cattell, 1967) suggests that facial cues
of age may serve as a proxy when perceptually attributing these
two typ es of intelligence (i.e., young = fluid and old = crys-
tallized) and, as a consequence, this could create a contingent
match between young exploration leaders and old exploitation
leaders. Fur ther use of the contingent categorization approach
can provide a framework for constructing a network of first-
and second-order cues and how they shift in importance across
context. Finally, the scenarios used in this study, designed to
represent situations characterized by cooperation, competition,
exploration, or exploitation, had some specific details which may
have affected decision making. For instance, the between group
competition scenario may have elicited a par ticularly individual-
level focus (the situation concerned everyone, but “especially
you”),whilethebetweengroupcooperationscenariomayhave
also enhanced stronger feelings of group identification (the focus
here is on “your colleagues,” and not on “especially you”) due
to wording of the scenarios. Replication of our main results
with different scenarios is necessary to test how robust these
results are.
Frontiers in Human Neuroscience www.frontiersin.org November 2014 | Volume 8 | Article 792
|
179

Spisak et al. A face for all seasons
A modern version of implicit leadership categorization that
contingently considers the dynamics of fitness-relevant situations
is an effective approach for understanding why certain leaders
emerge when they do. Our results demonstrate that when one
attempts to split apart perceived facial attractiveness into second-
order categories they immediately discover a general preference
for health, characterized by facial coloration, when selecting
leaders. Thus health is a first-order categorization variable that
initially biases us to perceive a potential candidate as a leader in
general or not. This adds an attractive twist to research on beauty
and its impact on followers.
SUPPLEMENTARY MATERIAL
The Supplementary Material for this article can be found
online at: http://www.frontiersin.org/journal/10.3389/fnhum.
2014.00792/abstract
REFERENCES
Antonakis, J., Ashkanasy, N. M., and Dasborough, M. T. (2009). Does lead-
ership need emotional intelligence? Leadership Quart. 20, 247–261. doi:
10.1016/j.leaqua.2009.01.006
Antonakis, J., and Dalgas, O. (2009). Predicting elections: childs play! Science 323,
1183. doi: 10.1126/science.1167748
Beersma, B., Hollenbeck, J. R., Humphrey, S. E., Moon, H., Conlon, D. E., and
Ilgen, D. R. (2003). Cooperation, competition, and team performance: toward
a contingency approach. Acad. Manage. J. 46, 572–590. doi: 10.2307/30040650
Björklund, C., Lohela-Karlsson, M., Jensen, I., and Bergström, G. (2013).
Hierarchies of health: health and work-related stress of managers in munici-
palities and county councils in sweden. J. Occup. Environ. Med. 55, 752–760.
doi: 10.1097/JOM.0b013e318295681c
Bowles, S. (2009). Did warfare among ancestral hunter–gatherers affect the evo-
lution of human social behavior? Science 324, 1293–1298. doi: 10.1126/sci-
ence.1168112
Brown, D. E. (1991). Human Universals.NewYork,NY:McGraw-Hill.
Bruce, V., and Young, A. W. (2012). Face Perception. London: Psychology Press.
Carson, J. B., Tesluk, P. E., and Marrone, J. A. (2007). Shared leadership in teams:
an investigation of antecedent conditions and performance. Acad. Manage. J. 50,
1217–1234. doi: 10.2307/20159921
Cartwright, S., and Schoenberg, R. (2006). Thirty years of mergers and acquisitions
research: recent advances and future opportunities. Br. J. Manage. 17, S1–S5.
doi: 10.1111/j.1467-8551.2006.00475.x
Cattell, R. B. (1987). Intelligence: its Structure, Growth and Action: its St ructure,
Growth and Action. Amsterdam: Elsevier Science Publishers B.V.
Cohen, J. D., McClure, S. M., and Yu, A. J. (2007). Should i stay or should i go? how
the human brain manages the trade-off between exploitation and exploration.
Philos. T. R. Soc. 362, 933–942. doi: 10.1098/rstb.2007.2098
Couzin, I. D., Krause, J., Franks, N. R., and Levin, S. A. (2005). Effective leadership
and decision-making in animal groups on the move. Nature 434, 513–516. doi:
10.1038/nature03236
Daw, N. D., O’Doherty, J. P., Dayan, P., Seymour, B., and Dolan, R. J. (2006).
Cortical substrates for exploratory decisions in humans. Nature 441, 876–879.
doi: 10.1038/nature04766
De Cremer, D., and Van Vugt, M. (2002). Intergroup and intragroup aspects of
leadership in social dilemmas: a relational model of cooperation. J. Exp. Soc.
Psychol. 38, 126–136. doi: 10.1006/jesp.2001.1499
Dittrich, R., Hatzinger, R., and Katzenbeisser, W. (2002). Modelling dependencies
in paired comparison data: a log-linear approach. Comput. Stat. Data An. 40,
39–57. doi: 10.1016/S0167-9473(01)00106-2
Fiedler, F. E. (1964). A contingency model of leadership effectiveness. Adv . Exp. Soc.
Psychol. 1, 149–190. doi: 10.1016/S0065-2601(08)60051-9
Horn, J. L., and Cattell, R. B. (1967). Age differences in fluid and crystallized
intelligence. Acta Psychol. 26, 107–129. doi: 10.1016/0001-6918(67)90011-X
Kahneman, D., and Tversky, A. (1979). Prospect theory: an analysis of decision
under risk. Econometrica 263–291. doi: 10.2307/1914185
Keeley, L. H. (1996). Warfare Before Civilization: the Myth of the Peaceful Savage.
Oxford: Oxford University Press.
Lefevre, C. E., Ewbank, M. P., Calder, A. J., von dem Hagen, E., and Perrett, D. I.
(2013). It is all in the face: carotenoid skin coloration loses attractiveness outside
the face. Biol. Lett. 9:20130633. doi: 10.1098/rsbl.2013.0633
Little, A. C., Burriss, R. P., Jones, B. C., and Roberts, S. C. (2007). Facial
appearance affects voting decisions. Evol. Hum. Behav. 28, 18–27. doi:
10.1016/j.evolhumbehav.2006.09.002
Lord, R. G., Foti, R. J., and Phillips, J. S. (1982). “A theory of leadership categoriza-
tion,” in Leadership: Beyond Establishment Views, eds J. G. Hunt, U. Sekaran, and
C. A. Schriesheim (Carbondale: Southern Illinois University Press), 104–121.
MacArthur, R. H., and Pianka, E. R. (1966). On optimal use of patchy environment.
Am. Nat. 100, 603–609. doi: 10.1086/282454
M
ar
ch, J. P. (1991). Exploration and exploitation in organizational learning. Organ.
Sci. 2, 71–87. doi: 10.1287/orsc.2.1.71
McDermott, R., Fowler, J. H., and Smirnov, O. (2008). On the evolu-
tionaryoriginofprospecttheorypreferences.J. Polt. 70, 335–350. doi:
10.1017/S0022381608080341
Moore, F. R., Filippou, D., and Perrett, D. I. (2011). Intelligence and attractiveness
in the face: beyond the attractiveness halo effect. J. Evol. Psychol. 9, 205–217. doi:
10.1556/JEP.9.2011.3.2
Penner, L. A., Dovidio, J. F., Piliavin, J. A., and Schroeder, D. A. (2005).
Prosocial behavior: multilevel perspectives. Annu. Rev. Psychol. 56, 365–392. doi:
10.1146/annurev.psych.56.091103.070141
Sapienza, P., Zingales, L., and Maestripieri, D. (2008). Gender differences in finan-
cial risk aversion and career choices are affected by testosterone. Proc. Natl. Acad.
Sci. U.S.A. 106, 15268–15273. doi: 10.1073/pnas.0907352106
Smith, M. L., Perrett, D. I., Jones, B. C., Cornwell, R. E., Moore, F. R., Feinberg, D.
R., et al. (2006). Facial appearance is a cue to oestrogen levels in women. Proc.
Biol. Sci. 273, 135–140. doi: 10.1098/rspb.2005.3296
Spisak, B. R., Dekker, P. H., Krüger, M., and Van Vugt, M. (2012). Warriors
and peacekeepers: testing a biosocial implicit leadership hypothesis of inter-
group relations using masculine and feminine faces. PLoS ONE 7:e30399. doi:
10.1371/journal.pone.0030399
Spisak, B. R., Homan, A. C., Grabo, A., and Van Vugt, M. (2012). Facing the
situation: testing a biosocial contingency model of leadership in intergroup rela-
tions using masculine and feminine faces. Leadership Quart. 23, 273–280. doi:
10.1016/j.leaqua.2011.08.006
Spisak, B. R., Nicholson, N., and Van Vugt, M. (2011). “Leadership in organiza-
tions: an evolutionary perspective,” in Evolutionary Psychology in the Business
Sciences, ed G. Saad (Heidelberg: Springer), 165–190.
Stephen, I. D., Law-Smith, M. J., Stirrat, M. R., and Perrett, D. I. (2009). Facial skin
coloration affects perceived health of human faces. Int. J. Primatol. 30, 845–857.
doi: 10.1073/pnas.0907352106
Taylor, S. E., Klein, L. C., Lewis, B. P., Gruenewald, T. L., Gurung, R. A., and
Updegraff, J. A. (2000). Biobehavioral responses to stress in females: tend-
and-befriend, not fight-or-flight. Psychol. Rev . 107, 411–429. doi: 10.1037/0033-
295X.107.3.411
Tiddeman, B. P., Perrett, D. I., and Burt, D. M. (2001). Prototyping and transform-
ing facial textures for perception research. IEEE. Comput. Graph. 21, 42–50. doi:
10.1109/38.946630
Todorov, A., Mandisodza, A. N., Goren, A., and Hall, C. C. (2005). Inferences of
competence from faces predict election outcomes. Scie nce 308, 1623–1626. doi:
10.1126/science.1110589
Van Vugt, M. (2009). Despotism, democracy and the evolutionary dynamics of
leadership and followership. Am. Psychol. 64, 54–56. doi: 10.1037/a0014178
Van Vugt, M., Hogan, R., and Kaiser, R. B. (2008). Leadership, followership, and
evolution: some lessons from the past. Am. Psychol. 63, 182. doi: 10.1037/0003-
066X.63.3.182
Verhulst, B., Lodge, M., and Lavine, H. (2010). The attractiveness halo: why some
candidates are perceived more favorably than others. J. Nonverbal. Behav. 34,
111–117. doi: 10.1007/s10919-009-0084-z
White, A. E., Kenrick, D. T., and Neuberg, S. L. (2013). Beauty at the ballot box:
disease threats predict preferences for physically attractive leaders. Psychol. Sci.
24, 2429–2436. doi: 10.1177/0956797613493642
Whitehead, R. D., Re, D., Xiao, D., Ozakinci, G., and Perrett, D. I. (2012). You
are what you eat: within-subject increases in fruit and vegetable consumption
confer beneficial skin-color changes. PLoS ONE 7:e32988. doi: 10.1371/jour-
nal.pone.0032988
Wrangham, R. W., and Peterson, D. (1996). Demonic Males: Apes and the Origins of
Human Violence. Boston: Houghton Mifflin.
Frontiers in Human Neuroscience www.frontiersin.org November 2014 | Volume 8 | Article 792
|
180

Spisak et al. A face for all seasons
Yukl, G. (2006). Leadership in Organizations. New Jersey, NJ: Pearson-Prentice Hall.
Zebrowitz, L. A., and Rhodes, G. (2004). Sensitivity to “bad genes” and the
anomalous face overgeneralization effect: cue validity, cue utilization, and
accuracy in judg ing intelligence and health. J. Nonverbal. Behav. 28, 167–185.
doi: 10.1023/B:JONB.0000039648.30935.1b
Conflict of Interest Statement: The authors declare that the research was con-
ducted in the absence of any commercial or financial relationships that could be
construed as a potential conflict of interest.
Received: 28 February 2014; accepted: 17 September 2014; published online: 05
November 2014.
Citation: Spisak BR, Blaker NM, Lefevre CE, Moore FR and Krebbers KFB (2014)
A face for all seasons: searching for context-specific leadership traits and discovering
a general preference for perceived health. Front. Hum. Neurosci. 8:792. doi: 10.3389/
fnhum.2014.00792
This ar ticle was submitted to the journal Frontiers in Human Neuroscience.
Copyright © 2014 Spisak, Blaker, Lefevre, Moore and Krebbers. This is an open-
access article distributed under the terms of the Creative Commons Attribution
License (CC BY). The use, distribution or reproduction in other forums is permit-
ted, provided the original author(s) or licensor are credited and that the original
publication in this journal is cited, in accordance with accepted academic practice.
No use, distribution or reproduction is permitted which does not comply with these
terms.
Frontiers in Human Neuroscience www.frontiersin.org November 2014 | Volume 8 | Article 792
|
181

OPINION ARTICLE
published: 21 May 2014
doi: 10.3389/fnhum.2014.00314
A case for neuroscience in mathematics education
Ana Susac
1
*
and Sven Braeutigam
2
1
Department of Physics, Faculty of Science, University of Zagreb, Zagreb, Croatia
2
Department of Psychiatry, Oxford Centre for Human Brain Activity, University of Oxford, Oxford, UK
*Correspondence: ana@phy.hr
Edited by:
Carl Senior, Aston University, UK
Reviewed by:
Gina Rippon, Aston University, UK
Keywords: mathematics, education, learning, problem solving, cognitive development, brain imaging, society
Mathematics lies at the heart of sci-
ence and technology impacting on the
economic performance of societies since
ancient times (OECD, 2010). At the level
of individuals too, the development of
mathematical proficiency appears corre-
lated with individual development and
career prospects across a wide range of
professions (RAND Mathematics Study
Panel and Loewenberg Ball, 2003). It does
not come as a surprise to realize that
mathematics education traces back several
thousand years. However, still very little
is known about the fundamental princi-
ples of how individuals learn mathemat-
ics and at which age education should
start. The issue is far from trivial as it is
commonly assumed that mathematics is
a special subject area perhaps requiring
specific motivation, interest and teaching
methods in order to be learned effi-
ciently (National Council of Teachers of
Mathematics, 2000). Here, we are attempt-
ing to make a case for neuroscience
methodology as a moder n tool capable of
contributing to the debate, where a spe-
cial but not exclusive emphasis is on brain
development. Note that for the purpose of
this opinion paper, neuroscience is essen-
tially equated with magnetic resonance
imaging (MRI), as MRI based approaches
currently constitute mainstream research
in this field of study according to our
understanding.
Developmental studies are increas-
ing our understanding of maturational
changes in the human brain (Blakemore,
2012). In particular, structural MRI stud-
ies reveal an increase in white matter
volume during childhood and adoles-
cence suggesting an increase of connec-
tivity in the developing brain (Giedd and
Rapoport, 2010). Interestingly, gray matter
volume is characterized by an inverted-
U shaped curve peaking at different age
in different brain regions (Giedd et al.,
1999), which suggests a non-linear, het-
erogeneous trajectory where proficiencies
mature at different times and speeds
dependent on which brain regions are
most important for a given skill. For
example, it is commonly agreed that the
intuitive sense of number or quantity
is an early ability that can be observed
already in infants and that can pre-
dict mathematical proficiency later in life
(Starr et al., 2013).
In addition to structural studies, func-
tional neuroimaging provides further
insight relevant to mathematics edu-
cation. For example, a developmental
functional MRI study of mental arith-
metic has shown that the pattern of
brain activation changes with student
age (Rivera et al., 2005). Importantly,
these age-related changes were associ-
ated with functional maturation rather
than alterations in gray matter density.
Moreover, functional studies can help to
elucidate the role of specific brain regions
in mathematical processing. For example,
it has b een suggested that the intuitive
understanding of quantities is associ-
ated with activity in the intra-parietal
sulcus (Dehaene, 1997) and, more gen-
erally, parietal cortices that are involved
in various mathematical tasks from num-
ber comparison to complex processing
such as proportional and deductive rea-
soning (e.g., Kroger et al., 2008; Vecchiato
et al., 2013). However, additional stud-
ies are needed to establish links between
development of brain structures and their
functional maturation.
Many neuroimaging studies have
focused on development of arithmetic
skills in children and adults (for a review
see Zamarian et al., 2009). Again, different
parts of the parietal cortex, such as bilat-
eral intra-parietal sulcus and left angular
gyrus, are shown to have a crucial role in
mental calculations (e.g., De Smedt et al.,
2011; Grabner et al., 2013). In contrast,
other br ain areas appear to mature rela-
tively late, such as prefrontal association
areas thought to be involved in mathe-
matical cognition and other higher-order
processes developing throughout child-
hood and adolescence (Blakemore, 2012).
Such insight might shed some light on
the transition from concrete arithmetic to
the symbolic language of algebra, where
students have to develop abstract reason-
ing skills that enable them to generalize,
model, and analyze mathematical equa-
tions and theorems (e.g., Qin et al., 2004;
Lee et al., 2007; Anderson et al., 2012).
Ultimately, mathematical proficiency
will require the coordinated action of
many brain regions as exemplified by
an influential model of algebraic equa-
tion solving (Anderson et al., 2008).
Based largely on functional MRI stud-
ies of brain activation, the model stip-
ulates distinguishable functional modules
that map onto anatomically separate brain
regions. For example, a visual module
that extracts information about the equa-
tion is associated with the fusiform gyrus.
An imagery module holding a represen-
tation of the equation and performing
transformations on the equation is located
in posterior parietal cortices. A mod-
ule responsible for retrieval of previously
learned algebraic rules is associated with
the left prefrontal cortex. Such models are
Frontiers in Human Neuroscience www.frontiersin.org May2014|Volume8|Article314
|
HUMAN NEUROSCIENCE
182

Susac and Braeutigam Neuroscience in mathematics education
important as they help to devise meth-
ods to track mental states in individu-
als solving algebraic equations (Anderson
et al., 2012). Thus, neuroscience could
conceivably help to better understand
the relationship between biological brain
development and the development of the
human capacity for mathematical cogni-
tion mediated by educational experience
(Royer, 2003).
More specifically, longitudinal stud-
ies of changes in brain activation with
practice in equation solving (Qin et al.,
2004) confirm what educators have known
since ancient times—continued exercise in
problem solving is very important. This
is non-trivial as such studies offer inde-
pendent insig ht about the time needed for
practice to y ield robust effects on brain
activity. In principle, such changes in brain
activity can be used to compare different
teaching methods at the neuronal level.
For example, a study investigating the neu-
ronal correlates of algebraic problem solv-
ing by two different methods that are
taught in schools in Singapore ( Lee et al.,
2007) suggested that the more symbol ori-
ented a method was, the higher was the
load on the attention system of the brain,
which might help to explain why sym-
bolic manipulations are usually considered
difficult.
In this context, a number of neu-
roimaging and neuropsychology studies
have demonstrated that the relationship
between number and space processing is
reflected in the organization of parietal cir-
cuits assumed to be associated with these
skills (Hubbard et al., 2005). Thus, a bet-
ter understanding of number and space
processing in the brain might conceiv-
ably yield guidelines informing teachers
how to develop both concepts in paral-
lel. Developing skills in parallel might go
further than numbers and space, as there
is emerging evidence that pattern recog-
nition that is important in algebraic rea-
soning (Susac et al., 2014) is closely related
to visual attention and visual brain regions
(Anderson et al., 2008).
Research efforts have also focused on
dyscalculia, a specific learning difficulty
in understanding numbers and opera-
tions with numbers. Mathematics teach-
ers and parents should be aware that
the prevalence of developmental dyscal-
culia is about 5–7% (Butterworth et al.,
2011). Only joint effort of mathemat-
ics educators and neuroscientists can lead
to better understanding of developmen-
tal trajectories of dyscalculia and possi-
ble positive effects of early diag nosis and
interventions. There is growing evidence
that insight gained from neuroscience can
inform computer-assisted interventions.
For example, neuroscience based com-
puter g ames have been shown to improve
the number comparison ability in children
with low numeracy skills (Wilson et al.,
2006; Räsänen et al., 2009).
In particular, The Number Race is an
adaptive software program designed for
teaching number sense to young chil-
dren aged 4–8. It trains children on the
entertaining numerical comparison task
developing counting and simple arith-
metic skills (1-digit addition and subtrac-
tion). It is designed to strengthen links
between symbolic and non-symbolic rep-
resentations of number (concrete sets, dig-
its, and number words). Attention and
motivation of children is maintained by
adjusting the level of task difficulty so
that the success rate stays at around
75%. The rewarding environment may
help with other problems, which can be
associated with dyscalculia such as atten-
tion deficit and hyperactivity disorder
(ADHD). Moreover, The Number Race
and similar computer-assisted interven-
tions can advance mathematics learning
and achievement also in typically develop-
ing children (Griffin, 2004).
This game is based on current under-
standing of the neural circuits involved
in numerical cognition, in par ticular the
parietal cortices (Dehaene et al., 2003).
However, a caveat is in order. A recent
review revealed that only 3 out of 20
mathematics intervention software pack-
ages reported the use of neuroscience
research as a tool in intervention devel-
opment (Kroeger et al., 2012). Moreover,
the majority of programs reviewed (15/20)
lacked any empirical validation, prevent-
ing teachers from making informed deci-
sion on implementation of such programs
in the classroom. Evidently, further empir-
ical, peer-reviewed research is needed to
evaluate existing software packages and to
guide further developments.
There are challenges. From the early
days of educational neuroscience, there
have been skeptical views on the possibility
of direct classroom application of neuro-
scientific data (as a “bridge too far” in the
words of Bruer, 1997). The increasing pub-
lic visibility of neuroscience has led to what
some scholars call neuromyths, i.e., certain
beliefs turned into facts because of having
been expressed ever so often through vir-
tually all communication channels, such
as the view that some people are left-
brained and some are right-brained, or
that humans use only 10 percent of
their brains. Worryingly, unsubstantiated,
neuromyth based teaching and learning
methods are in use or have been adver-
tised to teachers and education profession-
als (Goswami, 2006). This reinforces the
notion that insight obtained from high-
quality neuroscience must be presented
in a non-specialists form to mathematics
educators, parents, and politicians so that
informed decisions on educational issues
can be made (building “bridges over trou-
bled waters” in the words of Ansari and
Coch, 2006).
In summary, we are inclined to argue
that neuroscience can eventually impact
on mathematics e ducation by providing
hints as to (a) what mathematics curricu-
lum should be provided at which age, (b)
which skills should be developed in par-
allel, and (c) how to reliably assess the
effects of early diagnosis and interventions
in the case of specific learning disabili-
ties. Research on the timing of maturation
of brain areas involved in mathematical
cognition appears particularly important
as some economic models propose that
earlier economic investment in educa-
tion, i.e., in preschool programs, always
lead to larger economic return than later
investments (Cunha and Heckman, 2007).
There is neuroscientific evidence, however,
that indicates continuing development of
executive functions throughout childhood
and adolescence. Thus, educational pol-
icy makers should be aware of the cur-
rent neuroscience findings when deciding
on the timing of educational investment
(Howard-Jones et al., 2012).
We believe that neuroscience will not
and should not obviate behavioral and
psychometric studies that provide inde-
pendent insight facilitating the develop-
ment of new experimental paradigms for
neuroimaging studies. One should be clear
that neuroscience findings have not made
it directly into the mathematics classroom
Frontiers in Human Neuroscience www.frontiersin.org May2014|Volume8|Article314
|
183

Susac and Braeutigam Neuroscience in mathematics education
at present. However, this should not deter
research and we would like to urge inves-
tigators not only to continue but also to
extend their study of educational neu-
roscience. Groundbreaking thoughts take
time to mature and to find direct appli-
cations, as in the case of Carnot’s ther-
mal efficiency theorem. As Carnot’s work
set up a framework for design of more
efficient engines that were constructed
decades later, neuroscience research today
is setting the scene for future develop-
ments in mathematics education.
ACKNOWLEDGMENT
This work was supported by the
Department of Psychiatry, Oxford
University.
REFERENCES
Anderson, J. R., Betts, S., Ferris, J. L., and Fincham, J.
M. (2012). Tracking children’s mental states while
solving algebra equations. Hum. Brain Mapp. 33,
2650–2665. doi: 10.1002/hbm.21391
Anderson, J. R., Fincham, J. M., Qin, Y., and Stocco, A.
(2008). A central circuit of the mind. Trends Cogn.
Sci. 12, 136–143. doi: 10.1016/j.tics.2008.01.006
Ansari, D., and Coch, D. (2006). Bridges over
troubled waters: education and cognitive neu-
roscience. Trends Cogn. Sci. 10, 146–151. doi:
10.1016/j.tics.2006.02.007
Blakemore, S. J. (2012). Imaging brain development:
the adolescent brain. Neuroimage 61, 397–406. doi:
10.1016/j.neuroimage.2011.11.080
Bruer, J. T. (1997). Education and the brain:
abridgetoofar.Educ. Res. 26, 1–13. doi:
10.3102/0013189X026008004
Butterworth, B., Varma, S., and Laurillard, D. (2011).
Dyscalculia: from brain to education. Science 332,
1049–1053. doi: 10.1126/science.1201536
Cunha, F., and Heckman, J. (2007). The technology
of skill formation. Am. Econ. Rev. 97, 31–47. doi:
10.1257/aer.97.2.31
Dehaene, S. (1997). The Number Sense.NewYork,NY:
Oxford University Press.
Dehaene, S., Piazza, M., Pinel, P., and Cohen, L.
(2003). Three parietal circuits for number pro-
cessing. Cogn. Neuropsychol. 20, 487–506. doi:
10.1080/02643290244000239
De Smedt, B., Holloway, I. D., and Ansari, D.
(2011). Effects of problem size and arithmetic
operation on brain activation during calcula-
tion in children with varying levels of ari th-
metical fluency. Neuroimage 57, 771–781. doi:
10.1016/j.neuroimage.2010.12.037
Giedd, J. N., Blumenthal, J., Jeffries, N. O.,
Castellanos, F. X., Liu, H., Zijdenbos, A., et al.
(1999). Brain development during childhood
and adolescence: a longitudinal MRI study. Nat.
Neurosci. 2, 861–863. doi: 10.1038/13158
Giedd, J. N., and Rapoport, J. L. (2010). Structural
MRI of pediatric brain development: what have
welearnedandwherearewegoing?Neuron 67,
728–734. doi: 10.1016/j.neuron.2010.08.040
Goswami, U. (2006). Neuroscience and education:
from research to practice? Nat. Rev. Neurosci. 7,
406–411. doi: 10.1038/nrn1907
Grabner, R. H., Ansari, D., Koschutnig, K., Reishofer,
G., and Ebner, F. (2013). The function of the left
angular gyrus in mental arithmetic: evidence from
the associative confusion effect. Hum. Brain Mapp.
34, 1013–1024. doi: 10.1002/hbm.21489
Griffin, S. (2004). Building number sense with num-
ber worlds. Early Child. Res. Q. 19, 173–180. doi:
10.1016/j.ecresq.2004.01.012
Howard-Jones, P. A., Washbrook, E. V., and Meadows,
S. (2012). The timing of educational investment:
a neuroscientific perspective. Dev. Cogn. Neurosci.
2S, S18–S29. doi: 10.1016/j.dcn.2011.11.002
Hubbard, E. M., Piazza, M., Pinel, P., and Dehaene, S.
(2005). Interactions between number and space in
parietal cortex. Nat. Rev. Neurosci. 6, 435–448. doi:
10.1038/nrn1684
Kroeger,L.A.,Brown,R.D.,andO’Brien,B.
A. (2012). Connecting neuroscience, cogni-
tive, and educational theories and research to
practice: a review of mathematics intervention
programs. Early Educ. De v. 23, 37–58. doi:
10.1080/10409289.2012.617289
Kroger,J.K.,Nystrom,L.E.,Cohen,J.D.,and
J
ohnson-Lair
d, P. N. (2008). Distinct neural
substrates for deductive and mathemati-
cal processing. Brain Res. 1243, 86–103. doi:
10.1016/j.brainres.2008.07.128
Lee,K.,Lim,Z.Y.,Yeong,S.H.,Ng,S.F.,
Venkatraman, V., and Chee, M. W. (2007).
Strategic differences in algebraic problem solv-
ing: neuroanatomical correlates. Brain Res. 1155,
163–171. doi: 10.1016/j.brainres.2007.04.040
National Council of Teachers of Mathematics. (2000).
Principles and Standards for School Mathematics.
Reston, VA: NCTM.
OECD. (2010). The High Cost of Low Educational
Performance: The Long-Run Economic Impact of
Improving PISA Outcomes. Paris: OECD.
Qin, Y., Carter, C. S., Silk, E. M., Stenger, V.
A., Fissell, K., Goode, A., et al. (2004). T he
change of the brain activation patterns as children
learn algebra equation solving. Proc. Natl. Acad.
Sci. U.S.A. 101, 5686–5691. doi: 10.1073/pnas.
0401227101
RAND Mathematics Study Panel, and Loewenberg
Ball, D. (2003). Mathematical Proficiency for
All Students: Toward a Strategic Research and
Development Program in Mathematics Education.
Santa Monica, CA: RAND.
Räsänen, P., Salminen, J., Wilson, A. J., Aunio,
P., and Dehaene, S. (2009). Computer-assisted
intervention for children with low numer-
acy skills. Cogn. Dev. 24, 450–472. doi:
10.1016/j.cogdev.2009.09.003
Rivera, S. M., Reiss, A. L., Eckert, M. A., and
Menon, V. (2005). Developmental changes in men-
tal arithmetic: evidence for increased functional
specialization in the left inferior parietal cortex.
Cereb. Cortex 15, 1779–1790. doi: 10.1093/cercor/
bhi055
Royer, J. M. (ed.). (2003). Mathematical Cognition.
Portland, OR: Book News, Inc.
Starr, A., Libertus, M. E., and Brannon, E. M.
(2013). Number sense in infancy predicts math-
ematical abilities in childhood. Proc. Natl. Acad.
Sci. U.S.A. 110, 18116–18120. doi: 10.1073/pnas.
1302751110
Susac, A., Bubic, A., Kaponja, J., Planinic, M., and
Palmovic, M. (2014). Eye movements reveal stu-
dents’ strategies in simple equation solvi ng. Int.
J. Sci. Math. Educ. 12, 1–23. doi: 10.1007/s10763-
014-9514-4
Vecchiato, G., Susac, A., Margeti, S., De Vico Fallani,
F., Maglione, A. G., Supek, S., et al. (2013). High-
resolution EEG analysis of power spectral density
maps and coherence networks in a proportional
reasoning task. Brain Topogr. 26, 303–314. doi:
10.1007/s10548-012-0259-5
Wilson, A. J., Dehaene, S., Pinel, P., Revkin, S. K.,
Cohen, L., and Cohen, D. (2006). Principles under-
lying the design of “The Number Race,” an adap-
tive computer game for remediation of dyscalculia.
Behav. Brain Funct. 30, 2–19. doi: 10.1186/1744-
9081-2-19
Zamarian, L., Ischebeck, A., and Delazer, M.
(2009). Neuroscience of learning arithmetic
—evidence from brain imaging studies.
Neurosci. Biobehav. Rev. 33, 909–925. doi:
10.1016/j.neubiorev.2009.03.00
Conflict of Interest Statement: The authors declare
that the research was conducted in the absence of any
commercial or financial relationships that could be
construed as a potential conflict of interest.
Received: 15 March 2014; accepted: 28 April 2014;
published online: 21 May 2014.
Citation: Susac A and Braeutigam S (2014) A cas e for
neuroscience in mathematics education. Front. Hum.
Neurosci. 8:314. doi: 10.3389/fnhum.2014.00314
This article was submitted to the journal Frontiers in
Human Neuroscience.
Copyright © 2014 Susac and Braeutigam. This is
an open-access article distributed under the terms of
the Creative Commons Attribution License (CC BY ).
The use, distribution or reproduction in other forums
is permitted, provided the original author(s) or licen-
sor are credited and that the original publication
in
this
journal is cited, in accordance with accepted
academic practice. No use, distribution or reproduc-
tion is permitted which does not comply with these
terms.
Frontiers in Human Neuroscience www.frontiersin.org May2014|Volume8|Article314
|
184

ORIGINAL RESEARCH ARTICLE
published: 04 February 2014
doi: 10.3389/fnhum.2014.00032
The role of attachment styles in regulating the effects of
dopamine on the behavior of salespersons
Willem Verbeke
1
*
, Richard P. Bagozzi
2
and Wouter E. van den Berg
1
1
Department of Business Economics, Erasmus School of Economics, Rotterdam, Netherlands
2
Ross School of Business, University of Michigan, Ann Arbor, MI, USA
Edited by:
Nick Lee, Aston University, UK
Reviewed by:
Kalyan Raman, Northwestern
University, USA
Gordon Robert Foxall, Cardiff
University, UK
*Correspondence:
Willem Verbeke, Department of
Business Economics, Erasmus
School of Economics, Erasmus
University Rotterdam,
Burgemeester Oudlaan 50, Room
H-15-25, PO Box 1738, 3000 DR
Rotterdam, Netherlands
e-mail: verbeke@ese.eur.nl
Two classic strategic orientations have been found to pervade the behavior of modern
salespersons: a sales orientation (SO) where salespersons use deception or guile to
get customers to buy even if they do not need a product, and a customer orientation
(CO) where salespersons first attempt to discover the customer’s needs and adjust their
product and selling approach to meet those needs. Study 1 replicates recent research
and finds that the Taq A1 variant of the DRD2 gene is not related to either sales or CO,
whereas the 7-repeat variant of the DRD4 gene is related to CO but not SO. Study 2
investigates gene × phenotype explanations of orientation of salespersons, drawing upon
recent research in molecular genetics and biological/psychological attachment theory. The
findings show that attachment style regulates the effects of DRD2 on CO, such that
greater avoidant attachment styles lead to higher CO for persons with the A2/A2 variant
but neither the A1/A2 nor A1/A1 variants. Likewise, attachment style regulates the effects
of DRD4 on CO, such that greater avoidant attachment styles lead to higher CO for persons
with the 7-repeat variant but not other variants. No effects were found on a SO, and secure
and anxious attachment styles did not function as moderators.
Keywords: attachment styles, DRD2, DRD4, customer orientation, sales professionals
INTRODUCTION
Organizations are especially interesting social environments as
they differ from everyday social groups such as found in fam-
ily life, friendship, or hobby clubs. Within organizations, people
undertake both long and short-term strategies to fit into their
group and interact with others outside their group to meet
the needs of their organization. Consistent with the emerging
organizational cognitive neuroscience (OCN) framework (Senior
et al., 2011), we seek to understand the biological processes—
hard-wired neurological and endocrine processes conserved over
millions of years in different species—that might help us under-
stand how people operate in organizations, particularly those
whose job requires them to deal with others outside their organi-
zation to meet their organization’s mission. Specifically, we seek
to explain the strategic orientation that salespersons take in their
relationship with customers. Two fundamental, recently studied
orientations are the sales orientation (SO) and customer ori-
entation (CO) (Bagozzi et al., 2012). A SO involves the use of
deception and guile by a salesperson to get customers to buy
even if they do not need a product. A CO characterizes a sales-
person’s attempts to first discover the customer’s needs and then
adjust their product and selling approach to meet those needs.
Sometimes the terms hard and soft selling are used to describe
these orientations, where the latter generally leads to long-term
relationships, whereas the former, given its one-sided exploitive
nature, is typically short-lived.
Hard-wired neurological and endocrine processes, which
undergird phenotypical selling and COs, provide ultimate expla-
nations that define evolutionary fit outcomes. In developing our
hypotheses and interpreting findings, which entail cross-level
gene and phenotype descriptions, we draw upon molecular genet-
ics research to ground our studies. Our approach is guided by two
aims recently recommended in the literature, namely, (1) to repli-
cate recent findings so as to show the relevance of candidate genes
and set up the need to explore gene-phenotype interactions to
explain strategic orientations of salespersons on the job (Munafò
et al., 2008), and (2) to give special attention to definition and
measurement of explanatory phenotypes and develop a theory
accounting for how they moderate the effects of candidate genes
on strategic orientations (Munafò et al., 2008).
Originally introduced in 1982 (Saxe and Weitz, 1982), the
concepts of sales and COs and their measurement have found
currency across many studies, where more than 30,000 salespeo-
plehavebeeninvestigated(Franke and Park, 2006). Nearly all
of this research has been conducted at the psychological level of
investigation, with self-reports as measures of independent and
dependent variables. The sole exception appeared in a recent
study by Bagozzi et al. (2012) (Study 2), where the DRD2 A1
was found to be marginally associated with a SO (p = 0.07), and
the DRD4 7R
+
allele was found to be significantly associated
with a CO (p = 0.04). The rationale for the former finding was
that salespeople carrying the A1 variant should have a reduced
response to dopamine, seek greater s timulation, and favor greater
immediate gratification than carriers of the other variants, and
therefore should be inclined to press customers into yielding
without fully taking into account their needs. In contrast, the
rationale for the latter finding was that salespeople carrying the
7R
+
variant should be more curious and open to opportunity
Frontiers in Human Neuroscience www.frontiersin.org February 2014 | Volume 8 | Article 32
|
HUMAN NEUROSCIENCE
185

Verbeke et al. Role of attachment styles
recognition, greater risk takers, and more inclined to search for
unique needs of customers and put greater effort into finding
and constructing a mutually beneficial match between buyer and
seller.
A shortcoming of the study by Bagozzi et al. (2012) is that find-
ing the main effects of candidate genes might occur by chance
and reflect a false-positive outcome. To guard against prema-
turely placing too much credence on the findings in Bagozzi et al.
(2012), it would be advisable to conduct replications on differ-
ent subjects operating in different organizational environments.
Further, discovery of the effects for individual candidate genes
may be unrealistic in that factors other than genes may be of equal
or greater importance or may be conditional on when and how
genes function, if they function at all, in real-world job environ-
ments under naturalistic conditions. Therefore, our second aim
is to develop a meaningful phenotype to explore a plausible gene
× phenotype interaction effect on salesperson job orientation in
the field. The phenoty pe chosen was the biological/psychological
theory of attachment.
The OCN perspective seeks to uncover the role of higher-order
psychological concepts in translational research by explicating
hard-wired biological mechanisms and in doing so deepen and
even change the measurement and functioning of these con-
cepts (Senior et al., 2011). The challenge with developing strong
hypotheses is that most studies in genetics are more on patients
and less on healthy people, let alone people w ho operate in
professional settings. In this regard, the DRD2 (“reward or rein-
forcement gene”) and DRD4 (“impulsive gene”) are known as risk
genes, meaning that they are linked with such non-desirable phe-
notypes as addiction or impulsivity (e.g., Noble, 2000; Eisenberg
et al., 2007; Green et al., 2008). Given the differential sensitiv-
ity hypothesis, which suggests that in different environments a
particular gene might have opposite effects (Belsky et al., 2009),
carriers of certain alleles of the DRD2 or DRD4 might actually
thrive in certain environments, rather than necessarily exhibit
the risk factors associated with clinical populations. Such a per-
spective might help us make better predictions and lead to better
understanding of phenotypes and their effects. In what follows we
explore the pathways in which DRD2 and DRD4 are expressed,
and we investigate how polymorphisms of these genes regulate
these pathways differently under the differential influence of the
attachment phenotype.
Consequently, we investigate the moderating role of attach-
ment, where we also examine a type of differential sensitivity and
challenge the received view in the literature. Attachment theory
arose out of clinical and cross-cultural research by Bowlby (1988)
and Ainsworth (1991). A central claim is that young children
develop stereotypical interpersonal styles because of relationships
with early caregivers, typically the mother. Three distinct patterns
tend to develop: anxious, avoidant, and secure. The anxious style
is marked by the tendency to seek support from an attachment fig-
ure, to worry about being rejected, to harbor doubts about one’s
self-efficacy, to have low self-esteem, to crave attention and close-
ness, to feel vulnerable and helpless, and to possess a negative
self-model, while being generally positive toward others because
of a desire for support and protection. The avoidant style is char-
acterized by a low need to feel close to others, a tendency to
seek independence and self-reliance, and a propensity to focus
on positive features of the self and downplay negative ones to
build a positive self-model, while being dismissive or mistrustful
of others. The secure style is distinguished by a positive self-
image and relative openness and trust in relationships with others.
Considerable evidence shows that attachment styles formed early
in life persist to influence adult behavior (Mikulincer and Shaver,
2007).
Recent research with adults finds that the secure attachment
style is the most functional across a wide variety of relationships.
For example, consumer behavior research finds that people with
secure, as opposed to anxious or avoidant, attachment styles form
positive relationships and experience positive outcomes in service
settings (e.g., Mende and Bolton, 2011). Research with employees
in organizations shows that workers with avoidant and anxious
attachment styles are less supportive in helping colleagues (Geller
and Bamberger, 2009). We would argue, consistent with research
with adults in family and romantic relationships (e.g., Mikulincer
and Shaver, 2003, 2007), that the secure attachment style should
be functional in everyday consumer behavior because consumers
seek to find products that meet personal needs, and initial open-
ness and trust when facing sellers should be conducive to meeting
personal needs, whereas anxious or avoidant styles would inter-
fere with the discovery of desired requisites. Likewise, within
organizational boundaries, workers function best when cooper-
ation and tr ust flourish and they strive to fit in and work together
on common goals. Here a secure attachment style should pro-
mote such endeavors, whereas anxious and avoidant styles should
interfere or lead to disharmony.
In contrast to research with consumers and workers within
organizations, and opposite to predictions of attachment theory
in romantic and family contexts, we argue that the secure attach-
ment style w ill not be more functional than other attachment
styles for salespersons, but rather the avoidant style will be most
conducive to successful exchanges. This seeming paradox is based
on the contingent role that the attachment phenotype plays in
the unique context of business-to-business selling. Salespersons
in such contexts function in decidedly inter-organizational envi-
ronments where they venture away from the home organiza-
tion to negotiate deals inside the buyer’s organization. This not
only weakens felt normative and peer pressure from the home
organization, but exposes the seller to greater pressure from
buyers in a more vulnerable setting, and leads to an interper-
sonal environment with more uncertainty, ambiguity, and tension
than typically found in intra-organizational or personal rela-
tionships. Somewhat similar psychological tensions occur for
ambassadors, diplomats, and inter-mediators in government and
similar settings.
In a business-to-business context, informal norms and com-
pany policies by both seller and buyer firms typically caution, and
even dictate and sanction, against the development of intimate or
overly personal relationships (Anderson and Jap, 2005). Rather,
buyer and seller are required to conform to professional rules of
decorum and propriety. Codes of conduct and ethical guidelines
govern personal involvement, fraternization, leaking of corporate
information, and standards of behavior. Coupled with legal and
moral issues concerning sexual harassment, bribery, kickbacks,
Frontiers in Human Neuroscience www.frontiersin.org February 2014 | Volume 8 | Article 32
|
186

Verbeke et al. Role of attachment styles
and related topics, such work guidelines place real restrictions
on the nature of social contact between sales representatives
and buyers and color transactions. In addition, sales represen-
tatives operate as organization-boundary spanners and engage
in such proactive behaviors as seeking new customers and mak-
ing autonomous decisions when negotiating prices, especially in
business-to-business contexts, all of which require sales represen-
tatives with an ability to behave efficaciously during interactions
with customers (Crant, 1995).
These norms and expectations lead us to propose that avoidant
styles are particularly suited for sales representatives in such
relationships in business-to-business contexts. It is fruitful to con-
ceive of attachment styles as working cognitive models on how
one regards others and the self in social relationships in terms
of the support one can give or get in times of need. Attachment
styles are mental representations of person-person transactions
that motivate one to seek protection or help from others in inter-
personal relationships, to the extent that there is a threat or danger
(Mikulincer and Shaver, 2003, 2007). Research shows that persons
with avoidant attachment style prefer to hold a certain emotional
distance from interaction partners to be able to keep the initia-
tiveandbehaveproactively(seeMikulincer and Shaver, 2003;
Ein-Dor et al., 2010). Arguably, in common business-to-business
settings, policies, and norms require that sales representatives
uncover the needs of customers, offer solutions, and achieve com-
mercial results. At the same time, persons with avoidant styles
tend to be self-reliant (see Mikulincer and Shaver, 2003; Richards
and Schat, 2011), which is a useful trait in sales representatives
who operate in demanding inter-firm environments and are often
physically away from both the home organization and its social
support. Although some people are both high in avoidance and
anxiety (termed in the literature, “fearful avoidance”), Mikulincer
and Shaver (2003, p. 70) note that such persons are “less likely
to arise in normal samples of college students and community
adults” and are more common “in samples of abused or clinical
samples.” Thus, the avoidant attachment style, where social anxi-
ety is not a deficit, is consistent with modern characterizations of
business relationships. Successful business-to-business sales rep-
resentatives need to be sufficiently independent and detached,
self-reliant, and not deterred by anticipatory anxiety to function
well in such contexts (which tends to occur when representatives
ask commitments of customers or when they have to close a deal;
Vinchur et al., 1998; Richards and Schat, 2011). These conditions
fit the avoidant attachment style well.
The secure attachment style is less conducive to the
demands on sales representatives in business-to-business con-
texts. Researchers characterize the secure st yle as one where
the person exhibits “comfort with closeness” and intimacy
(Mikulincer and Shaver, 2003, p. 9). Such an orientation is not
largely an asset in formal business relationships because buyers
and sellers realize that there is potential for tension between the
goals of buyer and seller organizations. Also, give and take are
integral parts of the relationship, as both parties are required
to meet the requisites of their home firms, which often do not
fully coincide with the other firm’s . Intimacy or comfort with
closeness may even interfere with interactions in some business
relationships. In addition, it is possible for employees to be too
secure and not motivated as much by “the hunger to make a
sale” or “the fear of failure,” whereas a person who is avoidant
in orientation is more likely to be more motivated. The avoidant
style places emphasis on business goals, not personal relationship
ones, per se, although goals can be met mutually in business-to-
business contexts, and thereby promoted largely when a CO vs.
a SO is pursued. This is especially salient in inter-organization
relationships.
The anxious attachment style also seems not to fit business-to-
business settings as well as the avoidant style. Preoccupation with
thefearofrejectionorfailuretomakeasale,or“astrongneed
for closeness, [and] worries about relationships,” as found for
anxious attachment style p ersons (Mikulincer and Shaver, 2003,
p. 69; see also Ein-Dor et al., 2010, p. 134), would seem to lead
sales representatives to work too hard to elicit immediate support
and even affection from customers, which draws attention away
from exploring via conversation the needs of buyers and then pre-
senting a commercially viable solution to meet those needs and
close the sale. The avoidant style should entail less disruptive and
more realistic coping with fear or anxiet y (e.g., Ein-Dor et al.,
2010, p. 134; Richards and Schat, 2011).
The avoidant attachment style thus seems to strike a balance
between the secure and anxious styles. To the extent that avoidant
attached salespeople remain self-confident, they should abstain
from relying too much on trust in others, meaning that they
will retain a certain amount of self-reliance, spontaneity, and ini-
tiative to make sure customers understand offers and respond
accordingly. The avoidant attachment style salesperson is there-
fore neither too secure nor too anxious but rather reflects a
realization that selling to business customers is more rooted in
a rational or professional relationship than a personal one per se.
In sum, we hypothesize that the avoidant attachment style, but
not the anxious or secure, should function as the best modera-
toroftheeffectsoftheDRD2 and DRD4 genes on CO. How this
happens also invokes differential sensitivity.
GENETIC STUDY 1
The two genes, DRD2 and DRD4, although often perceived as
risk genes, might turn out to be functional in a selling con-
text (Goodman, 2008; Tripp and Wickens, 2009). Both genes
code for receptors for dopamine (a catecholamine), which is
known to modulate synaptic transmission, especially in the cor-
tex and striatum (Tritsch and Sabatini, 2012). Specifically, DRD2
is mainly expressed in the ventral striatum and thus affects
instrumental learning and conditioning, whereas the DRD4 is
mostly expressed in the prefrontal cor tex (PFC) and affects
how people process information and engage in self-regulation.
These mechanisms for dopamine (D) modulation are vast, oper-
ating in pre-synapsis neurotransmitter release (e.g., vesicular
release machinery), in post-synapsis detection of neurotransmit-
ter detection (e.g., modulating membrane insertion), and synap-
tic integration and excitability (e.g., modulating ion channels)
(Tritsch and Sabatini, 2012). Therefore, as Green et al. (2008) sug-
gest, it is too simplistic to relate a specific gene polymorphism
to a specific region of the brain, given the huge connectiv-
ity between the brain nuclei but also the great complexity of
neuromodulation. Rather than one or a small number of regions
Frontiers in Human Neuroscience www.frontiersin.org February 2014 | Volume 8 | Article 32
|
187

Verbeke et al. Role of attachment styles
of the brain involved, it is more realistic to expect many regions
to be engaged in a complex system of interactions.
Here we mainly focus on the differential roles of the D1-
like(D1andD5)andD2-like(D2,D3,andD4)receptorsinthe
intercellular integration within post-synapse areas. The D2-like
receptors compared to the D1-like type receptors have a higher
affinity for dopamine (10 to 100-fold greater for the D3 and
even more greater for the D4) (Tritsch and Sabatini, 2012). A
key for both cognition and reward system functioning is the
D1/D2 ratio (dual state model). Here, the D1 receptor plays a gat-
ing role by controlling the threshold of significance above which
information must pass before it can be admitted to working mem-
ory (achieving stabilization), and the D2 signals the presence
of information (mostly reward based information) that allows
the PFC network to respond to this new information by updat-
ing its working memory system (achieving flexibility) (Seamans
and Yang, 2004; Savitz et al., 2006). The D1/D2 ratio regula-
tion implies that D1-like receptors are bound to stimulatory G
proteins (hence called G protein-coupled receptors) that ener-
gize adenylyl cyclase, and this activates the production of cyclic
adenosine monophosphate (cAMP), and thus activation of pro-
tein kinase A (PKA). PKA mediates the phosphorylation and
regulates the function of a wide area of cellular substrates such
as K+,Na+ and Ca+, glutamate, GABA receptors, and tran-
scription factors. D2-like receptors bind to inhibitory Gproteins
that hinder adenylyl cyclase and thus reduce the production of
cAMP, which prevents cAMP activation of PKA and also reduces
N-methyl-D-aspartate (NMDA) receptor activation and GABA-
ergic inhibition (Seamans and Yang, 2004; Tritsch and Sabatini,
2012).
Dopamine levels have an effect on the D1/D2 ratio, but this
effect is different in the PFC (slow modulation) compared to the
striatum (reinforcing brief activity), thus complicating the abil-
ity to make clear conjectures (Tripp and Wickens, 2009). The
striatum and PFC are mutually interconnected, as well as to the
dopamine system, and thus stimulation by dopamine affects both
reward seeking and planning, which is why dopamine levels have
an inverted U curve effect on cognitive performance; both low
and high levels of dopamine fail to affect cognitive performance,
but intermediate levels effect cognitive performance strongly. This
is because the striatum is activated more intensely by dopamine
and (due to its connection with the PFC) leads to reductions in
flexibility of switching costs, at least under some conditions such
as in planning (Aarts et al., 2011).
For cognitive processes, when dopamine levels are high (low),
there is a higher (lower) D1/D2 ratio, which due to cAMP
activation and its intracellular chain reaction affects the exci-
tatory release of glutamate from pyramidal cells of the PFC.
Consequently, there is stronger excitatory signaling and better
inhibition of noise due to distraction in the environment (in
other words, more focus occurs). Higher PFC activation also
feedbacks back to the striatum and allows for better regulation
of striatal impulses (needed for self-regulation and inhibition).
However, higher dopamine levels in the striatum have a different
effect: activation in the striatum helps a person respond flexibly
to environmental cues, especially for what is desired (routines and
wanting). However, when strongly activated, the striatum might
predispose a person to respond inflexibly to the environment
as routine responding takes over (Aarts et al., 2011). In short,
strong striatum activation might compromise cognitive flexibility
or raise switching costs. We expect that the two candidate genes
(DRD2 and DRD4) will affect the D1/D2 ratio and thus have
an impact on cognitive and reward processes. Somewhat similar
outcomes happen with the COMT gene where Met carriers expe-
rience lower ability of enzyme breakdown of dopamine, and thus
dopamine levels remain high, and a higher D1/D2 ratio occurs
resulting in greater cAMP activation, higher glutamate levels, and
greater cognitive focus, at the cost of more rigid behavior.
The DRD4 gene (D2-like), located on chromosome 11p15.5,
codes for the dopamine D4 receptor and includes in exon III a 48-
bp variable number of tandem repeats (VNTR) polymorphism,
which contains 2–11 repeats. This VNTR is located in a region
that encodes the supposed third cytoplasmic loop of the receptor
that couples to inhibiting G proteins, which reduce the produc-
tion of cAMP, and thus inhibits the chain reaction in the neuron
(Wang et al., 2004; Barnes et al., 2011). Carriers of the DRD4
7
+
repeat (7R
+
) variant of this polymorphism in the DRD4 gene
experience reduced ability to blunt cAMP signaling in neurons
(Asghari et al., 1995; Oak et al., 2000), compared to 7R
−
carri-
ers (both in the pre- and post-synapsis), and thus are less able
to play an inhibitory role, so undergo high er glutamate activa-
tion. Due to the fact that DRD4 is mainly expressed in the PFC,
there is more cognitive elaboration and higher aler tness for what
might be new. This leads to the following cognitive and behavioral
effects: the dopamine system switches too quickly from a tonic
to a phasic state (higher sensitivity to reward salience) (Grace,
1991), and this makes the person more open to experience; indeed
Munafò et al. (2008) showed that carriers of the DRD4 7R
+
were
more likely to show approach-related personality tr aits (espe-
cially novelty-seeking). Carriers of the DRD4 7R
+
are less able
to maintain cognitive self-control than non-carriers and thus are
more vulnerable to dist racting information, which if occurring
in a sales conversation might consist in lost information that is
relevant, such as happens with non-verbal signals. Similarly, car-
riers of the DRD4 7R
+
arelessabletoself-regulateandhave
difficulties post-poning gratification, making them vulnerable to
committing more impulsive behaviors (Munafò et al., 2008).
Successful selling requires salespeople to look for opportuni-
ties displayed implicitly in interpersonal encounters (e.g., being
sensitive to implicit meaning and non-verbal communication)
and explicitly by customers (e.g., voicing needs, objections).
Salespeople who are carriers of the DRD4 7R
+
might be more
likely to respond to these changes and thus better sense opportu-
nities than non-carriers.
The DRD2 gene, located on chromosome 11q22-q23 (region
rs 180049), codes for the dopamine receptor D2, and includes
exon 8 of the ANKK1 gene (Ritchie and Noble, 2003). DRD2 is
especially active in the ventral striatum, and it is the most widely
expressed D receptor in the brain (Tritsch and Sabatini, 2012).
Carriers of the DRD2 Taq A1 experience a reduction in both pre
and post-synaptic D2 sites, which results in increased dopamine
release. More dopamine means that there is a greater activation of
neurons in the striatum (Laakso et al., 2005). As dopamine levels
rise, so will activation of the striatum (the D1/D2 ratio changes
Frontiers in Human Neuroscience www.frontiersin.org February 2014 | Volume 8 | Article 32
|
188

Verbeke et al. Role of attachment styles
accordingly, and the consequent intracellular cascade will occur).
Due to the connection with the PFC, this might affect flexibility
in cognitive tasks and produce a concave U effect. Optimal levels
of dopamine might result in optimal cognitive performance, but
too much dopamine results in lower cognitive performance. For
example, Stelzel et al. (2010) found that carriers of DRD2 Taq A 1,
were less proficient in adjusting their behavior based on feedback
about earlier performance (but not when they engaged in a novel
cognitive task). In addition, because the striatum (especially the
NAcc) has the most D2-like receptors, there is also a higher prob-
ability that carriers have greater wanting and reward dependency
(Trifilieff et al., 2013). Thus, they might be more motivated and
willing to put pressure on customers due to their stronger want-
ing. Considering the facets of a SO described above, carriers of the
DRD2 Taq A1 might engage more frequently in a SO.
MATERIALS AND METHODS STUDY 1
SUBJECTS
A total of 64 salespeople, all working in business-to-business
environments, were asked to participate in a study involving
DNA analysis. They came from the following industries: 4%
came from automotive, 3% from food and beverage, 15% from
banking, 3% from utilities, 9% from manufacturing, 23% from
professional services, 7% from pharmaceuticals, 2% from tele-
com, 5% from logistics, 20% from IT, 3% from retailing, and
6% from other industries. Respondents answered an online ques-
tionnaire containing CO and SO questions from the SOCO scale
(Saxe and Weitz, 1982), identical to those used in the study by
Bagozzi et al. (2012) (see Ta b le 1). The response format was a
7-point disagree-agree Likert format. However, one item from
the CO and two items from the SO were deleted because they
Table 1 | Customer orientation and sales orientation scales (see
Bagozzi et al., 2012).
CUSTOMER ORIENTATION (CO)
1 I try to get customers to discuss their needs with me.
2 I try to find out what kind of product would be most helpful to a
customer.
*
3 I try to bring a customer with a problem together with a product that
helps him solve the problem.
4 I try to give customers an accurate expectation of what the product
will do for them.
5 I try to figure out what a customer’s needs are.
SALES ORIENTATION (SO)
1 I try to sell a customer all I can convince him to buy, even if I think it
is more than a wise customer would buy.
2 I try to sell as much as I can rather than satisfy a customer.
3 If I am not sure a product is right for a customer, I will still apply
pressure to get him to buy.
*
4 I paint too rosy a picture of my products, to make them sound as
good as possible.
*
5 It is necessary to stretch the truth in describing a product to a
customer.
*
These items had low factor loadings, so all analysis were done twice: once with
the original full scales above, and one with the full scales above, and once with
the full scales with these items removed (see Tables 2, 3).
loaded too low on their respective factors, based on exploratory
factor analysis. Nevertheless, since one aim of our study is to
replicate the orig inal findings of Bagozzi et al. (2012),wewill
report results for the SO and CO scores on the scales from
the current study, as well as the original scales as used by
Bagozzi et al. (2012). The alpha of the (4-item) CO scale from
this study was 0.71 (5-item Bagozzi et al., scale = 0.60). The
alpha of the (3-item) SO scale was 0.76 (5-item B agozzi et al.,
scale = 0.82).
PROCEDURES AND STATISTICAL ANALYSES
We followed recommended practice to gather DNA data and anal-
ysis, and allele frequencies analysis using the Hardy–Weinberg
Equilibrium. We use parametric t-tests for tests of equality
of means on the CO scale and SO scale and DRD2/DRD4
polymorphisms of participants.
RESULTS
Tabl es 2, 3 present the findings. The results for DRD2 show
that neither CO (t =−0.69, p = 0.91; t =−0.85; p = 0.87) nor
SO (t =−0.31, p = 0.77; t =−−0.38; p = 0.70), differ signifi-
cantly between the A1 and no-A1 variants. By contrast, for DRD4,
7R
+
carriers have significantly higher means than non-carriers on
CO (t = 2.37, p = 0.02; t = 2.60, p = 0.01), but no differences
werefoundonSO(t =−0.11, p = 0.91; t =−0.50; p = 0.62).
Table 2 | DRD2 Taq A1 t-tests for equality of means.
Group Mean t-test (two-sided) p-value
Customer orientation No A1 6.33 −0.69 0.91
A1 6.42
Customer orientation No A1 6.15 −0.85 0.87
(Bagozzi et al., 2012)A16.26
Sales orientation No A1 5.33 −0.31 0.77
A1 5.42
Sales orientation No A1 5.42 −0.38 0.70
(Bagozzi et al., 2012)A15.31
Table 3 | DRD4 48 bp VNTR t-tests for equality of means.
Group Mean t-test (two-sided)
a
p-value
Customer orientation NO 7R 6.26 −2.37 0.02
7R 6.59
Customer orientation No 7R 6.09 −2.60 0.01
(Bagozzi et al., 2012)7R6.42
Sales orientation No 7R 5.35 −0.11 0.9
7R 5.38
Sales orientation No 7R 5.34 −0.50 0.62
(Bagozzi et al., 2012)7R5.49
a
Bold values are significant at a 5% significance level.
Frontiers in Human Neuroscience www.frontiersin.org February 2014 | Volume 8 | Article 32
|
189

Verbeke et al. Role of attachment styles
DISCUSSION
Molecular genetics has the potential to inform organizational the-
ory about key phenotypes from a biological perspective. However,
to have a significant impact both in predicting and understanding
behavioral tendencies or traits, findings between variants of spe-
cific genes and phenotypes should be replicated using different
independent samples. We replicated recent findings concern-
ing the relationship between the DRD4 and DRD2 genes and
CO and SO, respectively (Bagozzi et al., 2012). In particular,
consistent with Bagozzi et al. (2012), we found that salespeo-
ple carrying the 7R
+
variant of the DRD4 gene have a higher
propensity to engage in CO. In contrast, no relationship between
the variants of the DRD2 genes and SO was found. It must
be noted, however, that in Bagozzi et al. (2012) the associa-
tion between DRD2 A1 and SO was only marginally significant
(p = 0.07).
Our findings show a clear impact of genes on SO, which goes
beyond the scope of behavioral genetics. We would like to point
out that such replications of candidate gene studies are rare, and
indeed failures to replicate are the norm (e.g., Seabrook and
Avison, 2010). One group of researchers (Chanock et al., 2007,
p. 655) characterizes the published literature in this regard as “a
plethora of questionable genotype-phenotype associations, repli-
cation of which has often failed in independent studies.” The
latter authors maintain that “the challenge will be to separate true
associations from the blizzard of false positives attained through
attempts to replicate positive findings in subsequent studies”
(p. 655).
GENE × ENVIRONMENT INTERACTION
Our aim in Study 2 is to develop a theoretical basis for hypoth-
esizing the conditions for the effect of key dopamine genes
in an organizational context by specifying a particular gene-
environment (phenotype) interaction. Since the molecular genet-
ics approach more directly reflects how the brain functions (in
this case the dopamine system), we are able to better under-
stand how actions are initiated and maintained. These molecu-
lar mechanisms potentially contribute to our understanding of
the phenotype, since they offer an additional explanation as to
how our brain influences our behavioral tendencies. Specifically,
salespeople’s curiosity and eagerness to understand customers’
needs involve regulation of the dopamine system known to be
involved in novelty-seeking and the related motivational pro-
cesses reviewed above, as governed by attachment style individual
differences.
Attachment systems imply double-sided mechanisms: peo-
ple, when anxious, seek proximity with others but also need to
feel secure in relationships, such that they can further broaden
and build behavioral repertoires in different social environ-
ments. Attachment styles develop in young children (Van
IJzendoorn, 1995) exploring their environment. They experi-
ence fear when confronted with challenging situations, and then
seek proximity to attachment figures (such as parents) and,
when present/supportive, secure attachment styles evolve such
that children comfortably seek and feel support from signifi-
cant others; especially oxytocin (OT) and dopamine are involved
in this (see hereafter). Based on these experiences, children
develop a secure working model, developing expectations for
predicting future interactions (cognitive schemas) and believ-
ing that others will be available and respond empathically if
necessary. Children can then co-regulate stress (achieving emo-
tional comfort or “neuroception” of safety) and attain feelings
of secur ity, allowing them to broaden their social exploratory
behaviors, develop a theory of mind (TOM), de-activate nega-
tive expectations and boost their coping skills, such as is reflected
in better ability to not get distracted and to conduct cog-
nitive reappraisal (Porges, 2003). Secure attached people also
like to give comfort to others (e.g., Mikulincer and Shaver,
2003).
The pleasant feeling that comes from close interaction (social
approach) occurs because when children are nurtured by their
parents there is a modest increase in dopamine transmission
in the NAcc, which activates dopamine receptors D1 and D2,
and both influence affection and pleasure and help maintain
social bonds. D1 and D2 have different effects on approach-
ing behavior as they have contrasting effects in the intracellular
mechanisms: D2-like receptors (expressed in neurons that project
from the rostral shell of the nucleus accumbens to the ven-
tral pallidum) are necessary for the formation of a pair bond.
Specifically the D2 receptors are bound to inhibitory G pro-
teins, which act to reduce the cAMP, which prevents PKA,
and is associated with the facilitation of attachment (primary
unconditional rewarding). D1 receptors are bound to stimula-
tory G proteins, which increases cAMP signaling, which in turn
increases PKA, and results in reduced mating partner prefer-
ences, but especially reduces the seeking of new partners once
a bond has been made. Key is that OT promotes the activa-
tion of inhibitory G proteins and down regulates the intr acellular
cAMP cascade. OT also enhances the hedonic value of social
interactions by activating areas rich in dopamine receptors in
especially the reward system (which includes the VTA, substan-
tia nigra). OT changes how the dopamine system updates the
outcome of actions; it reduces the feelings of risk (reduction
in amygdala activation), and this motivates people to undertake
social interactions and experience them as intrinsically reward-
ing. In other words, for many people, especially stable-attached
persons, social interaction with significant others is intrinsically
rewarding.
There is now evidence that secure interactions entail long-
term changes in the brain: secure attached people have greater
gray matter reward volume in the reward network and intercon-
nectedregionssuchashypothalamusororbitofrontalcortex
(OFC) (e.g., the ventral striatum is differentially activated in
secure mothers when the y see their own babies smiling or crying,
Strathearn et al., 2009). In addition, secure mothers also experi-
ence increased gray matter volume in the amygdala, the longer
the post-partum period; in other words, it shows that they have
a greater affective vigilance for their own children compared to
other children. Secure mothers also have greater gray matter vol-
ume in areas related to TOM processes, such as the PFC, STS, and
fusiform gyrus, and higher BOLD (blood-oxygen-level depen-
dent) signal responses when hearing babies, which shows that
as they interact with people they constantly improve their TOM
network.
Frontiers in Human Neuroscience www.frontiersin.org February 2014 | Volume 8 | Article 32
|
190

Verbeke et al. Role of attachment styles
When attachment figures are not reliably available or sup-
portive (e.g., caregivers behave unpredictably or do not provide
support), a healthy sense of security is not attained, and sec-
ondary strategies of affect regulation come into play. Two internal
working models emerge: avoidant and anxious.
Avoidant people do not have a healthy approaching system
and have reduced, or lack, reward-related activity during positive
social situations; e.g., avoidant attached individuals rate posi-
tive social information as less arousing (e.g., avoidant mothers
had low activation of the ventral striatum and VTA) or do not
experience positive social interaction as intrinsically rewarding
compared to secure mothers, as they deactivate the attachment
system and therefore do not seek to approach people (Vrti
ˇ
cka
and Vuilleumier, 2012, p. 6). Avoidant people are more con-
cerned with self-preservation, have a positive self-model, show
distrust to a partner’s goodwill, and strive to maintain inde-
pendence. Strong self-reliance often develops. Besides experi-
encing relatively low feelings of pleasure in social interaction,
avoidant attached people may exhibit ill-functioning emotional
coping styles: avoidant attached people de-emphasize threats and
tend to cope without help or support from others; e.g ., when
rejected they have a decreased activation of the anterior insula
and dACC (DeWall et al., 2012), which indicates a blunted
response to social negative contexts (or a lower need to feel
included). The problem is that this blunting might not work when
pressure is high. For example, Vrti
ˇ
cka et al. (2012) show that
when emotional regulation strategies are constrained, avoidant
attached persons have higher amygdala responses to emotional
stimuli.
Anxious people develop vigilance reactions: they hyperac-
tivate the attachment system when stress occurs resulting in
an inability to handle threats autonomously. Anxious people
tend to exaggerate threats. For example, Vrti
ˇ
cka et al. (2008)
show that the amygdala was selectively activated when angry
faces were presented as negative feedback after giving incorrect
responses; this leads to heightened distress and higher emo-
tionality. This amygdala activation shows that anxious persons
experience heightened distress in situations of personal failure
or social disapproval. Equally, when people are excluded from
others in the Cyberball paradigm, they show increased activa-
tion of the anterior insula and dAAC, which means that they
are sensitive to rejection (Eisenberger et al., 2003). They become
very emotional, and despite feeling that others are inconsis-
tent and not trustworthy, they attempt to gain protection and
support. Anxious people also worry that partners will not be
available in times of need and attempt to gain partner attention,
care, or even love. Feelings of intense dependence and clinginess
may emerge.
While most research shows that insecure people might not
be strong in relationship building, there is now evidence from
animal research and human research in organizations that inse-
cure attached agents are actually very productive to fit. Beery and
Francis (2011) show that rats when raised in insecure conditions
(low licking and grooming) actually performed b etter on indi-
vidual cognitive tasks than rats raised in secure conditions (high
licking and grooming). In addition, school children with parents
who did not look after them well, actually helped children in
school better than children raised with parents who cared well for
them (Obradovi
´
c et al., 2010). Therefore, we are now looking for
different sorts of events to substantiate this.
Beery and Francis (2011) suggest that stressful experiences in
mice do not inevitably lead to dysregulation of stress reactivity
and that increases in stress reactivity (caused by early life stress
due to poor maternal care) are not necessarily dysfunctional.
Beery and Francis introduce the concept of stress inoculation,
meaning that changes in the HPA axis and reward system to stress
learned in early maternal care might actually be beneficial within
certain contexts; e.g., rats subjected to stress conditions exhib-
ited less emotionality (Levine, 1962) and demonstrated efficient
neuro-endocrine responses. Confirming the effects of susceptibil-
ity to environmental influences, stress reactivity to environmental
cues can lead to greater responsiveness to stimulating environ-
ments in certain contexts.
Ein-Dor et al. (2010) speak about the paradox of attachment,
by which they mean that many insecure people can actually per-
form well at certain tasks. Using an exper imental design in which
fire suddenly broke out, Ein-Dor et al. found that anxious people
first noted the fire, whereas avoidant people were the first to take
flight, and secure people followed the avoidant attached people
in fleeing. Hence, there is evidence for concluding that in cer-
tain situations insecure attached persons might perform well and
outperform secure attached persons.
HYPOTHESES
DRD2 moderation
We propose that the effects of variants of the DRD2 dopamine
receptor gene on CO will depend on the degree of avoidance
attachment style. Specifically, we hypothesize the greater the
avoidance attachment style, the greater the CO for carriers of
the A2, A2 allele but not either the A1, A1 or A1, A2 alleles.
Carriers of the A2, A2 allele vs. the other alleles are less distracted
by intrusive or anxious thoughts (stemming from rumination
and anticipated rejection by customers or worry that the cus-
tomer will think that one is unattractive or less competent) and
shouldthereforebemorefocusedontheneedsofcustomers,
listen attentively, and respond to changing interpersonal give
and take. In contrast, carriers of the A1, A1, or A1, A2 allele
should be more rigid in their thinking and engage inflexibly
in stereotypical behavior patterns (van Holstein et al., 2011).
In other words, expected higher s witching costs for carriers of
the A2, A2 allele, compared to carriers of the A1, A2 or A1,
A2 alleles, should be associated with greater focus and persis-
tence, when salespersons interact with customers, which fosters
the ability to adjust product/service offerings and one’s com-
munications to customers. Carriers of the A1, A1 and A1, A2
alleles, compared to carriers of the A2, A2 allele, should not only
be more susceptible to distraction but also more impatient and
unfocused.
DRD4 moderation
The DRD4 dopamine receptor gene exists in variants that
affect receptor activation by the dopamine neurotransmitter.
Specifically, carriers of the 7R allele (7R
+
), vs. non-carriers, have
been found to engage in more risk taking (Dreber et al., 2009),
Frontiers in Human Neuroscience www.frontiersin.org February 2014 | Volume 8 | Article 32
|
191

Verbeke et al. Role of attachment styles
novelty-seeking (e.g., Ebstein e t al., 1996;cf.,Munafò et al., 2008),
and opportunity recognition during customer interactions (see
Study 1 in the current paper; Bagozzi et al., 2012). Work to date
has focused largely on the main effects of these gene variants, but
we examine their modulating effects on the impact of the avoidant
attachment style on CO. Consequently, we expect an interaction
effect: the avoidant attachment style will lead to greater CO in
salespeople with the 7R
+
allele but not for salespeople without
it. The rationale is that for sales representatives with the 7R
+
allele, the greater the inclination to be open to taking risks and
pursuing new opportunities, the more an avoidant attachment
style will lead to a strong CO. Again, we argue that the avoidant
attachment style is manifest in an ability to remain efficacious and
goal driven when discussing customer needs, and present appro-
priate solutions without allowing feeling s of rejection to intrude
detrimentally and adversely affect one’s efforts (see findings in the
psychology literature on “suppressing distress-related thoughts,”
Ein-Dor et al., 2010, p. 134).
MATERIALS AND METHODS STUDY 2
SUBJECTS
Hypotheses were tested on a sample of 73 sales representa-
tives who volunteered for a study of the role of biomark-
ers in professional relationships. Participants provided written
informed consent, and the study was approved by the local
research ethics committee. Participants were not told about the
aim of the study at the start but were debriefed after comple-
tion of the study. All participated in post-g raduate executive
education programs. All were business-to-business salespeople
selling financial services, trucks, IT services, insurance, phar-
maceutical drugs, or consulting services. These selling positions
require more thorough and repetitive conversations with cus-
tomers compared to sales interactions with consumers where
impulsive buying and transactions play a more important role
(e.g., retail sales; door-to-door selling). All were Caucasian, 87%
men, 13% women, 49% had a university degree and the rest
vocational school diplomas. The average level of selling experi-
ence was 6.8 years. All participants donated saliva so that their
DNA could be analyzed for the two candidate genes, DRD4
and DRD2.
PROCEDURE
Attachment styles were measured with 12 7-point “does not
describe me at all” to “describes me very well” end-points, and
“describes me moderately well” as a mid-point (see Ta ble 4).
These items were adapted from Professor Phillip R. Shaver’s latest
scale, which he kindly provided
1
. This scale is based on the origi-
nal in Hazan and Shaver (1987), which was revised by Collins and
Read (1990). Note that there are six items for anxious attachment,
three for avoidant, and three for secure.
CO was measured with 5 7-point disagree-agree items with the
same format used as for the attachment style items. This scale was
1
Personal communication with Professor Phillip R. Shaver, January 10, 2011.
developed by Bagozzi et al. (2012) as a subset of Saxe and Weitz’s
(1982) original scale. Tab l e 1 shows the items.
RESULTS
Two items from the attachment scale were deleted because
they loaded too low on their respective factors, based on an
exploratory factor analysis (items 6 and 10). Cronbach’s alpha
reliabilities for the subscales were 0.69 for anxious, 0.81 for
avoidant, and 0.67 (r = 0.51) for secure. Because all three factors
were uncorrelated with each other, and empirical under identifi-
cation occurred, we could not run a confirmatory factor analysis
(CFA) for all three subscales together. A CFA for the anxious and
avoidant subscales fit well: χ
2
(19)
= 17.65, p = 0.54, RMSEA =
0.00, NNFI = 1.01, CFI = 1.00, and SRMR = 0.076.
For the CO scale, the CFA model fit well: χ
2
(5)
= 4.65, p =
0.44, RMSEA = 0.00, NNFI = 1.00, CFI = 1.00, and SRMR =
0.036. Cronbach’s alpha was 0.77.
Regressions were done according to standard procedures: first,
we added the main effects, then the interaction effect. Here we
only report the significant main findings. As we have dichoto-
mous and continuous independent variables, we followed Jaccard
and Turrisi (2003) to analyze interaction effects and graphically
display the findings (see Nieuwenhuis et al., 2011). For the DRD2
analyses, the two regression equations are, with DDR2 coded (A1,
A1 and A1, A2) = 1andA2,A2= 0 in the first regression and the
reverse for the second:
Customer 5.986 +0.204 avoid +0.138 DRD2 −0.248 avoid × DRD2
orientation = (0.098) (0.074) (0.149) (0.109)
61.35 2.75 0.930 −2.29
Customer 6.124 −0.044 avoid −0.138 DRD2 +0.248 avoid × DRD2
orientation = (0.112) (0.079) (0.149) (0.109)
54.68 −0.55 −0.93 2.29
Table 4 | Attachment style scales.
ANXIOUS
1 I worry that others won’t care about me as much as I care about
them.
2 My desire to be very close sometimes scares people away.
3 I need a lot of reassurance that I am loved by my partner.
4 I do not often worry about being abandoned.
5 I find that my close relationships don’t want to get as close as I
would like.
6 I get frustrated if partners are not available when I need them.
AVOIDANT
7 I want to get close to others, but I keep pulling back.
8 I am nervous when partners get too close to me.
9 I try to avoid getting too close to others.
SECURE
10 I usually discuss my problems and concerns with my partner.
11 It helps to turn to my romantic partner in times of need.
12 I turn to my partner for many things, including comfort and
reassurance.
Frontiers in Human Neuroscience www.frontiersin.org February 2014 | Volume 8 | Article 32
|
192
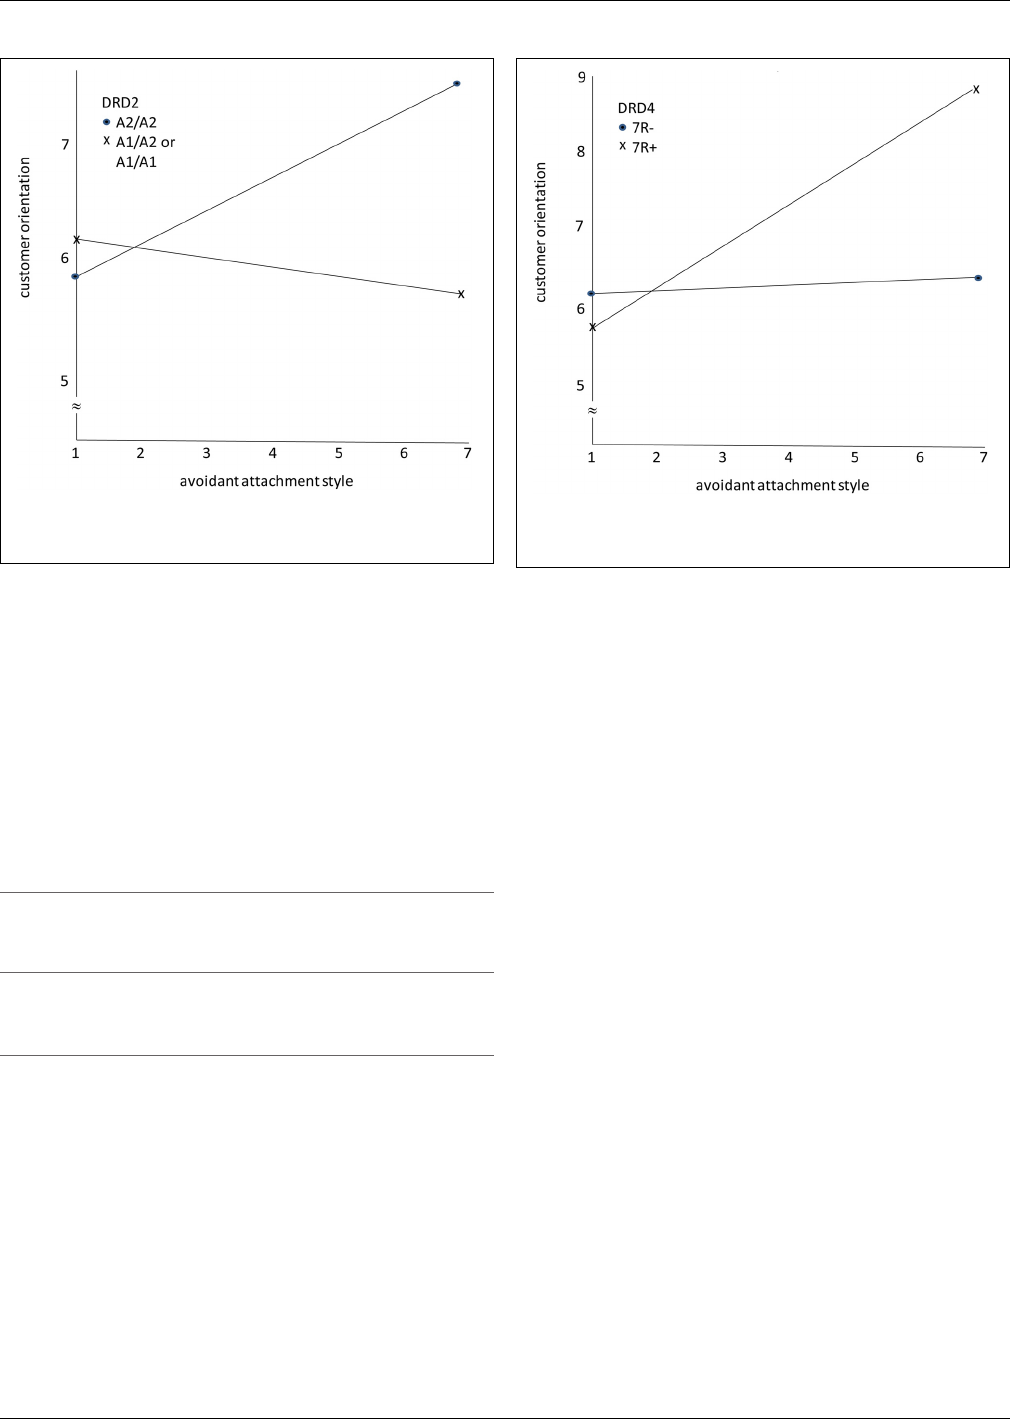
Verbeke et al. Role of attachment styles
FIGURE 1 | The moderating role of DRD2 gene variants on the effects
of avoidant attachment style on customer orientation.
where standard errors are in parentheses and t-values appear
below them. This model fit well: F
(3, 69)
= 2.73, p = 0.05,
R
2
= 0.11.
Figure 1 presents the results. As hypothesized, the avoidant
attachment style has a positive effect on CO for sales repre-
sentatives with the A2, A2 variant of the DRD2 gene. For sales
representatives with the A1, A1, and the A1, A2 variants of DRD2,
the avoidant attachment style has little effect on CO, as predicted.
For the DRD4 analyses, the two regression equations are, with
DRD4 coded 7R = 0 and 7R
+
= 1 in the first regression and the
reverse in the second regression:
Customer 6.116 +0.038 avoid +0.287 DRD4 −0.395 avoid × DRD4
orientation = (0.084) (0.057) (0.174) (0.166)
72.79 0.67 −1.64 2.38
Customer 5.829 −0.433 avoid −0.287 DRD4 +0.395 avoid × DRD4
orientation = (0.153) (0.155) (0.174) (0.166)
38.11 2.79 1.64 −2.38
This model fit well: F
(3, 69)
= 2.85, p = 0.04, R
2
= 0.11.
Figure 2 shows the findings. As predicted, the avoidant attach-
ment style has a positive effect on CO for salespeople with the
7R
+
variant of the DRD4 gene. However, for salespeople with the
7R
−
variant of the DRD4 gene, the avoidant attachment style had
no effect on CO, as expected.
To gain perspective, we also examined the interaction effects
on CO of the anxious attachment style with DRD2 and with
DRD4 polymorphisms, and the interaction effects on CO of the
secure attachment style with DRD2 and with DRD4.Noneofthe
interactions and none of the main effects were significant in the
four regressions.
FIGURE 2 | The moderating role of DRD4 gene variants on the effects
of avoidant attachment style on customer orientation.
Also for perspective, we note that CO was not significantly cor-
related with the anxious attachment style (r = 0.16, ns), avoid-
ance attachment style (r = 0.07, ns), secure attachment style (r =
0.11, ns), DRD2 (r = 0.07, ns), or DRD4 (r = 0.07, ns). Thus,
CO was influenced only by the interactions of the avoidance
attachment style with DRD2 and with DRD4 polymorphisms.
DISCUSSION
As we move into a biology-informed era in social research,
researchers will benefit from scrutinizing such higher-order con-
cepts as attitudes, personality traits, and work orientations using
lower-order concepts from neuroscience (e.g., Becker et al., 2011;
Senior et al., 2011) and molecular genetics. Whereas in our Study
1 we used insights from molecular genetics to replicate previous
findings about the association between variations of two candi-
date genes, namely DRD2 and DRD4 (nature),inStudy2we
explored how gene activity is affected by interactions with the
environment (nurture). We investigated this question because we
believe that findings from such cross-level studies can enr ich
theory testing and knowledge development and guide practi-
cal decision-making by human resource managers. For customer
boundary spanners, a meta-analysis by Ford et al. (1988) inves-
tigated how biographical and psychological variables compare
in their effects on salesperson’s success. Surprisingly, the results
seemed to suggest that biographical information predicts per-
formance better than psychological variables (see also Vinchur
et al., 1998). Specifically, the findings showed that personal his-
tory and family background explained around 5% of the variance
in performance and marital status accounted for less than 2%; in
comparison, cognitive abilities explained less than 1% and voca-
tional skills less than 1% of performance. Biographical variables,
of course, beg the questions what in one’s background influ-
ences behavior and what the underlying mechanisms are. The
Frontiers in Human Neuroscience www.frontiersin.org February 2014 | Volume 8 | Article 32
|
193

Verbeke et al. Role of attachment styles
low levels of explained variance for both biographical and psy-
chological variables suggest that the variables function poorly as
main effects, and sound theories proposing interactions might be
fruitful to explore in a person-by-situation exploration.
More specifically, two problems with such background vari-
ables can be identified. First, these variables can be thought to
be one-step removed from the origin of salesperson behavior and
serve as proxies at best for proximal psychological determinants
of behavior. Second, the use of background variables in manage-
rial decision-making risks the stigma of excessive intrusiveness, or
even worse, the application of prejudice or profiling due to race,
gender, or other categories.
In an effort to elucidate the interplay of nature and nur-
ture on the etiology of SO, we examined how variants of the
DRD2 and DRD4 genes moderate the effects of sales represen-
tative attachment styles on CO. The findings showed that the
avoidant attachment style has a positive effect on CO for sales rep-
resentatives carrying only DRD2 A2 alleles, but no effect occur
for sales representatives with at least one DRD2 A1 allele. The
avoidant attachment style has been shown to exhibit an orien-
tation of emotional distance, yet a high degree of self-reliance,
which seemingly fits expectations in inter-firm business relation-
ships. However, whether, and to what extent, the avoidant style
will influence CO apparently depends on the functioning of the
dopamine system with regard to goal-directed, motivational, and
reward-related behavior.
Carriers of the DRD2 A1 allele exhibit reduced switching costs
compared to carriers of only A2 alleles in intentional cognitive
tasks (Stelzel et al., 2010). This should be manifest in greater task
focus and persistence by the latter compared to the former, and
greater sensitivity to task distracters and greater impatience for
the former compared to the latter. The pattern of findings in
Figure 1 is consistent with this interpretation, where we found
that greater adherence to an avoidant attachment style leads
to a stronger CO for sales representatives with the A2 alleles,
whereas sales representatives with at least one A1 allele show no
relationship between avoidant st yle and CO.
Furthermore, carriers of the DRD4 7R
+
allele, vs. the 7R
−
allele, have been shown to be g reater risk takers and have a
propensity to seek opportunities while interacting with cus-
tomers. This, too, appears to regulate the effect of an avoidant
attachment style on CO. We speculate that the tension occurring
between the need to keep a certain amount of distance between
self and customer, and the drive to seek new opportunities leads to
a greater application of skills meeting (mutual) needs and greater
chance of success.
Additionally, the present research also brings into focus the
role in w hich insecure attachment styles (anxious and avoidant),
as opposed to the secure attachment style, play in professional
lives. In this regard, Ein-Dor et al. (2010) speak about the attach-
ment paradox. Overall, researchers in psychology (e.g., Shaver
and Brennan, 1992) have assumed that people with secure attach-
ment styles fair better than those with insecure ones, w ith respect
to building stable social relationships. The secure style is thought
to promote stable relationships with others, because it is believed
to increase fitness within the human species. However, when faced
with vulnerable relationships or threatening situations, such as in
many inter-firm selling contexts, people with an avoidant attach-
ment st yle remain self-efficacious and goal driven, and maintain
the initiative to seek innovative solutions (Ein-Dor et al., 2010).
As Ein-Dor et al. speculate, avoidant attachment styles may be
beneficial in certain situations. Our study shows that profes-
sional selling in business-to-business markets is such a context.
Sales representatives are boundary spanners who work largely
autonomously, explore the needs of customers, and shape the
way customers view their own problems (Vinchur et al., 1998).
They do so while maintaining a professional attitude in the face
of conflicts of interest, misunderstandings, and customer resis-
tance. In other words, whereas a secure attachment style might be
best for in-group relationships, an avoidant style seems best for
ingroup-outgroup relationships.
FUTURE RESEARCH AND PRACTICAL IMPLICATIONS
Our research paves the way for future discoveries. It would be
productive to study different phenomena in organization behav-
ior such as job attitudes, social identity, burnout and resilience,
and motivation, and explore the role of genetics in combination
with en vironmental factors. Such approaches are challenging, yet
they might provide us with more insights into the concepts under
study and their effects, which we exemplified in this study. Such
insights also allow human resource managers to uncover what
biological mechanisms are related to the (higher order) concepts
they regularly use.
Elaborating on the study in this paper, we note that sales
representatives do not always work alone but often in teams.
Would sales teams of people who possess heterogeneous attach-
ment styles function better than those with homogeneous styles?
Such teams might contain people who seek psychological comfort
(those with anxious attachment styles), sense competitive signals
(those with anxious and avoidant attachment styles), and effec-
tively implement interpersonal-change actions (especially those
with avoidant attachment styles). As we studied the effects of
attachment styles in interaction with genes, such questions are
both difficult to ask and difficult to answer.
In terms of task-person fit, what attachment style should be
employed by managers that supervise sales representatives with
diverse attachment styles? Will managers with secure attach-
ment styles, because they are perceived as open and trusting,
attain better results, and can they bring both secure and inse-
cure sales representatives together because they are inclined to
promote cooperation, hence enhancing group or team forma-
tion and flexibility? Alternatively, could it be that managers with
avoidant attachment styles empower their sales representatives
because they do not seek unneeded or excessive closeness? Note
that our findings showed that attachment styles interacted only
with specific genes to influence COs. Holders of other genes might
require different leadership strategies or better fit tasks other than
boundary spanning roles.
Finally, attachment styles and people’s genetic profile are stable
and so tend to evoke automatic reactions or predictable ten-
dencies in particular situations. Future research should study
how sales representatives self-regulate such automatic tenden-
cies and shape them into productive work orientations. For
example, should firms make attachment styles part of awareness
Frontiers in Human Neuroscience www.frontiersin.org February 2014 | Volume 8 | Article 32
|
194

Verbeke et al. Role of attachment styles
training? If attachment styles interact with genetic abilities, would
such knowledge make sales representatives self-conscious of
their genetic backgrounds and encourage or discourage adaptive
behavior? Our findings invite researchers to explore the conse-
quences of deeper, unconscious biological processes that shape
human behavior in diverse organizational contexts.
Genetic data and measures of attachment style, if employed
sensitively and applied ethically to hiring, training, and supervi-
sory decisions along with other information, can provide more
valid and fair criteria for management than reliance only on
background information, interviews, and psychological tests. Of
course, any use of such infor mation must be based on valida-
tion of their effects on performances in any context, if Equal
Employment Opportunity Commission Regulations and anti-
discriminatory policies are to be met. Much remains to be
done concerning our understanding of the role of genetic fac-
tors in organizational behavior. For example, more work is
needed into how key genetic variables inter-relate with per-
sonality and situational constraints to influence behavior and
outcomes. The pursuit of such ends promises to help us under-
stand the “why” of behavior in organizations and provide policy
insights.
LIMITATIONS
One shortcoming of our research concerns the construct validit y
of our phenotype measures for CO, SO, and the three attachment
styles. We acknowledge that full analysis of construct validity
requires a multitrait, multimethod matrix investigation to assess
convergent and discriminant validity. We did not conduct such a
study, but some of the features of our approach suggest that con-
struct validity may not be a significant problem. All our measures
of variables were drawn from scales used before in a number of
studies, thereby receiving some support for validity of measures
in different research contexts with different samples. Second, all
our measures achieved satisfactory reliabilities, and our factor
analyses revealed that convergent and discriminant validity of
measures were achieved, albeit with a monomethod approach.
Future research could use confirmatory factor analysis in a mul-
timethod design to better establish construct validity (Bagozzi,
2011).
We studied sales representatives to investigate the nature-
nurture question related to molecular genetics in organizations.
While this context provided initial answers, there are limitations.
First, one can argue that the sample sizes used in this
study are small. However, we employed a hypothesis-driven
approach, targeting only two genes and based on theory from
biology and psychology, which reduces the need for large sam-
ple sizes required by exploratory searches across many genes.
Importantly, we replicated findings presented by Bagozzi et al.
(2012), regarding the association between carrying the DRD4
7R
+
variant and the propensity to engage in customer-oriented
selling. Convergent findings by two independent studies with
regard to a specific genetic variant are rare in biological research
and significantly contribute to the validity of the phenomena
under study. Furthermore, the discovery of gene-environment
interaction effects is also rarely recounted in the literature.
Such interactions require the specification and test of unusual
cross-level hypotheses and when found provide strong evidence
for the mechanisms under research. In addition, while the costs of
genetic profiling are becoming more feasible, such genetic studies
compared to pencil and paper tests are difficult to implement.
Second, the application of molecular genetics research in orga-
nization theory and social research contexts would benefit from
Genome Wide Association Studies (GWAS). This could uncover
a small number of fundamental genes at work in the workplace.
The following can be noted in this regard. First, as recommended
by Senior et al. (2011) we selected genes for study that have
already received some basic research efforts in areas of psychol-
ogy relevant to our research. Thus, our inquiry was grounded in
a specific, well-defined research tradition where in one sense our
findings add to this body of knowledge. Second, GWAS require
large sample sizes, because they test for up to one million genetic
variants at the same time, introducing severe multiple-testing
design and statistical issues, and thus significantly increasing the
risk for false-positive findings. Finally, in order to build the large
cohort that is required to give enough power for GWAS analy-
ses, one needs to study heterogeneous samples, which in our case
would mean studying people across many occupational settings
and environments and making it difficult to draw conclusions
pertaining to the specific work setting we investigated. Given the
limited effect sizes that are typically observed in (candidate) gene
studies, this might create too much noise in the sample to be able
to arrive at valid genetic effects.
Third, we assumed that attachment styles are a reflection of
environmental interactions, and therefore are a proxy of the influ-
ence of nurture, so to speak. However, attachment styles may
have genetic association as well (e.g., Gillath et al., 2008). In
addition, attachment styles were inferred from questionnaires in
our studies, but more objective data could have been used; e.g.,
observations by clinicians or other experts.
Finally, we used an attachment style questionnaire tailored
to how people experience general interpersonal relationships as
adults. We could have developed a domain-specific attachment
style measure tailored to the organizational context (e.g., Little
et al., 2010). However, since we aimed to understand ho w envi-
ronment and genes interact to influence behavior, we chose as our
measure one that reflects the phenomenon under study in a way
that functions during the critical window when one’s neurobio-
logical (stress) systems were shaped. This helps tie the findings
for the adults under study to the early biological underpinnings
and learning that produced the hypothesized consequences on
the job.
REFERENCES
Aarts, E., van Holstein, M., and Cools, R. (2011). Striatal dopamine and
the interface between motivation and cognition. Front. Psychol. 2:163. doi:
10.3389/fpsyg.2011.00163
Ainsworth, M. S. (1991). “Attachment and other affectional bonds across the life
cycle,” in Attachment across the Life Cycle, eds C. M. Parkes, J. Stevenson-Hinde,
and P. Marris (New York, NY: Routledge), 33–51.
Anderson, E., and Jap, S. (2005). The dark side of close relationships. MIT Sloan
Manag. Rev. 46, 75–82.
Asghari, V., Sanyal, S., Buchwaldt, S., Paterson, A., Jovanovic, V., and Van Tol,
H. H. (1995). Modulation of intracellular cyclic AMP levels by different
human dopamine D4 receptor variants. J. Neurochem. 65, 1157–1165. doi:
10.1046/j.1471-4159.1995.65031157.x
Frontiers in Human Neuroscience www.frontiersin.org February 2014 | Volume 8 | Article 32
|
195

Verbeke et al. Role of attachment styles
Bagozzi, R. P. (2011). Measurement and meaning in information systems and orga-
nizational research: methodological and philosophical foundations. MIS Q. 35,
261–292. doi: 10.1007/s11747-011-0271-4
Bagozzi, R. P., Ver beke, W. J., van den Berg, W. E., Rietdijk, W. J., Dietvorst, R.
C., and Worm, L. (2012). Genetic and neurological foundations of customer
orientation: field and experimental evidence. J. Acad. Market. Sci. 40, 639–658.
doi: 10.1007/s11747-011-0271-4
Barnes, J. J., Dean, A. J., Nandam, L. S., O’Connell, R. G., and Bellgrove, M. A.
(2011). The molecular genetics of executive function: role of monoamine system
genes. Biol. Psychiatry 69, e127–e143. doi: 10.1016/j.biopsych.2010.12.040
Becker, W. J., Cropanzano, R., and Sanfey, A. G. (2011). Organizational neuro-
science: taking organizational theory inside the neural black box. J. Manag. 37,
933–961. doi: 10.1177/0149206311398955
Beery, A. K., and Francis, D. D. (2011). Adaptive significance of natural variations
in maternal care in rats: a translational p erspective. Neurosci. Biobehav. Rev. 35,
1552–1561. doi: 10.1016/j.neubiorev.2011.03.012
Belsky, J., Jonassaint, C., Pluess, M., Stanton, M., Brummett, B., and Williams,
R. (2009). Vulnerability genes or plasticity genes&quest. Mol. Psychiatry 14,
746–754. doi: 10.1038/mp.2009.44
Bowlby, J. (1988). A Secure Base: Clinical Applications of Attachment Theory.
London: Routledge.
Chanock, S. J., Manolio, T., Boehnke, M., Boerwinkle, E., Hunter, D. J., Thomas,
G., et al. (2007). Replicating genotype–phenotype associations. Nature 447,
655–660. doi: 10.1038/447655a
Collins, N. L., and Read, S. J. (1990). Adult attachment, working models, and
relationship quality in dating couples. J.Pers.Soc.Psychol.58, 644–663. doi:
10.1037/0022-3514.58.4.644
Crant, M. J. (1995). The proactive personality scale and objective job performance
among real estate agents. J. Appl. Psychol. 80, 532–537. doi: 10.1037/0021-
9010.80.4.532
DeWall, C. N., Masten, C. L., Powell, C., Combs, D., Schurtz, D. R., and Eisenberger,
N. I. (2012). Do neural responses to rejection depend on attachment style? An
fMRI study. Soc. Cogn. Affect. Neurosci. 7, 184–192. doi: 10.1093/scan/nsq107
Dreber, A., Apicella, C. L., Eisenberg, D. T., Garcia, J. R., Zamore, R. S., Lum, K.,
et al. (2009). The 7R polymorphism in the dopamine receptor D4 gene (DRD4)
is associated with financial risk taking in men. Evol. Hum. Behav. 30, 85–92. doi:
10.1016/j.evolhumbehav.2008.11.001
Ebstein, R. P., Novick, O., Umansky, R., Priel, B., Osher, Y., Blaine, D., et al.
(1996). Dopamine D4 receptor (D4DR) exon III polymorphism associated with
the human personality trait of novelty seeking. Nat. Genet. 12, 78–80. doi:
10.1038/ng0196-78
Ein-Dor, T., Mikulincer, M., Doron, G., and Shaver, P. R. (2010). The attachment
paradox: how can so many of us (the insecure ones) have no adaptive advantage.
Perspect. Psychol. Sci. 5, 123–141. doi: 10.1177/1745691610362349
Eisenberg, D. T., MacKillop, J., Modi, M., Beauchemin, J., Dang, D., Lisman, S. A.,
et al. (2007). Examining impulsivity as an endophenotype using a behavioral
approach: a DRD2 Ta q I A and DRD4 48-bp VNTR association study. Behav.
Brain Funct. 3, 2. doi: 10.1186/1744-9081-3-2
Eisenberger, N., Lieberman, M., and Williams, K. D. (2003). Does rejection
hurt? An fMRI study of social exclusion. Sci. 302, 290–292. doi: 10.1126/sci-
ence.1089134
Ford, N. N., Walker, O. C., Churchill, G. A., and Hartley, S. W. (1988). “Selecting
successful salespeople, a meta-analysis of biographical and psychological crite-
ria,” in Review of Marketing, ed M. Houston (Chicago, IL: American Marketing
Association), 90–131.
Franke, G. R., and Park, J. E. (2006). S alesperson adaptive selling behavior
and customer orientation: a meta-analysis. J. Market. Res. 693–702. doi:
10.1509/jmkr.43.4.693
Geller, D., and Bamberger, P. (2009). Bringing avoidance and anxiety to the job:
attachment style and instrumental helping behavior among co-workers. Hum.
Relat. 62,
1803–1827. doi: 10.1177/0018726709337524
Gillath,
O., Shaver, P. R., Baek, J. M., and Chun, D. S. (2008). Genetic corre-
lates of adult attachment style. Pers.Soc.Psychol.Bull.34, 2396–1405. doi:
10.1177/0146167208321484
Goodman, A. (2008). Neurobiology of addiction: an integrative review. Biochem.
Pharm. 75, 266–322. doi: 10.1016/j.bcp.2007.07.030
Grace, A. A. (1991). Phasic versus tonic dopamine release and the modulation of
dopamine system responsivity: a hypothesis for the etiology of schizophrenia.
Neuroscience 41, 1–24. doi: 10.1016/0306-4522(91)90196-U
Green, A. E., Munafò, M. R., DeYoung, C. G., Fossella, J. A., Fan, J., and
Gray, J. R. (2008). Using genetic data in cognitive neuroscience: from grow-
ing pains to genuine insights. Nat. Rev. Neurosci. 9, 710–720. doi: 10.1038/
nrn2461
Hazan, C., and Shaver, P. (1987). Romantic love conceptualized as an attachment
process. J. Pers. Soc. Psychol. 52, 511–524. doi: 10.1037/0022-3514.52.3.511
Jaccard, J., and Turrisi, R. (2003). Interaction Effects in Multiple Regression.
Thousand Oaks, CA: Sage.
Laakso, A., Pohjalainen, T., Bergman, J., Kajander, J., Haaparanta, M., Solin,
O., et al. (2005). The A1 allele of the human D2 dopamine receptor
gene is associated with increased activity of striatal L-amino acid decar-
boxylase in healthy subjects. Pharmacogenet. Genomics 15, 387–391. doi:
10.1097/01213011-200506000-00003
Levine, S. (1962). Plasma-free corticosteroid response to electric shock in rats
stimulated in infancy. Science 135, 795–796. doi: 10.1126/science.135.3506.
795-a
Little, K. C., McNulty, J. K., and Russell, V. M. (2010). Sex buffers intimates against
the negative implications of attachment insecurity. Pers.Soc.Psychol.Bull. 36,
484–498. doi: 10.1177/0146167209352494
Mende, M., and Bolton, R. N. (2011). Why attachment security matters how cus-
tomers’ attachment styles influence their relationships with service firms and
service employees. J. Serv. Res. 14, 285–301. doi: 10.1177/1094670511411173
Mikulincer, M., and Shaver, P. R. (2003). The attachment behavioral system in
adulthood: activation, psychodynamics, and interpersonal processes. Adv. Exp.
Soc. Psychol. 35, 53–152. doi: 10.1016/S0065-2601(03)01002-5
Mikulincer, M., and Shaver, P. R. (2007). Attachment in Adulthood: Structure,
Dynamics, and Change.NewYork,NY:Guilford.
Munafò, M. R., Yalcin, B., Willis-Owen, S. A., and Flint, J. (2008). Association
of the dopamine D4 receptor (DRD4) gene and approach-related person-
ality traits: meta-analysis and new data. Biol. Psychiatry 63, 197–206. doi:
10.1016/j.biopsych.2007.04.006
Nieuwenhuis, S., Forstmann, B. U., and Wagenmakers, E. J. (2011). Erroneous anal-
ysis of interactions in neuroscience: a problem of significance. Nat. Neurosci. 14,
1105–1111. doi: 10.1038/nn.2886
Noble, E. P. (2000). The DRD2 gene in psychiatric and neurological disorders and
its phenotypes. Pharmacogenomics 1, 309–333. doi: 10.1517/14622416.1.3.309
Oak, J. N., Oldenhof, J., and Van Tol, H. H. (2000). T he dopamine D4 receptor:
one decade of research. Eur. J. Pharmacol. 405, 303–327. doi: 10.1016/S0014-
2999(00)00562-8
Obradovi
´
c, J., Bush, N. R., Stamperdahl, J., Adler, N. E., and Boyce, W. T. (2010).
Biological sensitivity to context: the interactive effects of stress reactivity and
family adversity on socioemotional behavior and school readiness. Child Dev.
81, 270–289. doi: 10.1111/j.1467-8624.2009.01394.x
Porges, S. W. (2003). Social engagement and attachment. Ann. N.Y. Acad. Sci.1008,
31–47. doi: 10.1196/annals.1301.004
Richards, D. A., and Schat, A. C. (2011). Attachment at (not to) work: apply-
ing attachment theory to explain individual behavior in organizations. J. Appl.
Psychol. 96, 169–182. doi: 10.1037/a0020372
Ritchie, T., and Noble, E. P. (2003). Association of seven polymorphisms of
the D2 dopamine receptor gene w ith brain receptor-binding characteristics.
Neurochem. Res. 28,
73–82.
doi: 10.1023/A:1021648128758
Savitz, J., Solms, M., and Ramesar, R. (2006). The molecular genetics of cog-
nition: dopamine, COMT and BDNF. Genes Brain Behav. 5, 311–328. doi:
10.1111/j.1601-183X.2005.00163.x
Saxe, R., and Weitz, B. A. (1982). The SOCO scale: a Measure of the customer
orientation of salespeople. J. Market. Res. 19, 343–351. doi: 10.2307/3151568
Seabrook, J., and Avison, W. R. (2010). Genotype-environment interaction and
sociology: contributions and complexities. Soc. Sci. Med. 70, 1277–1284. doi:
10.1016/j.socscimed.2010.01.016
Seamans, J. K., and Yang, C. R. (2004). The principal features and mechanisms of
dopamine modulation in the prefrontal cortex. Prog. N eurobiol. 74, 1–58. doi:
10.1016/j.pneurobio.2004.05.006
Senior, C., Lee, N., and Butler, M. (2011). PERSPECTIVE—organizational cogni-
tive neuroscience. Organ. Sci. 22, 804–815. doi: 10.1287/orsc.1100.0532
Shaver, P. R., and Brennan, K. A. (1992). Attachment styles and the “Big Five” per-
sonality traits: their connections with each other and with romantic relationship
outcomes. Pers.Soc.Psychol.Bull.18, 536–545. doi: 10.1177/0146167292185003
Stelzel, C., Basten, U., Montag, C., Reuter, M., and Fiebach, C. J. (2010).
Frontostriatal involvement in task switching depends on genetic
Frontiers in Human Neuroscience www.frontiersin.org February 2014 | Volume 8 | Article 32
|
196

Verbeke et al. Role of attachment styles
differences in d2 receptor density. J. Neurosci. 30, 14205–14212. doi:
10.1523/JNEUROSCI.1062-10.2010
Strathearn, L., Fonagy, P., Amico, J., and Montague, P. R. (2009). Adult
attachment predicts maternal brain and oxytocin response to infant cues.
Neuropsychopharmacology 34, 2655–2666. doi: 10.1038/npp.2009.103
Trifilieff, P., Feng, B., Urizar, E., Winiger, V., Ward, R. D., Taylor, K. M., et al. (2013).
Increasing dopamine D2 receptor expression in the adult nucleus accumbens
enhances motivation. Mol. Psychiatry. 18, 1025–1033. doi: 10.1038/mp.2013.57
Tripp, G., and Wickens, J. R. (2009). Neurobiology of ADHD. Neuropharmacology
57, 579–589. doi: 10.1016/j.neuropharm.2009.07.026
Tritsch, N. X., and Sabatini, B. L. (2012). Dopaminergic modulation of
synaptic transmission in cortex and str iatum. Neuron 76, 33–50. doi:
10.1016/j.neuron.2012.09.023
van Holstein, M., Aarts, E., van der Schaaf, M. E., Geurts, D. E., Verkes, R. J., Franke,
B., et al. (2011). Human cognitive flexibility depends on dopamine D2 receptor
signaling. Psychopharmacology (Berl.) 218, 567–578. doi: 10.1007/s00213-011-
2340-2
Van IJzendoorn, M. (1995). Adult attachment representations, parental respon-
siveness, and infant attachment: a meta-analysis on the predictive validity of
the Adult Attachment Interview. Psychol. Bull. 117:387. doi: 10.1037/0033-
2909.117.3.387
Vinchur, A. J., Schippmann, J. S., Switzer, F. S., and Roth, P. (1998). A meta-analytic
review of predictors of job performance for salespeople. J. Appl. Psychol. 83,
586–597. doi: 10.1037/0021-9010.83.4.586
Vrti
ˇ
cka, P., Andersson, F., Grandjean, D., Sander, D., and Vuilleumier, P.
(2008). Individual attachment style modulates human amygdala and str ia-
tum activation during social appraisal. PLoS ONE 3:e2868. doi: 10.1371/jour-
nal.pone.0002868
Vrti
ˇ
cka, P., Bondolfi, G., Sander, D., and Vuilleumier, P. (2012). The neural sub-
strates of social emotion perception and regulation are modulated by adult
attachment style. Soc. Neurosci. 7, 473–493. doi: 10.1080/17470919.2011.647410
Vrti
ˇ
cka, P., and Vuilleumier, P. (2012). Neuroscience of human social inter-
actions and adult attachment style. Front. Hum. Neurosci. 6:212. doi:
10.3389/fnhum.2012.00212
Wang, E., Ding, Y. C., Flodman, P., Kidd, J. R., Kidd, K. K., Grady, D. L., et al.
(2004). The genetic architecture of selection at the human dopamine recep-
tor D4 (DRD4) gene locus. Am. J. Hum. Genet. 74, 931–944. doi: 10.1086/
420854
Conflict of Interest Statement: The authors declare that the research was con-
ducted in the absence of any commercial or financial relationships that could be
construed as a potential conflict of interest.
Received: 05 November 2013; accepted: 16 January 2014; published online: 04
February 2014.
Citation: Verbeke W, Bagozzi RP and van den Berg WE (2014) The role of attachment
styles in regulat ing the effects of dopamine on the behavior of salespersons. Front. Hum.
Neurosci. 8:32. doi: 10.3389/fnhum.2014.00032
This ar ticle was submitted to the journal Frontiers in Human Neuroscience.
Copyright © 2014 Verbeke, B agozzi and van den Berg. This is an open-access article
distributed under the terms of the Creative Commons Attribution License (CC BY).
The use, distribution or reproduction in other forums is permitted, provided the
original author(s) or licensor are credited and that the original publication in this
journal is cited, in accordance with accepted academic practice. No use, distr ibution or
reproduction is permitted which does not comply with these terms.
Frontiers in Human Neuroscience www.frontiersin.org February 2014 | Volume 8 | Article 32
|
197

GENERAL COMMENTARY
published: 10 June 2014
doi: 10.3389/fnhum.2014.00412
A comment on the service-for-prestige theory of leadership
Christopher R. von Rueden
*
Jepson School of Leadership Studies, University of Richmond, Richmond, VA, USA
*Correspondence: cvonrued@richmond.edu
Edited and reviewed by:
Carl Senior, Aston University, UK
Keywords: leadership, prestige, collective action, punishment, cultural anthropology
A commentary on
The evolution of leader-follower reci-
procity: the theory of service-for-prestige
by Price, M. E., and van Vugt, M.
(2014). Front. Hum. Neurosci. 8:363. doi:
10.3389/fnhum.2014.00363
Successful collective action often depends
on the presence of leaders, who bear
greater responsibility than other group
members for the logistics of coordina-
tion, monitoring of effort, and reward
and punishment. Leaders may be expected
to shoulder more risk, are vulnerable to
retaliation from sanctioned group mem-
bers, and suffer greater reputational dam-
age from failed collective action. What
then motivates individuals to be lead-
ers? From an evolutionary perspective, the
answer is not straightforward since most
of human history occurred in societies
lacking significant disparities in material
wealth and institutions that grant lead-
ers coercive power. One possibility is that
group members share costs by distributing
leadership roles over iterations of collec-
tive action. However, this is uncommon
where inter-individual differences in lead-
ership ability have an impact on collective
action. Whether in small-scale egalitarian
societies or large-scale stratified societies,
group members typically prefer leaders
who are superlative in traits such as phys-
ical size, knowledge, and prosociality (von
Rueden et al., in press).
Price and van Vugt (2014) offer another
theoretical solution: followers reciprocate
leaders’ services by granting them pres-
tige. As a result of their prestige, leaders
receive gifts, coalitional support, deference
from competitors, or mating opportunity.
I have a minor definitional criticism. I do
not see prestige as what is conditionally
granted to leaders but rather what leaders
can automatically produce through their
actions: a reputation for delivering benefits
to others. What Price and van Vugt (2014)
note is that the advantages to prestige may
accrue principally during times of need,
such as during conflict or food shortage,
and thus leadership can act as a form of
insurance (Boone and Kessler, 1999).
Since the benefits leaders provide are
often public goods, the service-for-prestige
theory entails that group members can
free-ride by (1) not contributing to collec-
tive action, (2) not rewarding leaders, and
(3) not punishing group members who
fail to reward leaders. This is where the
service-for-prestige theory makes unique
predictions relative to other theories of
leadership: followers will experience puni-
tive sentiment toward other group mem-
bers who fail to reward effective leaders
(or followers will experience prosocial sen-
timent toward group members who crit-
icize ineffective leaders). Price and van
Vugt (2014) present an example from
the Ecuadorian Amazon ( Price, 2003)
where group members who lack respect
for popular leaders are themselves disre-
spected. Future work will need to deter-
mine whether such punitive sentiment is
sufficient to stabilize group member con-
tributions to leaders, in various cultural
and organizational contexts.
Theoretical alternatives to service-for-
prestige predict that followers do not
experience a collective action problem in
bestowing benefits on leaders, because
leadership produces private goods not
subject to free-riding (costly signaling
theory), followers’ contributions to lead-
ers are a product of group selection,
or leaders recoup their costs by receiv-
ing greater direct benefits from collective
action. Examples of the latter include col-
lective actions that produce goods more
beneficial to leaders and their kin (Ruttan
and Borgerhoff Mulder, 1999) and lead-
ers who claim a greater share of the
spoils (Hooper et al., 2010; Gavrilets and
Fortunato, 2014).
As Price and van Vugt (2014) suggest,
social neuroscience methods (e.g., iden-
tifying the neural correlates of punitive
sentiment in public goods games) can
helptesttheexplanatorypowerofthe
service-for-prestige model against alter-
native models of leadership. The public
goods game has been modified to intro-
duce asymmet ries into decision-making
over the distribution of public good shares
(van der Heijden et al., 2009)oroverpun-
ishment and reward (O’Gorman et al.,
2009). However, caution is required when
making inferences from particular exper-
imental games, whose conditions (e.g.,
player endowments as windfalls) may
rarely hold in natural settings or may be
interpreted in different ways depending
on the cultural context. In highland New
Guinea where leaders demonstrated their
qualifications via competitive generos-
ity, large offers in the ultimatum game
were perceived not as prosocial but as
antagonistic (Tracer, 2003).
REFERENCES
Boone, J. L., and Kessler, K. L. (1999). More
status or more children? Social status, fertil-
ity reduction, and long-term fitness. Evol. Hum.
Behav. 20, 257–277. doi: 10.1016/S1090-5138(99)
00011-2
Gavrilets, S., and Fortunato, L. (2014). A solution
tothecollectiveactionprobleminbetween-
group conflict with within-group inequality. Nat.
Commun. 5:3526. doi: 10.1038/ncomms4526
Hooper, P. L., Kaplan, H. S., and Boone, J. L.
(2010). A theory of leadership in human coop-
erative groups. J. Theor. Biol. 265, 633–646. doi:
10.1016/j.jtbi.2010.05.034
O’Gorman, R., Henrich, J., and Van Vugt, M.
(2009). Constraining free riding in public
goods games: designated solitar y punishers
can sustain human cooperation. Proc. R. Soc.
B Biol. Sci. 276, 323–329. doi: 10.1098/rspb.
2008.1082
Frontiers in Human Neuroscience www.frontiersin.org June 2014 | Volume 8 | Article 412
|
HUMAN NEUROSCIENCE
198

von Rueden A comment on the service-for-prestige theory of leadership
Price, M. E. (2003). Pro-community altruism and
social status in a Shuar village. Hum. Nat. 14,
191–208. doi: 10.1007/s12110-003-1003-3
Price, M. E., and van Vugt, M. (2014). The evolu-
tion of leader-follower reciprocity: the theory of
service-for-prestige. Front. Hum. Neurosc i. 8:363.
doi: 10.3389/fnhum.2014.00363
Ruttan, L., and Borgerhoff Mulder, M. (1999).
Are East African pastoralists truly conservation-
ists? Curr. Anthropol. 40, 621–652. doi: 10.1086/
300086
Tracer, D. (2003). Selfishness and fairness in eco-
nomic and evolutionary perspective: an experi-
mental economic study in Papua New Guinea.
Curr. Anthropol. 44, 432–438. doi: 10.1086/374904
van der Heijden, E., Potters, J., and Sefton,
M. (2009) Hierarchy and opportunism in
teams. J. Econ. Behav. Organ. 69, 39–50.
von Rueden, C., Gurven, M., Kaplan, H., and Stieglitz,
J. (in press). Leadership in an egalitarian societ y.
Hum. Nat.
Conflict of Interest Statement: The author declares
that the research was conducted in the absence of any
commercial or financial relationships that could be
construed as a potential conflict of interest.
Received: 22 May 2014; accepted: 22 May 2014;
published online: 10 June 2014.
Citation: von Rueden CR (2014) A comment on the
service-for-prestige theory of leadership. Front. Hum.
Neurosci. 8:412. doi: 10.3389/fnhum.2014.00412
This article was submitted to the journal Frontiers in
Human Neuroscience.
Copyright © 2014 von Rueden. This is an open-
access article distributed under the terms of the Creative
Commons Attribution License (CC BY). The use, dis-
tribution or reproduction in other for ums is permit-
ted, provided the original author(s) or licensor are
credited and that the original publication in this
journal is cited, in accordance with accepted aca-
demic practice. No use, distribution or reproduc-
tion is permitted which does not comply with these
terms.
Frontiers in Human Neuroscience www.frontiersin.org June 2014 | Volume 8 | Article 412
|
doi: 10.1016/j.jebo.2008.09.007
199

OPINION ARTICLE
published: 13 September 2013
doi: 10.3389/fnhum.2013.00562
Interdisciplinary research is the key
David A. Waldman
*
Department of Management, W. P. Carey School of Business, Arizona State University, Tempe, AZ, USA
*Correspondence: waldman@asu.edu
Edited by:
Carl Senior, Aston University, UK
Reviewed by:
Andrew M. Farrell, Aston University, UK
Keywords: neurosciences, organizational neuroscience, organizational behavior, organizational sciences, interdisciplinary communication
The organizational sciences are rapidly
coming together with neuroscience the-
oryandmethodstoprovidenewinsights
into organizational phenomena (Becker
et al., 2011; Senior et al., 2011; Lee et al.,
2012), and even the potential develop-
ment of individuals within organizations
(Waldman et al., 2011). A number of
challenges become relevant in the pur-
suit of such an amalgamation, but per-
haps the most apparent is the inherent
need for interdisciplinary perspectives and
research. An overall purpose of this opin-
ion piece is to clarify the importance
of interdisciplinary efforts, while at the
same time clarifying the challenges to be
faced if we are to apply neuroscience to
organizations.
Scientists are typically trained and
reinforced to work in a unidisciplinary,
specialized mode. It really does not mat-
ter if we are considering people trained in
the so-called “soft” sciences (e.g., psy-
chology), or whether they come from
the “hard” sciences (e.g., neuroscience).
We are largely groomed and later rein-
forced to be specialists. I personally was
trained in industrial/organizational psy-
chology, a specialized area of the broader
field of psychology. When I was undergo-
ing my graduate education, as well as in
the years that followed, I never dreamed
that I would someday be working with
neuroscientists. But it is now happen-
ing. In other words, I am conducting
interdisciplinary research involving neu-
roscientists. In so doing, I certainly do not
represent the norm among my colleagues.
I say this as a professor in a manage-
ment depar tment of business school.
I realize that for many academic psycholo-
gists working in psychology departments,
the notion of combining psychology
and neuroscience has become the norm.
Accordingly, much of what I will address
in this opinion piece would not apply to
them.
I w ill address three primary questions
in this ar ticle. First, what are the institu-
tional and personal impediments that may
prevent researchers, especially those in set-
tingssuchasmyown,fromengagingin
the type of interdisciplinary research that
might involve neuroscience? Second, what
is the myth vs. reality of the obstacles that
might preclude the success of interdisci-
plinary efforts? Third, what steps can we
take to engage in more interdisciplinary
research? By addressing these questions,
I hope to provide some insight into the
issues and benefits of an interdisciplinary
approach to neuroscience research. Most
of my approach is framed through the
perspective of an organizational researcher
such as myself, although I conclude with
some consideration of why neuroscientists
might want to pursue interdisciplinary
research that reaches out to the organiza-
tional sciences.
INSTITUTIONAL AND PERSONAL
IMPEDIMENTS
I first attempted to apply neuroscience
to my own area of specialized expertise,
leadership in organizations, around 2005.
Early on, I made a presentation on the sub-
ject and described some recent data col-
lection efforts to my colleagues at Arizona
State University. After the presentation was
over, one of my colleagues took me aside
and said that what I was attempting to
do was quite interesting. He also acknowl-
edged that he had never conceived of such
possibilities, largely because of the insti-
tutional context in which we exist (about
which I will say more below). A second
colleague who pulled me aside was more
cautionary. He essentially acknowledged
that what I was doing was innovative, but
recommended, “don’t quit your day job.”
In other words, the not-so-subtle mes-
sage was that such interdisciplinary efforts
would not end up being rewarded, and I
should just stick with the tried and true
of unidisciplinary or specialized research
activities. Was he correct?
Before answering that question, let’s
consider how interdisciplinary research
can exist at different levels or degrees. As
a management professor specializing in
micro-level, organizational behavior, let’s
assume that I want to be more interdis-
ciplinary in my work. I could potentially
work on research projects that integrate
more macro-level phenomena. Indeed,
over the past 20 years I have written on
such topics as st rategic leadership (e.g.,
Waldman et al., 2001), corporate social
responsibility (e.g., Waldman et al., 2006),
and university technology transfer (Siegel
et al., 2003). My interdisciplinary work
in these areas has brought me together
with strategic management and infor-
mation systems researchers, economists,
and financial researchers. The common
denominator, however, is that all of this
work, and the individuals associated with
it, can be placed under the broad umbrella
of business-based research. By engaging in
interdisciplinary research involving neu-
roscience, one is “taking a walk on the
wild side,” so to speak, and perhaps this
is what my colleague was thinking about
when he cautioned me to “don’t quit your
day job.”
So what exactly are the institutional
impediments all about? Many of us con-
duct our research within the institutional
confines of universities and research out-
lets, specifically journals. Historically, the
structure of universities is very segmented
or siloed. Even the physical buildings in
which our offices are housed tend to
maintain this segmentation, e.g., offices
forpeopleinaparticulardepartment
Frontiers in Human Neuroscience www.frontiersin.org September 2013 | Volume 7 | Article 562
|
HUMAN NEUROSCIENCE
200

Waldman Interdisciplinary research is the key
or disciplinary area are largely in the
same location. Perhaps more importantly,
our reward systems (e.g., promotion and
tenure) tend to reinforce specialization.
As an organizational researcher, I have
received messages (some subtle, some not
so subtle) throughout my career that while
some dabbling in other areas might be per-
missible, I should not stray too far or too
much from my own specialization, or else
my own tenure, promotion, and reputa-
tioncouldbeputatrisk.Moreoverand
relatedly,Ihavebeentoldthatthebest
journals will not accept highly interdisci-
plinary research. Below I will attempt to
separate the myth from reality with regard
to publication issues.
Most of us are keenly aware of the
structural or institutional impediments to
interdisciplinary research. But perhaps we
are not so cognizant of our own per-
sonal issues that might preclude us from
engaging in such research. We are con-
ditioned early on as graduate students to
work on specialized projects. After gradu-
ation, we are then encouraged to gradually
make a name for ourselves in particu-
lar, focused streams of research. Rarely
does the thought of interdisciplinary activ-
ities take hold. Indeed, the networks that
we form, conferences that we attend, and
so forth, center around unidisciplinary
work.Inshort,wecangetbyjustfinein
our careers without becoming interdisci-
plinary. So why bother?
SEPARATING MYTH FROM REALITY
Before I provide my take on this question, I
first want to separate some myth from real-
ity.Thefirstmythisthatresearchersfrom
widely disparate disciplines either cannot,
or will not, come together to pursue inter-
disciplinary efforts. As an organizational
behaviorist, I will admit to having mixed
luck with regard to collaborative relation-
ships with neuroscientists. At times, it
has been challenging because of differ-
ing goals, perspectives, and the reality that
some neuroscientists themselves may not
be interested in the pursuit of interdisci-
plinary research.
But for the most part, I have been
able to form beneficial connections with
such individuals, and together we have
attempted to dispel a second myth.
Specifically, there is the myth that top
journals in organizational/management
will not accept interdisciplinary research,
especially when it crosses such a seemingly
huge boundary as the neuroscience realm.
This myth personifies the fear that my
colleague mentioned back in 2005 when
he cautioned me to not quit my day job.
The fear was that I simply would not be
able to place such research in the top jour-
nals in my field. To be sure, at the time,
there were no neuroscience-based articles
in organizational/management journals.
So his conclusion might seem warranted.
In addition, interdisciplinary submissions
can create difficulties for journal editors,
for example, finding suitable reviewers.
However,themoreentrepreneurially-
oriented editors of journals in my field
increasingly see the potential value in
accepting at least some interdisciplinary
articles, including those involving neuro-
science concepts and methods. In speaking
with editors of journals in my field,
they seem keenly aware of how neuro-
science is affecting other fields in business.
Examples include neuro-economics (e.g.,
Braeutigam, 2005; Camerer et al., 2005;
Kenning and Plassman, 2005) and neuro-
marketing (e.g., Lee et al., 2007). So
inclusion of neuroscience-based articles is
rapidly being viewed as more normal, and
less revolutionary. Since 2005, I personally
have been able to achieve a least a mod-
icum of success in such publication efforts,
largely involving neuroscientists as co-
authors (Peterson et al., 2008; Balthazard
et al., 2012; Hannah et al., 2013; Waldman
et al., 2013). Moreover, it is my experi-
ence that grant agencies and foundations
increasingly seek interdisciplinary research
proposals that involve co-investigators
from diverse backgrounds.
STEPS TOWARD BECOMING MORE
INTERDISCIPLINARY
The type of interdisciplinary research that
I have described here can be framed in
terms of the classic approach-avoidance
conflict. To a large extent, I have empha-
sized the salience of the approach aspects
that might make a researcher want to pro-
ceed with interdisciplinary work, while
minimizing potential avoidance reasons
for shunning pursuits of this nature. With
that said, I fully realize that a key con-
sideration on the avoidance side is the
ambiguity inherent in determining when
or how to make it happen. In other words,
when and how might one become more
interdisciplinary in his/her approach to
research, especially with regard to com-
bining neuroscience with fields of study
such as the organizational sciences? For
individuals whose primary focus is the lat-
ter, the first thing that I would caution is
to treat the potential integration of neu-
roscience as more of a personal vision,
rather than predominant reality, early on
in one’s career. In other words, as a doc-
toral student and in the early portion of
one’s career, it might be best to focus
largely on developing a focused specializa-
tion, while at the same time keeping in
mind and gradually working toward inter-
disciplinary possibilities.
Once one has determined to become
more interdisciplinary, there are two
avenues that might be pursued. First, an
individual can simply expand his or her
own domain of expertise to include an
area such as neuroscience. The obvious
limitation of this approach is that we all
have time constraints, as well as demands
to maintain expertise in our own special-
ized areas. To some degree, I personally
have followed this route. But because of
the sheer breadth and complexity of neu-
roscience, I have chosen a second avenue
for approaching neuroscience. Specifically,
I have partnered with trained neuroscien-
tists in terms of both publication and grant
activities. Indeed, I have found this sec-
ond avenue to be especially important as
a means of providing a better perspective
of neuroscience, and to deal with the com-
plexities of actual data collection and anal-
ysis processes (e.g., Balthazard et al., 2012).
For example, through collaboration with
neuroscientists, I have gained a better feel
for what “activity” in brain regions may
operationally be all about, as well as the
potential relevance of both intrinsic and
reflexive brain activity to organizational
phenomena (Waldman et al., 2013).
CONCLUDING THOUGHTS
Throughout this opinion piece, I have
focused on interdisciplinary work from the
viewpoint of a non-neuroscientist, such
as myself. But what about neuroscien-
tists; what might be their motivation to
work with organizational researchers? In
my own experience, I have had much more
success at connecting with neuroscientists
who combine the scientist-practitioner
Frontiers in Human Neuroscience www.frontiersin.org September 2013 | Volume 7 | Article 562
|
201

Waldman Interdisciplinary research is the key
model, including establishing their own
firms to produce applications to such mal-
adies as attention deficit disorder, sleep
apnea, and so forth. These individuals
have bonafide credentials in terms of their
basic understanding of neuroscience the-
ory and methods, but they are also inter-
ested in real-world applications. Thus, it
is a natur al extension of their work to
look toward the organizational world to
see how their expertise might be applied.
In contr ast, I have had less luck con-
necting with “pure” academics, for exam-
ple, social cognitive neuroscientists who
might be working in psychology depart-
ments of universities. However, I recognize
that there will be more such connec-
tions between organizational researchers
and basic neuroscience researchers in the
future.
In conclusion, it is my hope that this
commentary will help to provide some
insights into the issues and advantages
pertaining to interdisciplinary research
in the realm of organizations and neu-
roscience. There is much potential for
research of this nature to address some
of the larger problems facing organiza-
tions. In turn, by focusing attention on
organizational issues, new insights and
opportunities may present themselves for
neuroscientists.
REFERENCES
Balthazard, P., Waldman, D. A., Thatcher, R. W.,
and Hannah, S. T. (2012). Differentiating trans-
formational and non-transformational leaders on
the basis of neurological imaging. Leadership
Quart. 23, 244–258. doi: 10.1016/j.leaqua.2011.
08.002
Becker, W. J., Cropanzano, R., and Sanfey, A.
G. (2011). Organizational neuroscience: taking
organizational theory inside the neural black
box. J. Manage. 37, 933–961. doi: 10.1177/
0149206311398955
Braeutigam, S. (2005). Neuroeconomics—from neu-
ral systems to economic behaviour. Brain Res.
Bull. 67, 355–360. doi: 10.1016/j.brainresbull.2005.
06.009
Camerer, C., Loewenstein, G., and Prelec, D.
(2005). Neuroeconomics: how neuroscience can
inform economics. J. Econ. Lit. 43, 9–64. doi:
10.1257/0022051053737843
Hannah, S. T., Balthazard, P. A., Waldman, D.
A., Jennings, P., and Thatcher, R. (2013). The
psychological and neurological bases of leader
self-complexity and effects on adaptive decision-
making. J. Appl. Psychol. 98, 393–411. doi:
10.1037/a0032257
Kenning, P., and Plassman, H. (2005).
NeuroEconomics: an overview from an eco-
nomic perspective. Brain Res. Bull. 67, 343–354.
doi: 10.1016/j.brainresbull.2005.07.006
Lee, N. J., Senior, C., and Butler, M. J. R. (2012).
The domain of organizational cognitive neu-
roscience: theoretical and empirical challenges.
J. Manage. 38, 921–931. doi: 10.1177/014920631
2439471
Lee, N., Broderick, A. J., and Chamberlain, L. (2007).
What is ‘neuromarketing’? A discussion and
agenda for future research. Int. J. Psychophysiol. 63,
199–204. doi: 10.1016/j.ijpsycho.2006.03.007
Peterson, S., Balthazard, P. A., Waldman, D. A., and
Thatcher, R. W. (2008). Neuroscientific impli-
cations of psychological capital: are the brains
of optimistic, hopeful, confident, and resilient
leaders different? Organ. Dyn. 37, 342–353. doi:
10.1016/j.ougdyn.2008.07.007
Senior, C., Lee, N. J., and Butler, M. J. R. (2011).
Organizational cognitive neuroscience. Organ. Sci.
22, 804–815. doi: 10.1287/orsc.1100.0532
Siegel, D., Waldman, D. A., and Link, A. (2003).
Assessing the impact of organizational practices on
the relative productivity of university technology
transfer offices: an exploratory study. Res. Policy
32, 27–48. doi: 10.1016/S0048-7333(01)00196-2
Waldman, D. A., Balthazard, P. A., and Peterson,
S. (2011). The neuroscience of leadership:
can we revolutionize the way that leaders
are identified and developed? Acad. Manage.
Perspect. 25, 60–74. doi: 10.5465/AMP.2011.
59198450
Waldman, D. A., Ramírez, G., House, R. J., and
Puranam, P. (2001). Does leadership matter?
CEO leadership attributes and profitability
under conditions of perceived en vironmental
uncertainty. Acad. Manage. J. 44, 134–144. doi:
10.2307/3069341
Waldman, D. A., Siegel, D., and Javidan, M. (2006).
Components of transformational leadership and
corporate social responsibility. J. Manage. Stud.
43, 1703–1725. doi: 10.1111/j.1467-6486.2006.
00642.x
Waldman, D. A., Wang , D., Berka, C., Stikic, M.,
Balthazard, P. A., Richardson, T., et al. (2013).
“Emergent leadership and team engagement:
an application of neuroscience technology and
methods,” in Paper presented at the Meeting of
the Academy of Management, Orlando, August,
and published in the Best Paper Proceedings,
(Orlando, FL).
Received: 25 July 2013; accepted: 23 August 2013;
published online: 13 September 2013.
Citation: Waldman DA (2013) Interdisciplinary
research is the key. Front. Hum. Neurosci. 7:562.
doi:
10.3389/fnhum.2013.00562
This ar
ticle was submitted to the journal Frontiers in
Human Neuroscience.
Copyright © 2013 Waldman. This is an open-access
article distr ibuted under the terms of the Creative
Commons Attribution License (CC BY). The use, dis-
tribution or reproduction in other forums is permitted,
provided the original author(s) or licensor are credited
and that the orig inal publication in this journal is cited,
in accordance with accepted academic practice. No use,
distribution or reproduction is permitted which does not
comply with these terms.
Frontiers in Human Neuroscience www.frontiersin.org September 2013 | Volume 7 | Article 562
|
202

OPINION ARTICLE
published: 20 May 2014
doi: 10.3389/fnhum.2014.00304
Consumer neuroscience to inform
consumers—physiological methods to identify attitude
formation related to over-consumption and environmental
damage
Peter Walla
1
*
, Monika Koller
2
and Julia L. Meier
3
1
Functional Neuroimaging Lab, Centre for Translational Neuroscience and Mental Health Research, School of Psychology, University of Newcastle, Newcastle,
NSW, Australia
2
Department of Strategic Management, Marketing and Tourism, University of Innsbruck School of Management, Innsbruck, Austria
3
Department of Marketing, Vienna University of Economics and Business, Vienna, Austria
*Correspondence: peter.walla@newcastle.edu.au
Edited by:
Nick Lee, Loughborough University, UK
Reviewed by:
Kalyan Raman, Northwestern University, USA
Keywords: consumer neuroscience, emotion, attitude, objective measures, subjective measures, startle reflex modulation
INTRODUCTION
Climate change, the need for efficient
and environment-friendly energy use and
health-related issues like obesity and
addictions, these three cr ucial topics build
a triad that the global society has exten-
sively been discussing and caring about
during the past decades. First, according to
the recently published fifth IPCC climate
change assessment report (2013), intense
weatherconditionshavebeenonthe
rise. These changes will in extreme cases
impose life-threatening dangers to some
civilizations, but it will mostly influence
individual attitudes and decision-making
and thus finally modify consumption
behavior quite dramatically during the
next decades. Second, the European Union
is aiming for a 20% cut in Europe’s
annual primary energy consumption by
2020 (Energy Efficiency Plan, 2011). This
government-driven aim does not only
affect global industry, but again also the
consumption behavior of each individual
end-user. Third, according to the Wor ld
Health Organization (2013),worldwide
obesity has nearly doubled since 1980. In
fact, 65% of the world’s population lives
in countries where overweight and obe-
sity kills more people than underweight
(World Health Organization, 2013). Given
these unpleasant scenarios we need to get
active now in order to prevent the worst
and to ensure the best possible and highest
standards of life across the globe.
TARGETED RESEARCH IS REQUESTED
Fortunately, Horizon 2020, the seventh
framework program of the European
Commission relates to the abovemen-
tioned areas as being important research
topics, which need to be investigated more
comprehensively until 2020 (European
Commission, 2013). However , given their
rather global political nature how can reli-
able respective research be done ideally
taking all of these three main concerns into
account in one go while at the same time
providing useful insight?
Decision-making and attitude forma-
tion seem to be the common denomi-
nator. What are the true attitudes of an
average consumer as the smallest unit
in a society? What does a consumer
think about his/her individual role within
these current dynamics? After all, the
actual goal is to understand why one is
over-consuming, pursuing an unhealthy
lifestyle and wasting household energy,
although actually knowing about the neg-
ative consequences? Unfortunately, know-
ing the right questions is not enough, we
also need adequate research that provides
reliable answers, which let us understand
and predict human behavior, particularly
consumers’ choices. Of course, a lot of
research has been done, but traditional
research approaches are potentially mis-
leading as highlighted by various studies
comparing explicit with implicit responses
(Spector, 1994).
WHAT ALTERNATIVE MEASURES DO
WE HAVE?
Ultimately, all human behavior is a
consequence of both cognitive and
affective processing, but only cognitive
aspects can be reliably captured through
questionnaire-based investigations, while
affective processing happens largely out-
side our awareness (Walla and Panksepp,
2013). Consumer decision-making and
attitude formation are strongly engag-
ing affective processing and incomplete
understanding and suboptimal investi-
gations might come along with severely
negative consequences for the individ-
ualaswellasforthesocietyandtheentire
environment. Just to think of one example,
when it comes to study the acceptance of
new household technologies that are more
energy efficient one could get strongly
biased and misleading results if only using
self-report approaches. Consequently, the
potential gap between explicitly stated
intention to use power saving household
tools and actual future behavior would not
help to improve the situation. Especially,
topics related to environmental issues are
prone to be biased by social desirability
and various other often unknown pres-
sures (Glasman and Albarracin, 2006).
Similarly, issues related to eating behavior
resulting in overweight do rarely have pure
cognitive origins, but most commonly are
based on emotions grounding on an affec-
tionate and attitude based source. Among
Frontiers in Human Neuroscience www.frontiersin.org May2014|Volume8|Article304
|
HUMAN NEUROSCIENCE
203

Walla et al. Neuroscience and consumer attitude
these are emotion regulation, fear and
stress (Kemp et al., 2013).
Given this major shortcoming of self-
reports in terms of measuring affective
processing in the consumer brain, neu-
roscientific methods are here suggested
toprovideaddedvalueinthisrespect.
However, not all methods from consumer
neuroscience are equally suitable. Besides
its merits to gather information on funda-
mental experimental effects, the capabili-
ties of brain imaging techniques like fMRI
(functional Magnet Resonance Imaging)
to study real consumption behavior are
limited. In case one wants to study pur-
chase decisions directly at the point of sale
the use of fMRI renders itself impossi-
ble. In addition, fMRI is a very expensive
technology. Luckily, more affordable while
also more reliable methods are available
to make the desired progress in studying
consumer likes and dislikes, their attitudes
and finally to predict their actual behavior.
Recent studies that focused on compar-
isons between explicit and implicit mea-
suresofaffectasinlikeanddislikeclearly
showed that discrepancies between self-
reported like and objectively measured like
can occur (Geiser and Walla, 2011; Grahl
et al., 2012; Mavratzakis et al., 2013). From
these and a number of other studies it can
be concluded that whenever such discrep-
ancies occur respective self-repor ted likes
or dislikes have to be treated with great
caution.
Some of these studies utilized a
long known approach to tap into non-
conscious raw affective processing in the
human brain, a phenomenon known as
startle reflex modulation (SRM). SRM is
a valid approach to selectively measure
the valence of affective information pro-
cessing. It is easy to apply also in a field
setting and can perfectly be combined
with methods measuring the associated
level of arousal, like skin conductance and
heart rate (Dawson et al., 1999; Walla
et al., 2011). Measuring the underlying
forces of behavior other than mere stated
intention is also crucial regarding health-
related issues with respect to consumption.
Applying neuroscientific methods like
SRM and maybe electroencephalography
(EEG) (Bosshard and Walla, 2013 ) can be
useful in this regard as well (e.g., Walla
et al., 2010 used these methods to study
the emotion impact of food intake).
WHAT SPECIFIC RESEARCH SHOULD
WE FOCUS ON?
Although obviously different in many
respects, a closer look at climate change,
environment-friendly energy as well as
health reveals that their individually
associated behaviors are all remarkably
dependent on attitudes. Attitudes form
important bases for behavior and thus
knowingthemallowsustopredictbehav-
ior. For instance, an attitude like “global
warming is natural, not man-made” is
likely associated with future behavior that
does not really do anything against it.
Also, health issues do of course strongly
depend on the right attitudes. Attitudes
are consciously (explicitly) and non-
consciously (implicitly) learned and as
such are prone to change be it driven by
more or less random individual experi-
ences or by planned and strategic political
or marketing campaigns. They are shaped
by intellectual elaboration, but they also
have a strong affective component, which
reflects aspects of basic like or dislike.
Crucially, and that is what makes atti-
tudes empir ically testable, they can be
modified as a consequence of learn-
ing processes such as conditioning (e.g.,
Hofmann et al., 2010). In particular, eval-
uative conditioning is often used where
for instance “nature” is repeatedly paired
with positive unconditioned stimuli to
finally create a positive nature-attitude in
children preparing them for a nature pro-
tecting adulthood. Through e valuative
conditioning, unknown and even dis-
liked can be turned into liked. Obviously,
evaluative conditioning and its effects
on attitudes seems to be a very promis-
ing and meaningful field to investigate.
Together with neuroscientific methods
and techniques the investigation of atti-
tudes, their formation and their changes
are here clearly emphasized as being most
successful when it comes to predicting
human behavior (see Bosshard and Walla,
2013).
THE MAIN TAKE HOME MESSAGE
Crucially, and this forms the main take
home message of this opinion article, the
use of surveys only taps into the explicit
(conscious) aspect of a consumer’s atti-
tude, whereas implicit aspects are not
at all reflected in self-reported data (see
Rugg et al., 1998; Walla et al., 1999).
This is potentially misleading, because
implicit attitudes have been shown
to be better predictors of particularly
spontaneous behavior (Gawronski and
Bodenhausen, 2012). Explicit attitudes
are deliberate evaluations formulated
through reasoning and consequently even
if the individual subjectively perceives
their outlook toward it to be positive,
negative associations can be activated,
andviceversa(Devine, 1989). Implicit
attitudes are independent of higher cog-
nitive resources and occur irrespective
of their alignment with the individ-
ual’s introspective assessment. They are
non-conscious and thus only accessi-
ble via objective measures such as SRM
and EEG.
TALK BETWEEN SCIENCE COMMUNITY
AND SOCIETY
It is necessary to continuously engage
in an educated dialog with the average
consumer. This means that one precon-
dition for being able to realize such a
dialog is to translate the research find-
ings into a language that is actually
being understood by the society. Doing
so allows creating added value for the
society through science. In a nutshell,
this opinion article outlines how con-
sumer neuroscience may be used to cre-
ate societal value. The more we know
about non-conscious processes that drive
human behavior the more each individ-
ual consumer knows and thus can bet-
ter understand and finally control his
own behavior. Neuroscientific methods in
general and SRM and EEG in particu-
lar, might serve as valid instruments for
addressing consumption-related issues of
the topical triad that are important to
build a larger picture in terms of soci-
ety and well-being. This opinion article
may provide vital insights for advancing
academic knowledge but also provide the
basis for guidelines for experts and policy
makers.
The authors of this article declare
that the research was conducted in the
absence of any commercial or financial
relationships that could be construed as
a potential conflict of interest. At no
time did the authors or their institutions
receive payment or services from a third
party for any aspect of the submitted
work.
Frontiers in Human Neuroscience www.frontiersin.org May2014|Volume8|Article304
|
204

Walla et al. Neuroscience and consumer attitude
AUTHOR CONTRIBUTIONS
All three authors (Peter Walla, Monika
Koller, and Julia L. Meier) meet all of the
below listed criteria:
• Substantial contributions to the concep-
tionordesignofthework;ortheacqui-
sition, analysis, or interpretation of data
for the work; AND
• Drafting the work or revising it critically
for important intellectual content; AND
• Final approval of the version to be pub-
lished; AND
• Agreement to be accountable for all
aspects of the work in ensuring that
questions related to the accuracy or
integrity of any part of the work are
appropriately investigated and resolved.
REFERENCES
Bosshard, S., and Walla, P. (2013). Objective
Measures Within Consumer Neuroscience. Front.
Hum. Neurosci. Conference Abstract: ACNS-
2013 Australasian Cognitive Neuroscience Society
Conference. doi: 10.3389/conf.fnhum.2013.212.
00082
Dawson,M.E.,Schell,A.M.,andBöhmelt,A.
H. (1999). “Startle modification: introduc-
tion and overview,” in Startle Modification.
Implications for Neuroscience, Cognitive Science,
and Clinical Science, eds M. E. Dawson, A.
M. Schell, and A. H. Böhmelt (Cambridge:
Cambridge University Press), 6–18. doi:
10.1017/CBO9780511665523.003
Devine, P. G. (1989). Stereotypes and prejudice: their
automatic and controlled components. J. Pers. Soc.
Psychol. 56, 5–18. doi: 10.1037/0022-3514.56.1.5
Energy Efficiency Plan. (2011). Available online
at: http://ec.europa.eu/energy/efficiency (Accessed
October 2, 2013).
European Commission. (2013). Available online at:
http://rp7.ffg.at (Accessed October 2, 2013).
Gawronski, B., and Bodenhausen, G. V. (2012). Self-
Insight From a Dual-Process Perspective Handbook
of Self-Knowledge. New York, NY: Guilford
Press.
Geiser, M., and Walla, P. (2011). Objective mea-
sures of emotion during virtual walks through
urban environments. Appl. Sci. 1, 1–11. doi:
10.3390/as1010001
Glasman, L. R., and Albarracin, D. (2006).
Forming attitudes that predict future behav-
ior: a meta-analysis of the attitude-behavior
relation. Psychol. Bull. 132, 778–822. doi:
10.1037/0033-2909.132.5.778
Grahl, A., Greiner, U., and Walla, P. (2012). Bottle-
shape elicits gender-specific emotion: a startle
reflex modulation study. Psychology 3, 548–554.
doi: 10.4236/psych.2012.37081
Hofmann, W., De Houwer, J., Perugini, M., Baeyens,
F., and Crombez, G. (2010). Evaluative condition-
ing in humans: a meta-analysis. Psychol. Bull. 136,
390–421. doi: 10.1037/a0018916
IPCC Climate Report. (2013). Available online
at: http://www.climatechange2013.org (Accessed
October 2, 2013).
Kemp, E., Bui, M., and Grier, S. (2013). When food
is more than nutrition: understanding emotional
eating and overconsumption. J. Consum. Behav.
12, 204–213. doi: 10.1002/cb.1413
Mavratzakis, A., Molloy, E., and Walla, P.
(2013). Modulation of the startle reflex
during brief and sustained exposure to emo-
tional pictures. Psychology 4, 389–395. doi:
10.4236/psych.2013.44056
Rugg,M.D.,Mark,R.E.,Walla,P.,Schloerscheidt,A.
M., Birch, C. S., and Allan, K. (1998). Dissociation
of the neural correlates of implicit and explicit
memory. Nature 392, 595–598. doi: 10.1038/33396
Spector, P. (1994). Using self-report questionnaires in
place OB research: a comment on the use of a con-
troversial method. J. Organ. Behav. 15, 385–392.
doi: 10.1002/job.4030150503
Walla, P., Brenner, G., and Koller M. (2011). Objective
measures of emotion related to brand attitude:
a new way to quantify emotion-related aspects
relevant to marketing. PLoS ONE 6:e26782. doi:
10.1371/journal.pone.0026782
W
alla,
P., Endl, W., Lindinger, G., Deecke, L., and
Lang, W. (1999). Implicit memory within
a word recognition task: an event-related
potential study in human subjects. Neurosci.
Lett. 269, 129–132. doi: 10.1016/S0304-3940(99)
00430-9
Walla, P., and Panksepp, J. (2013). Neuroimaging
Helps to Clarify Brain Affective Processing
Without Necessarily Clarifying Emotions, Novel
Frontiers of Advanced Neuroimaging,edK.
Fountas (InTech). ISBN: 978-953-51-0923-5.
Available online at: http://www.intechopen.com/
books/novel-frontiers-of-advanced-neuroimaging/
neuroimaging - helps - to - clarify - brain - affective -
without-necessarily-clarifying-emotions
Walla, P., Richter, M., Färber, S., Leodolter, U.,
and Bauer, H. (2010). Food-evoked changes in
humans: startle response modulation and event-
related brain potentials (ERPs). J. Psychophysiol.
24, 25–32. doi: 10.1027/0269-8803/a000003
World Health Organization. (2013). Available online
at: http://www.who.int/mediacentre/factsheets
(Accessed October 2, 2013).
Conflict of Interest Statement: The Associate Editor,
Dr. Nick Lee declares that, despite having collabo-
rated with the author Dr. Monika Koller, the review
process was handled objectively and no conflict of
interest exists. The authors declare that the research
was conducted in the absence of any commercial or
financial relationships that could be construed as a
potential conflict of interest.
Received: 24 January 2014; accepted: 25 April 2014;
published online: 20 May 2014.
Citation: Walla P, Koller M and Meier JL (2014)
Consumer neuroscience to inform consumers—
physiological methods to identify attitude formation
related to over-consumption and environmental dam-
age. Front. Hum. Neurosci. 8:304. doi: 10.3389/fnhum.
2014.00304
This article was submitted to the journal Frontiers in
Human Neuroscience.
Copyright © 2014 Walla, Koller and Meier. This is an
open-access article distributed under the terms of the
Creative Commons Attribution License (CC BY). The
use, distribution or reproduction in other forums is per-
mitted, provided the original author(s) or licensor are
credited and that the original publication in this journal
is cited, in accordance with accepted academic practice.
No use, distribution or reproduction is permitted which
does not comply with these terms.
Frontiers in Human Neuroscience www.frontiersin.org May2014|Volume8|Article304
|
205

EPFL Innovation Park · Building I · 1015 Lausanne · Switzerland
T +41 21 510 17 00 · info@frontiersin.org · frontiersin.org
ADVANTAGES OF PUBLISHING IN FRONTIERS
TRANSPARENT
Editors and reviewers
acknowledged by name
on published articles
OPEN ACCESS
Articles are free to read,
for greatest visibility
GLOBAL SPREAD
Six million monthly
page views worldwide
SUPPORT
By our Swiss-based
editorial team
COPYRIGHT TO AUTHORS
No limit to
article distribution
and re-use
IMPACT METRICS
Advanced metrics
track your
article’s impact
RESEARCH NETWORK
Our network
increases readership
for your article
COLLABORATIVE
PEER-REVIEW
Designed to be rigorous –
yet also collaborative, fair and
constructive
FAST PUBLICATION
Average 90 days
from submission
to publication
