This website is based on an online survey conducted at a statistical research methods workshop in 2015 at the University of Plymouth. The survey clearly demonstrated that the vast majority (<90%) of professional academic researchers do not understand the meaning of p-values (despite the fact that they earn their “bread-and-butter” by relying on this metric for their conclusions). This is a ubiquitous problem with profound real-world ramifications as many important and far-reaching decisions are based on (or justified with) p-value classification.
“Few researchers are aware that their own heroes rejected what they practice routinely. Awareness of the origins of the ritual and of its rejection could cause a virulent cognitive dissonance, in addition to dissonance with editors, reviewers, and dear colleagues. Suppression of conflicts and contradicting information is in the very nature of this social ritual.”
The HTML5 version of the PowerPoint presentation can be viewed under the following URL: https://christopher-germann.de/papers/pitfalls-of-nhst/
Belief bias in inferential statistics
On the ubiquity of fallacious inductive inferences in scientific reasoning
Null hypothesis significance testing (NHST) is one of the most widely used inferential statistical techniques used in science. However, the conditional syllogistic logic which underlies NHST is often poorly understood by researchers. That is, researchers using NHST often misinterpret the results of their statistical analyses. Fallacious scientific reasoning is a problem with huge ramifications. If researchers regularly misinterpret the meaning of p-values this implies that the conclusions they derive from their research are often logically invalid. How often is an empirical question which is worth investigating in more detail.
This paper briefly describes the results of a small-scale survey we conducted at the interdisciplinary “CogNovo Research Methods Workshop” at Plymouth University in June 2014. Participants were Phd students, research fellows, lecturers, and professors who attended the workshop with the adequate title “The Pitfalls of Hypothesis Testing”. At the very beginning attendees were asked to interpret the results of the following simple independent means t test.
Participants were asked to mark each of the statements below as “True” or “False” (adapted from Oakes, 1986).
| Suppose you have a treatment which you suspect may alter performance on a certain task. You compare the means of your control and experimental group (say 20 subjects in each sample). Further, suppose you use a simple independent means t test and your result is (t = 2.7, d.f. 18, p = 0.01). Please mark each of the statements below as “True” or “False”.
(1) You have absolutely disproved the null hypothesis *Adapted from Oakes, M. (1986). Statistical inference: A commentary for the social and behavioral sciences. New York: Wiley. |
The t test at hand is a very basic exemplar of the kind of significance testing which many scientists routinely employ. Hence, its correct interpretation is of paramount importance for many far-reaching real world decisions and the progress of science in general.
In our small scale experiment we utilized a custom made web-based questionnaire in order to collect the responses from participants. We asked only those workshop attendees who had prior experience with statistical significance testing to participate. A total of 18 participants responded to each of the 6 statements within ≈ 5minutes by using their mobile phones, notebooks, or tablets. The resulting data-set is available under the following URL: http://tinyurl.com/lus94kq
The powerpoint slides used in this presentation can be dowloaded here as a PDF.
We analysed the data in real-time during the presentation of the talk using the appended code in R (see Appendix 1). Altogether, only one participant responded correctly to all statements. The remaining 17 participants indicated that at least 1 of the 6 statements would be correct. Note that the p-value is the probability of the observed data (or of more extreme data points), given that the null hypothesis H0 is true, defined in symbols as p(D|H0). The results of the survey are visualized in Figure 1.
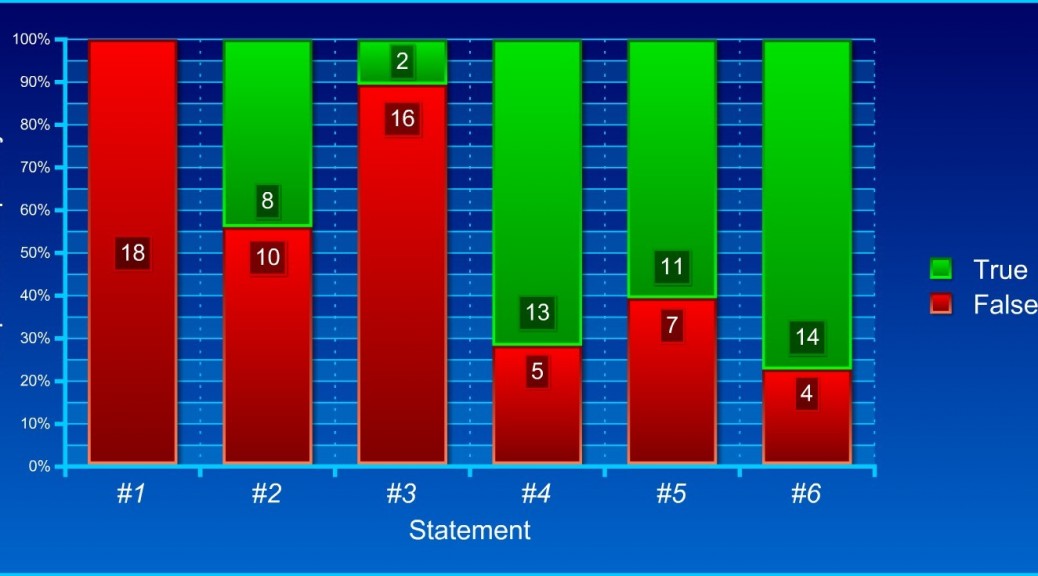
Figure 1. Number of participants who either endorsed or rejected each statement.
Logical fallacies in interpretation
The following paragraphs will deconstruct the logical fallacies committed by the majority of participants.
The t statistic to test whether the means are different can be calculated as shown in Equation 1:
\[
\ s_{X_1X_2} = \sqrt{\frac{1}{2}(s_{X_1}^2+s_{X_2}^2)}
\]
Here sx1x2 is the grand standard deviation (or pooled standard deviation), 1 = group one, 2 = group two. s2x1 and s2x2 are the unbiased estimators of the variances of the two samples. The denominator of t is the standard error of the difference between two means. For significance testing, the degrees of freedom for this test is 2n − 2 where n is the number of participants in each group.
Statements 1 and 3 are easily detected as logically invalid. A significance test can never prove or disprove the null hypothesis or the experimental hypothesis with certainty. Statement 1 and 3 are instances of the epistemological illusion of certainty (Gigerenzer, 2002). As can be seen in Figure 1, all participants gave the correct response to statement 1, however, 2 participants believed that statement 2 is true.
Statements 2 and 4 are also false. The probability p(D|H0) is not the same as p(H0|D), and more generally, a significance test does never provide a probability for a hypothesis. To equate the direct probability with its inverse is an illusionary quasi-Bayesian interpretation of p(D|H0). This has been termed the inverse problem.
p(D|H0) ≠ p(H0|D)
This particular illusion has been perpetuated by many statistics textbooks (for further examples see Gigerenzer, 2000). For instance, in one of the early texts “Guilfords’ Fundamental Statistics in Psychology and Education” the p values turns miraculously into a Bayesian posterior probability:
“If the result comes out one way, the hypothesis is probably correct, if it comes out another way, the hypothesis is probably wrong” (p. 156). Guilford is no exception. He signifies the beginning of a class of statistical texts that presents significance testing as a hybrid between Fisherian and Neyman/Pearsonian methods without mentioning its origins (Gigerenzer 2000 terms this “the denial of parents”). Neither Fisher or Neyman/Pearson would have agreed upon the hybrid method because they disagreed vehemently. The currently used hybrid additionally confuses the researchers’ desire for probabilities of hypotheses and what significance testing can actually provide (that is, a Baysian interpretation is added to the already incompatible combination).
Statement 5 also refers to a probability of a hypothesis. This is because if one rejects the null hypothesis, the only possibility of making a wrong decision is if the null hypothesis is true. Thus, it makes essentially the same claim as Statement 2 and 4 do, and both are incorrect.
Statement 6 amounts to the replication fallacy (Gigerenzer, 1993, 2000). Here, p=1% is taken to imply that such significant data would reappear in 99% of the repetitions.
However: p(D|H0) does not entail any information about p(Replication)
Especially the replication fallacy seems to be widespread. For example, the editor of the top ranking Journal of Experimental Psychology stated that he used the level of statistical significance reported in submitted papers as the measure of the “confidence that the results of the experiment would be repeatable under the conditions described” (Melton, 1962, p. 553). Contrary to his belief, the p-value conveys no information at all about the replicability of an experimental finding.
Logical inconsistency between responses
Statement 2, 4, and 5 are logical implications of one another. To be logically consistent all three statements should either be rejected or approved.
- 8 participants were inconsistent when responding to statement 2, 4, and 5.
- 3 participants described all three statements correctly as false.
- 7 (although wrongly) described all three statements as true.
Figure 2. Consistency rates.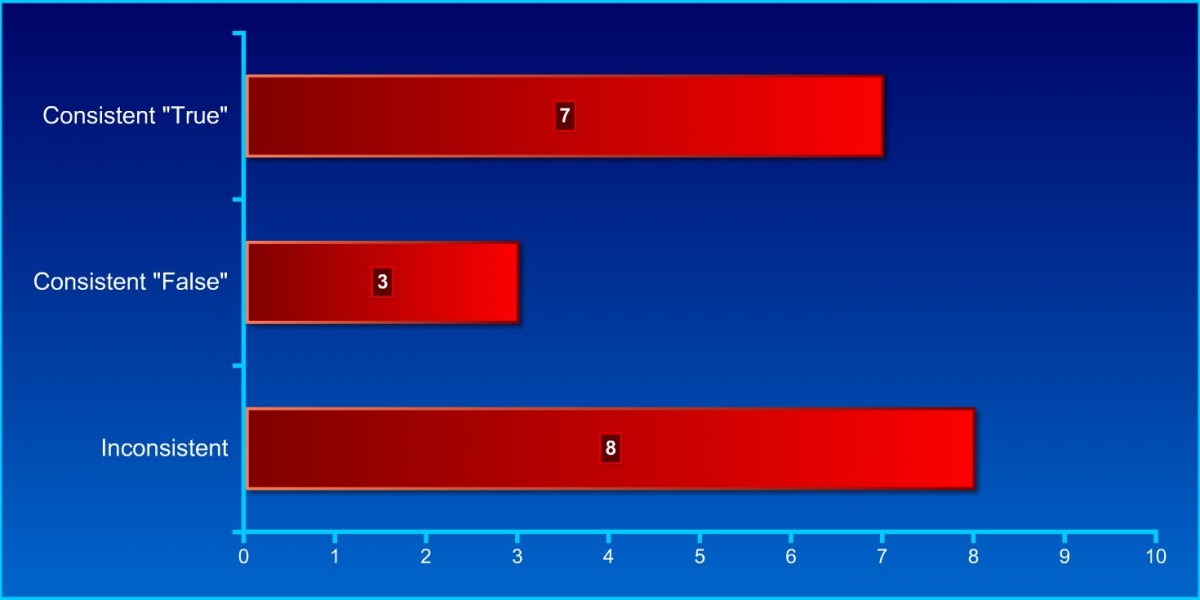
International comparison with other universities
Table 1. Comparison between universities and between academic groups.
| Plymouth University (UK) | Psychological Departments of German Universities | USA (Oakes, 1986) | |||
| Current experiment | MethodologyInstructors | ScientificPsychologists | PsychologyStudents | AcademicPsychologists | |
| #1) H0 is absolutely disproved | 0% | 10% | 15% | 34% | 1% |
| #2) Probability of H0 is found | 44% | 17% | 26% | 32% | 36% |
| #3) H1 is absolutely proved | 11% | 10% | 13% | 20% | 6% |
| #4) Probability of H1 is found | 61% | 33% | 33% | 59% | 66% |
| #5) Probability of Type I error | 72% | 73% | 67% | 68% | 86% |
| #6) Probability of replication | 77% | 37% | 49% | 41% | 60% |
Overall, statement 1, 2, and 3 are more often correctly falsified as compared to statement 4, 5, and 6.
Table 2. The amount of wrong interpretations of p = 0.01. The table shows the percentage in each group who endorsed one or more of the six false statements (Haller & Krauss, 2002).
| Professors and lecturers teaching statistics (N=30): | 80% |
| Professors and lecturers (N=39): |
90% |
| Students (N=44): |
100% |
Discussion
The results of this investigation have serious implications because they demonstrate that the misinterpretation of NHST is still a ubiquitous phenomenon among researchers in different fields, despite the fact that this issue has been strenuously pointed out repeatedly before (Rozeboom , 1960; Meehl, 1978; Loftus, 1991; Simon, 1992; Gigerenezer, 1993; Cohen, 1994). We argue that wishful Bayesian thinking (made possible by fallaciously mistaking direct probabilities for inverse probabilities) lies at the core of these pertinacious cognitive illusions. Unfortunately, far reaching real world decisions are based on the conclusions drawn from these demonstrably widely misunderstood test procedures.Therefore, educational curricula should make sure that students understand the logic of null hypothesis significance testing.
The syllogistic logic of NHST
From a logical point of view NHST is based upon the logic of conditional syllogistic reasoning (Cohen, 1994). Compare the following syllogisms of the form modus ponens:
Syllogism 1
1st Premise:
If the null hypothesis is true, then this data (D) can not occur.
2nd Premise:
D has occurred.
Conclusion:
∴ H0 is false.
If this were the kind of reasoning used in NHST then it would be logically correct. In the Aristotelian sense, the conclusion is logically valid because it is based on deductive proof (in this case denying the antecedent by denying the consequent). However, this is not the logic behind NHST. By contrast, NHST uses hypothetical syllogistic reasoning (based on probabilisties), as follows:
Syllogism 2
1st Premise:
If H0 is true, then this data (D) is highly unlikely.
2nd Premise:
D has occurred.
Conclusion:
∴ H0 is highly unlikely.
By making the major premise probabilistic (as oposed to absolute, cf. Syllogism 1) the syllogism becomes formally incorect and consequently leads to an invalid conclusion. The following structure of syllogistic reasoning is implicitly used by many authors in uncountable published scientific articles. This logical fallacy has been termed the “the illusion of attaining improbability”. (Cohen, 1994, p.998).
Syllogism 3
1st Premise:
If H0 is true, then this data (D) is highly unlikely.
2nd Premise: D
has occurred.
Conclusion:
∴ H0 is probably false.
Note: p(D|H0) ≠ p(H0|D)
Belief bias and wishful thinking in scientific reasoning
Most importantly, all fallacious interpretations are unidirectional biased: they make the informational value of p appear bigger than it in reality is. In other words, researchers are positively biased with regards to the interpretation of p-values because they attribute more informational value to the p-value than it actually contains.
Cohen (1994, p.997) formulated the problem very clearly: “What’s wrong with significance testing? Well, among many other things, it does not tell us what we want to know, and we so much want to know what we want to know that, out of desperation, we nevertheless believe in that it does! What we want to know is ‘given these data, what is the probability that H0 is true? But as most of us know, what it tells us is given that H0 is true, what is the probability of these or more extreme data.” (italics added)
Moreover, Gigerenzer (2000) clearly agrees with Cohen (1984) that the currently used hybrid logic of significance testing is “A mishmash of Fisher and Neyman-Pearson, with invalid Bayesian interpretation” (Cohen, 1994, p. 998). The historical genesis of the hybrid is very revealing. An eye-opening historical perspective on the widely unacknowledged but fierce debate between Fisher and Neyman/Pearson is provided by Gigerenzer (1987).
Implications
Given that inferential statistics lies at the very heart of scientific reasoning, it is essential that researchers have a firm understanding of the actual informative value which can be derived from the inferential techniques they employ. Otherwise they are unable to draw valid statistical conclusions. Future studies with academicians and PhD students from different disciplines are needed to determine the “epidemiology[1]” of these statistical illusions and biases. The next step would be to develop and study possible cognitive interventions and antidotes (but see Lecoutre et al., 2003).
We suggest that is necessary to design novel pedagogical concepts and curricula in order to teach the logic of NHST to students. Moreover alternative statistical inferential methods (e.g., Bayesian) should be taught to students given that there is no “magic bullet” or “best” inferential method per se. Gigerenzer (1993) points out that “it is our duty to inform our students about the many good roads to statistical inference that exist, and to teach them how to use informed judgment to decide which one to follow for a particular problem” (p. 335). We strongly agree with this proposition.
References
Basu, D. (1980). Randomization Analysis of Experimental Data: The Fisher Randomization Test. Journal of the American Statistical Association, 75(371), 575-582.
Cohen, J. (1994). The earth is round (p<.05). American Psychologist, 49, 997-1003.
Dürr, H.P. (2001). Wir erleben mehr, als wir begreifen. Herder Spektrum.
Gigerenzer, G. (1993). Über den mechanischen Umgang mit statistischen Methoden [The mechanical use of statistical methods]. In E. Roth & K. Heidenreich (Eds.), Sozialwissenschaftliche Methoden: Lehr- und Handbuch für Forschung und Praxis (3rd, rev. ed., pp. 607-618). München: Oldenbourg.
Gigerenzer, G., & Murray, D. (1987). Cognition as intuitive statistics. Hillsdale, N J: Erlbaum.
Gigerenzer, G. (2000) Adaptive Thinking: Rationality in the Real World. New York: Oxford University Press.
Haller, H., & Krauss, S. (2002). Misinterpretations of significance: A problem students share with their teachers? Methods of Psychological Research, 7, 1–20.
Loftus, G. R. (1991). On the tyranny of hypothesis testing in the socal sciences. Contemporary Psychology, 36, 102-105.
Lecoutre, M.P., Poitevineau, J., Lecoutre, B., 2003. Even statisticians are not immune to misinterpretations of Null Hypothesis Significance Tests. International Journal of Psychology, 38, 37–45.
Meehl, P.E., 1978. Theoretical risks and tabular asterisks: Sir Karl, Sir Ronald, and the slow progress of soft psychology. Journal of Consulting and Clinical Psychology, 46, 806–834.
Melton, A.W., 1962. Editorial. Journal of Experimental Psychology, 64, 553–557.
Morrison. D. E., & Henkel, R. E. (Eds.). (1970). The significance test controversy. Chicago: Aldine.
Nickerson, R.S., 2000. Null hypothesis significance testing: a review of an old and continuing controversy. Psychological Methods, 5, 241–301.
Oakes, M. (1986). Statistical inference: A commentary for the social and behavioral sciences. New York: Wiley.
Simon, H.A., 1992. What is an “explanation” of behavior? Psychological Science, 3, 150–161.
Rozeboom, W. W. (1960). The fallacy of the null hypothesis significance test. Psychological Bulletin, 57,416-428.
R is open source software and available for download under the following URL:
http://www.r-project.org
#library(RCurl)
#install.packages("RCurl", contrib.url="http://cran.rstudio.com")
#download data from server
api = function(key,query,gid=0){tmp=getURL(paste(
 sep="",'https://spreadsheets.google.com/tq?',
 'tqx=out:csv',
 '&tq=',curlEscape(query),
 '&key=',key,'&gid=',gid),
 ssl.verifypeer=FALSE)
 return(read.csv(textConnection(tmp)))
}
#key for spreadsheet
p=api('0ArGYdGO1obvSdEs5dnYtMlBuckhhMHdmNDVDZkIxT2c',
'select * order by F limit 100')
#write summary
summary(p)
#recode
yes = c()
no = c()
for(i in 1:6){
  yes[i] = sum(p[,i])
  no[i] = length(p[,i]) - sum(p[,i])
}
#plot data
barplot(rbind(yes,no),
        beside=FALSE,
        main="Frequencies of TRUE and FALSE responses",
        xlab="Statement",
        ylab="Number of responces",
        legend.text = c("TRUE", "FALSE"),
        args.legend = list(x = "topright", bty = "n", inset=c(-0.05, -0.15)),
        names.arg=c("#1","#2","#3","#4", "#5", "#6"),
        col=c("green","red")
)
The lady tasting tea: A famous randomized experiment devised by Ronald A. Fisher and reported in his book The Design of Experiments in 1935. It has been argued that “the famous case of the ‘lady tasting tea'” was “one of the two supporting pillars […] of the randomization analysis of experimental data” (Basu, 1980).
Related pages